HAL Id: halshs-00562635
https://halshs.archives-ouvertes.fr/halshs-00562635
Preprint submitted on 3 Feb 2011
HAL is a multi-disciplinary open access archive for the deposit and dissemination of sci-entific research documents, whether they are pub-lished or not. The documents may come from teaching and research institutions in France or
L’archive ouverte pluridisciplinaire HAL, est destinée au dépôt et à la diffusion de documents scientifiques de niveau recherche, publiés ou non, émanant des établissements d’enseignement et de recherche français ou étrangers, des laboratoires
Economic Reforms: The Case of MENA Countries
Ahmet Faruk Aysan, G. Pang, Marie-Ange Véganzonès-Varoudakis
To cite this version:
Ahmet Faruk Aysan, G. Pang, Marie-Ange Véganzonès-Varoudakis. Assessing the Responsiveness of Private Investment to Economic Reforms: The Case of MENA Countries. 2011. �halshs-00562635�
Document de travail de la série Etudes et Documents
E 2006.23
Assessing the Responsiveness of Private Investment to
Economic Reforms: The Case of MENA Countries
by
Ahmet Aysan
Bogazici University, Dept. of Economics, Istanbul, Turkey.
Gaobo Pang
University of Maryland, Dept. of Economics, College Park, USA. and
Marie-Ange Véganzonès -Varoudakis
Assessing the Responsiveness of Private Investment to
Economic Reforms: The Case of MENA Countries
Abstract
During the 1980s and the 1990s, private investment in the Middle East and North Africa (MENA)
has on average shown a decreasing or stagnant trend. This contrasts with the situation of the
Asian economies, where private investment has always been more dynamic. In this paper, it is
empirically shown for a panel of 39 developing economies--among which four MENA countries--
that in addition to the traditional determinants of investment--such as the growth anticipations and
the real interest rate--government policies explain MENA’s low investment rate. Insufficient structural reforms--which have most of the time led to poor financial development and deficient
trade openness--have been a crucial factor for the deficit in private capital formation. The
economic uncertainties of the region have represented another factor of the firm’s decisions not to
invest. These uncertainties have consisted of the external debt burden and various measures of
1- Introduction
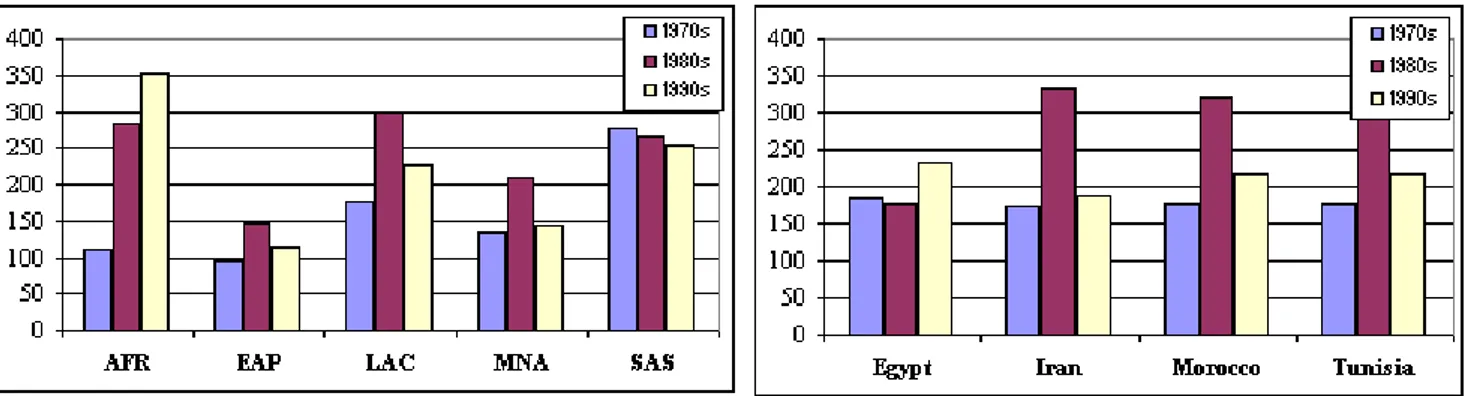
With the liberalization of economies and the acceleration of reforms, private investment increased throughout the world in the 1990s. The Middle East and North Africa (MENA) countries followed this pattern but at a much slower pace (see Figures 1 and 2). While private investment to GDP grew by 3.1 percent in MENA, this rate reached 10 percent in Latin America (LAC), Africa (AFR), and East Asia (EAP) despite the financial crisis, and 23 percent in South Asia (SAS)1.
Figure 1: Private Investment by Region (% GDP) Figure 2: Private Investment in MENA (% GDP)
Source : Authors’ calculations Source : Authors’ calculations
In this paper, we address the question of the determinants of private investment. For this purpose, a model is provided and estimated from 1973-80 to 1999 for a panel of 39 countries--among which four MENA economies (see Appendix 1 for the list of countries)2. This model determines which factors account for the low performances of the MENA region, and identifies the incentives to be provided to boost private investment in the future.
Private investment has always been recognized as an essential factor for economic growth (Figure 3). The distinction between private and public investment is crucial given
1 These calculations are based on a sample of 81 developing countries between 1980 and 1999. 2 The MENA countries studied have been determined by the availability of reliable data.
that private investment is considered to be more productive than public investment, (Serven and Solimano, 1990; Khan and Reinhart, 1990; Khan and Kumar, 1997). Whereas public investment is generally considered to crowd out private investment (Sundararajan and Thakur, 1980; Balassa, 1988 ; Nazmi and Ramirez, 1997). Public investment in infrastructure, however, represents a complementary factor of private investment which increases the productivity of capital, as well as the level of private investment (see Figure 4 and Blejer and Kahn, 1984 ; Barro, 1990; Argimon et al., 1997). Private investment contributes also indirectly to growth through various externalities (Romer, 1986).
Figure 3: Private Investment (%GDP) & Growth (%)Figure 4: Public vs Private Investment (%GDP)
Source : Authors’ calculations Source : Authors’ calculations
Although the importance of private investment has been widely developed in the literature, less is known--both theoretically and empirically--about what induces private firms to invest in developing countries. In fact, developing countries do not always operate in a competitive environment and face constraints that are not accounted for in the neoclassical model. This partly explains why most of the economists do not agree on the subject of the determinants of investment in the developing world (see Greene and Villanueva, 1991; Blejer and Khan, 1984; Loayza, 2000). This phenomenon is also the case for MENA economies, for which the empirical literature is very deficient (see
Shafik, 1992, on Egypt ; Schmidt and Muller, 1992, on Morocco ; Bisat, Erian, El-Gamal and Mongelli, 1998, on MENA).
The objective of this paper is to extend the previous work on the determinants of private investment in the developing world, and in MENA economies in particular. We have first extended the neoclassical accelerator model (Jorgenson, 1963) by taking into account some specific constraints faced by the developing countries. These constraints usually range from financial repression, to absence of well functioning financial markets, foreign exchange shortage, and other distortions associated with foreign exchange, heavy reliance on imported capital goods, economic instability, deficiencies in infrastructure, lack of skilled labor and deficit in structural reforms (see Shafik, 1988, and Agenor and Montiel, 1998).
The current paper also contributes to the literature by increasing the number of MENA countries studied (four among 39 countries), and the period of time covered (1973-80 to 1999). We employ panel data econometric techniques which allow some comparative analysis between the different regions and among the MENA countries in particular3. Finally, to avoid the problems of multicollinearity caused by the introduction of a large number of potentially collinear explanatory variables, we make use of aggregated reforms indicators processed by the mean of principal component analysis. This approach has allowed considering at the same time more factors than usually considered in the empirical literature on the subject. In particular, we have been able to show that various aspects of structural reforms (such as trade policy and financial
3 The “comparative advantage” of panel data regressions compared to time series estimation techniques can
also be seen in:
development), as well as various measures of uncertainty (like the debt burden and the volatility of the economy) can be considered as complementary factors to explain firm’s decisions to invest.
This paper is organized as follows. The second section introduces a short review of the literature of the determinants of private investment considered in the paper. It emphasizes the specific factors that will be taken into consideration in the empirical analysis and highlights the importance of these factors for our sample of MENA countries. The third section presents the estimations’ results and explains the reasons for the low investment performances of the MENA region. The last section concludes.
2. The Determinants of Private Investment
2-1. The Neoclassical Accelerator ModelIn the macroeconomics literature, the neoclassical flexible accelerator model is the most widely accepted model of investment. This model is based on the neoclassical idea of the theory of the firm (Jorgenson, 1963), which postulates that enterprises decide to invest so as to generate more profit in the future. The investment function is derived from the optimization problem of the firms, which maximize current and expected profits by equating the production prices to their marginal costs. Firms will invest so long as the marginal benefit of doing so outweighs the additional cost. The net investment is the gradual adjustment of the actual capital stock to its desired level, which is derived from maximization of profit. The determinants of investment in the neoclassical flexible
ii)- the country dummies variables which generally account for an important number of degree of freedom and add precision to the results of the estimations.
accelerator model include the expected aggregate demand (the accelerator), the user cost of capital, the wage rate and the initial capital stock.
This model postulates, however, that firms operate in competitive markets, which contradict the structural and institutional factors prevailing in the developing countries. Even though the empirical tests of the model appear to be successful for several developed countries, the firms in developing countries face certain constraints that are not accounted for in the conventional neoclassical theory (see for example Shafik, 1988, (p. 61) or Agenor and Montiel, 1998, for a discussion and additional references). It is some of these constraints that will be taken into consideration in this paper.
2-2. Structural Reforms
Structural reforms constitute an important determinant of the actual and future profitability of private investment. Here, we have considered structural reforms as the aggregation of two variables: trade policy and financial development.
The financial development provides more opportunities and incentives for the firms to invest. Developed financial systems mobilize and allocate resources for the firms to undertake investment projects. A developed financial system is also expected to be more efficient due to an increasing technological specialization, which leads to a better selection of projects and a more advanced diversification of risks. This allows the firms to finance more investment projects and increases the productivity of new investments (see Levine, 1997, for a synthesis).
Given the lack of well-functioning financial markets in the developing countries, the neoclassical assumption of flexible accelerator model about the availability of credit supply by the banking sector cannot be taken for granted in the developing countries.
This discrepancy also occurs because of the public deficits and public debt, which can lead to financial repression and to eviction of private investment.
With these concerns, McKinnon (1973) and Shaw (1973) have adopted an alternative model to explain the investment decision in the developing world. Since the entrepreneurs are constrained in the financial markets, their investment behavior is influenced by the accumulation of domestic real money balances. This hypothesis assumes that the lack of finance either prevents the investors from taking advantage of investment opportunities or delays their investment decisions until they accumulate a certain amount of capital.
On the empirical side, the impact of financial development on private investment has been documented. In his survey of investment functions in developing countries, Rama (1993) presents the positive effect of financial development on private investment in twenty-one of the thirty-one papers surveyed.
Trade reforms constitute another factor that can stimulate private investment. Trade openness increases competitiveness and provides access to enlarged markets (Balassa, 1978; Feder, 1982). Trade openness can be at the origin of economies of scale and of productivity gains. In addition, trade openness also influences the availability of external credit--considering the general consensus on the role of tradable goods in providing positive externalities in the form of collateral for external financing (Caballero and Krishnamurthy, 2001). All these factors create favorable conditions for the enterprises to invest4.
4
In developing countries, however, trade barriers can also tend to favor capital intensive activities. In this case, their reduction should be associated with a lower average level of the capital-to-labor ratio; hence result in a decline of the investment rate. The combination of positive and negative effects suggests that the overall impact may be ambiguous.
Trade openness has always been low in MENA with a ratio in average of 35 percent of GDP, compared to 60 to 90 percent in East Asia during 1970-1999 (see figure 1.1 in Appendix 2)5. The oil producing countries, in particular, have failed to diversify their economies. Morocco and Tunisia, however, have shown more success and have improved their trade openness—45 and 60 percent of GDP respectively in the 1990s (see figure 1.2 in Appendix 2). Trade policy has, however, still room to improve in a majority of MENA countries (see Nabli and Véganzonès-Varoudakis, 2004).
As far as financial development is concerned, the records of the MENA countries seems--at a first glance--to be more satisfactory with a ratio of private credit from the banking system and other institutions averaging 35 percent during the 1980s and the 1990s-- 50 to 60 percent of GDP in Tunisia (see figure 2.2 in Appendix 2). This achievement has only been better in East Asia, which financial ratio reached 60 to 80 percent during the same period (see figure 2.1 in Appendix 2). This does not mean, however, that the MENA economies have benefited from a strong banking system or a well-developed financial sector. In fact, other studies highlight the deficiencies of the financial sector and recommend improving the financial system to boost the development of the private sector and the growth prospects of the region (Nabli, 2000).
2-3. External Stability
External stability constitutes an integral part of the investment decision for the enterprises, due to providing a more predictable economic environment. In this paper, external stability is measured with the foreign debt and the current account balance.
5 This indicator is calculated as the ratio of exports plus imports to GDP, from which have been deducted
the “Natural Openness” of the economy calculated by Frankel and Romer (1999), as well as the exports of oil and mining products which introduce a bias in the sample due to the natural resources endowment. The
The foreign debt represents the risk for an economy to encounter difficulties in reimbursing its external debt and to face a financial crisis. In this regard, foreign debt can prevent investors from realizing their investment projects. In addition, the presence of a large external debt can adversely affect investment by reducing the funds available to invest, given that the return from new investments must be used to repay the existing debt (Cohen, 1994)6. As far as the current account ratio is concerned, it also indicates the fragility of the external position of the country (Fitzgerald, et al., 1994).
Actual experience shows that the external position of the MENA countries may have constituted a constraint for the enterprises’ investment decisions. The debt burden increased dramatically in the 1980s, to reach 90 to 100 percent of GDP in Morocco and
Egypt. Foreign debt remained at unsustainable levels in the 1990s -- around 60 per cent of GDP and 200 percent of exports in both countries, as well as in Tunisia (see Figures 3.2 and 4.2 in Appendix 2). These performances were usually better in the other regions, but Africa (see Figure 3.1 in Appendix 2)7. As for current account, however, the position of MENA improved in the 1990s. This has been the case in all the countries of our sample, and in particular in Iran. This explains why MENA current account achievements have, on average, only been surpassed by the East Asian economies (see Figures 5.1 and 5.2 in
Appendix 2).
“natural” openness of the economy is calculated from the size and the distance of the market of the countries concerned.
6 One part of the external debt, however, may finance new investment projects. In this case, the impact on
private investment is positive. In many developing countries, however, external debt is excessive and not always used to finance productive investments.
7 The ratio of foreign debt to export has, however, being more favorable to MENA, although East Asia still
2-4. Volatility
The volatility of an economy is another factor that can be disruptive to investment. Volatility can be measured in different ways. Some of these measures are characterized as the volatility of the GDP growth rate, as well as the volatility of prices --such as consumer prices, real interest rates and terms of trade. All these factors may lead the investors to seek profit opportunities in short-term portfolio investments rather than investing in long term productive projects--especially when the investment contains more irreversible features (Pindyck, 1991).
The impact of volatility on the investment decisions of the enterprises has been studied by various authors. Aizenmann and Marion (1993) provide evidence supporting the negative effects of different measures of volatility on private capital formation for a sample of 40 developing countries over 1970-85. The fluctuations of terms of trade (Bleaney and Greenaway, 1993) are also shown to be significant in determining private investment decisions. In their study of 24 uncertainty variables for a set of 60 countries, Brunetti and Weder (1997) argue that the irreversibility of investment magnifies the effect of uncertainty on investment decision.
The volatility of the growth rate has been strong in some MENA economies. This has been due to the changes in oil prices and revenues, in addition to the variations in agricultural production and in tourism activity. But economic policies have also been a part of this process. Until recently, these policies have been pro-cyclical with no mechanisms to offset the volatility. Moreover, the MENA economies have been characterized with rigidities. The volatility of the activity has been a concern in countries like Iran and Morocco, (see Figures 6.1 and 6.2 in Appendix 2). Volatility of prices has
been growing in Iran but has remained rather low compared to other regions/countries (Latin America and Africa for example, see Figures 7.1 and 7.2 in Appendix 2 for inflation).
2-6. Public Sector Investment: Crowding in or Crowding out?
At the theoretical level, the effect of the public sector investment on entrepreneurs’ decision to invest is ambiguous. Whether public investment raises or lowers private capital formation depends on the type of investment. On the one hand, public investment in infrastructures may be complementary to private investment. In this case, public investment stimulates private capital formation by raising the profitability of investment (Barro, 1990). Public investment may substitute private capital formation by reducing the scarce financial resources available to private sector. This case is likely to occur when heavy public spending leads to high interest rates (Binter, 1977), severe credit rationing and an increase in future tax burden (Friedman, 1976). In addition, the money financing of public deficits leads to an increase in the inflation rate, which is disruptive to investment by introducing uncertainty in the investment climate (Blanchard and Fisher, 1989).
Studies on the effects of public investment on firms’ decisions to invest have produced mixed results. Sundararajan and Thakur (1980), as well as Wai and Wang (1982) find inconclusive results. More recent works--including Cardoso (1993), Bleanay and Greenaway (1993), Ramirez (1994) and Shafik (1992)--report a positive effect of public investment on private capital formation. Blejer and Khan (1984) make a distinction between various type of public investments. They come to the conclusion for a
sample of twenty developing countries during 1971-79 that, while infrastructure stimulates private investment, other public investments reduce private capital formation.
In this study, we focus on physical infrastructures as an incentive for the enterprises to invest. Our infrastructure indicator is composed of two variables: telephone
lines and the road network. Infrastructures have always been deficient in the MENA region. Although the number of telephone lines has been higher in MENA than in South Asia and Africa, it has been constantly surpassed in East Asia and Latin America (see Figures 8.1 and 8.2 in Appendix 2). As far as the road network is concerned, MENA equipment has always been the worse of all the regions (see Figures 9.1 and 9.2 in
Appendix 2). These deficiencies may have constituted a constraint for the enterprises’ investment decisions.
3. The Empirical Analysis
3-1. Specification of the modelThe equation of investment considered in this paper extends the neoclassical accelerator model and takes into account various constraints faced by the investors in developing countries. The model is as follows:
t i t i t i t i t i t i t i t
i Acc r SR ES Vol Infra
iv, ) 0 1 , 2 , 3 , 2 4 , 1 5 , 6 , ,
ln(Pr =α +α +α +α +α +α +α +ε
−
− (1)
where ln(Privi,t ): Private investment as percentage of GDP in logarithm
Acci,t : Accelerator
ri,t : Real interest rate
SRi,t-2 : Structural reforms
ESi,,t-1 : External stability
Infrai,t : Physical infrastructure parameters : to and Intercept : 1 7 0 α α α
i:groupindex,t:timeindex,andε:error term
Acc is the variable chosen to accommodate the neoclassical theory of flexible accelerator. Anticipations of investors--as far as the economic environment is concerned--have been proxied by one lag period of the GDP growth rate (Growthi,t-1). The investors
envision the future economic environment as the growth rate observed in the past. The reason for taking one lag period of the GDP growth rate is also to avoid simultaneity problems in estimating the investment equation. This variable is expected to have a positive coefficient. Moreover, the neoclassical model of investment takes the user cost of capital into consideration. The current paper incorporates the real interest rate (r) to capture this effect. A negative sign of the coefficient is expected (α2 <0).
SR and ER stand for the indicators of structural reforms and external stability respectively. These indicators have been constructed by means of principal component analysis (see Nabli and Véganzonès-Varoudakis, 2004). Reform and stability indicators are expected to have a positive impact on private investment (α3 and α4 > 0).
Structural reforms (SR) incorporate trade openness and financial development. Specifically, this indicator embodies an indicator of trade policy (TradePGDP)8, as well as the private credit by deposit money banks and other institutions as percentage of GDP (PCrGDP), as a proxy for the development of the banking system. External stability (ES) takes into account the external debt as a percentage of GDP (DebGDP), as well as of
8
We will recall that the indicator of trade policy is calculated as the ratio of exports plus imports to GDP, from which have been deducted the “Natural Openness” of the economy calculated by Frankel and Romer (1999), as well as the exports of oil and mining products.
exports of goods and services (DebEx), and the current account balance as a percentage of GDP (CurGDP) 9 .
Economic volatility (Vol) is based on the volatility of inflation, GDP growth, and interest rates. In the benchmark estimation, it is defined as the five-year moving standard deviation of inflation (StdInf5). Increased volatility is expected to decrease private investment (α5 < 0). The physical infrastructure (Infra) indicator incorporates the logarithm of the density of the road network (lRoads,in km per km2) and the logarithm of the number of telephone lines per 1,000 people (lTel ). The expected sign of the coefficient is positive (α6 >0).
Data on private investment are issued from the Global Development Network
Database of the World Bank. Inflation and interest rates come from the International
Financial Statistics of IMF10. Data on all other disaggregate variables are from World
Development Indicators of the World Bank. Aggregate indicators of infrastructure, structural reforms and external stability are from Nabli and Véganzonès-Varoudakis (2004).
3-2. Estimation Results
The first step of our estimation analyses the degree of integration of the variables of Equation (1).This test determines the existence of a long-term relationship between
9 The outcome measure such as the rate of inflation, the external debt, the public deficit, or the trade
openness (Easterly et al, 1997) is the most popular way to evaluate economic reforms. In this case, however, the indicators used cannot be considered only as reform inputs, but also as consequences of reforms and other factors. This method nevertheless constitutes an improvement over earlier methods, which distinguished only between the presence or absence of reforms, and therefore failed to capture the gradation in reform intensity across the countries. A better approach would be to directly measure reform inputs. This method could not be used here because of the lack of data.
10 The “ideal” interest rate should be the real lending rate. Unfortunately, its availability is quite limited in
terms of both time and group dimensions. To avoid selection bias and expand our coverage, we decided to use the nominal bank discount rate deflated by inflation to construct the real interest rate series. The real interest rate is calculated as ln (1+i)/1+π)*100.
private investment and its determinants. Given that the correlation between dependent and independent variables suffer from the issue that these variables follow a common trend, the relationship estimated in this case would be biased.
To account for this potential bias, Table in Appendix 3 provides the results of the Augmented-Dickey-Fuller (ADF) tests of the data of our sample. We have used the Im, Pesaran, and Shin (2003) methodology which provides critical values of ADF tests in the case of heterogeneous panel data11. The results indicate that the series are generally stationary at the 1 percent level. The exceptions are structural reforms and the uncertainty indicators when defined as standard deviation of inflation, whichare stationary at the 10 percent level. These results allow running Equation (1) by using the standard estimation methods.12
Equation (1) then describes the long-run relationship between private investment and a number of economic variables. Equation (1) has been estimated on an unbalanced panel of 39 developing countries from 1973 to 1999. The results of the regressions-- using the White estimator to correct for the heteroscedasticity bias--are presented in
Table 1. To control for the sample heterogeneity, we have introduced country dummy variables. These variables reflect differences in the quality of institutions or endowments of natural resources, which can be at the origin of large discrepancies in the “natural propensity” to invest13. This hypothesis is supported by the data as shown by the value of the Fischer tests of equality of the intercepts across countries, as well as by the value of
11 When testing for unit roots, we assume that the disturbances in the underlying ADF regressions are
serially correlated following an AR(1) process. The proper test inspected, hence, is standardized t-bar statistic, which adjusts the average t-statistic across countries by their individual means and variances.
12
This is also the case because our sample is sufficiently “big” with T (number of time periods) and N (number of countries) being large enough (see Im, Pesaran, and Shin, 1997). In this case, tests’ distribution tends to converge.
the Hausman tests as far as the random hypothesis is concerned14. The regressions fit the data quite well, accounting for 62 to 65 percent of the variations of the investment ratio across countries and overtime.
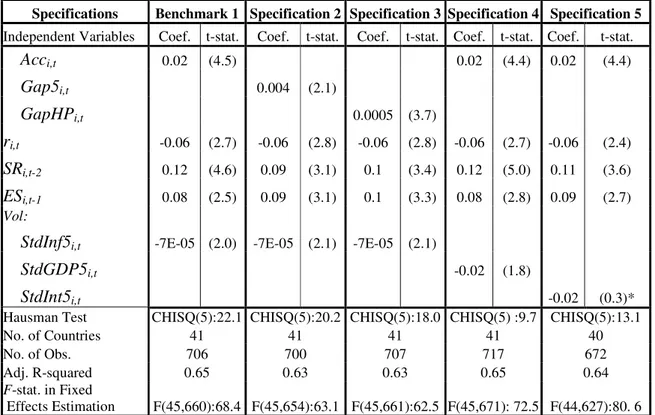
Table 1: Estimation Results of the Long-term Private Investment Equations Dependent Variable ln(PRIV)
Specifications Benchmark 1 Specification 2 Specification 3 Specification 4 Specification 5
Independent Variables Coef. t-stat. Coef. t-stat. Coef. t-stat. Coef. t-stat. Coef. t-stat. Acci,t 0.02 (4.5) 0.02 (4.4) 0.02 (4.4) Gap5i,t 0.004 (2.1) GapHPi,t 0.0005 (3.7) ri,t -0.06 (2.7) -0.06 (2.8) -0.06 (2.8) -0.06 (2.7) -0.06 (2.4) SRi,t-2 0.12 (4.6) 0.09 (3.1) 0.1 (3.4) 0.12 (5.0) 0.11 (3.6) ESi,t-1 0.08 (2.5) 0.09 (3.1) 0.1 (3.3) 0.08 (2.8) 0.09 (2.7) Vol:
StdInf5i,t -7E-05 (2.0) -7E-05 (2.1) -7E-05 (2.1)
StdGDP5i,t -0.02 (1.8)
StdInt5i,t -0.02 (0.3)*
Hausman Test CHISQ(5):22.1 CHISQ(5):20.2 CHISQ(5):18.0 CHISQ(5) :9.7 CHISQ(5):13.1
No. of Countries 41 41 41 41 40
No. of Obs. 706 700 707 717 672
Adj. R-squared 0.65 0.63 0.63 0.65 0.64
F-stat. in Fixed
Effects Estimation F(45,660):68.4 F(45,654):63.1 F(45,661):62.5 F(45,671): 72.5 F(44,627):80. 6
Sources: the data have been compiled from the World Development Indicators and the Global Development Net-
-work Database of the World Bank, and the IMF International Financial Statistics. Aggregated indicators (SR and ES) are issued of Nabli and Véganzonès-Varoudakis 2004). All coefficients are significant at 5 percent level with the following exceptions: * not significant. Numbers in parentheses are heteroskedasticity-consistent t-statistics
In the estimations, almost all explanatory variables exhibit a significant impact on private investment, with the exception of infrastructures whose results are not reported here. The first column of Table 1 is taken as a benchmark specification. The accelerator variable (Acc) has the expected positive sign, which implies that anticipations of economic growth induce more investment. Similarly, interest rate (r) appears to exert a
14
Other estimations have consisted in testing the heterogeneity of the estimated relationship across regions. In particular we have tested--without any success--the difference of slope of the economic variables and of the physical infrastructure indicators.
negative effect on a firm’s investment projects, which is consistent with the user cost of capital theory15.
More interestingly, structural reforms (SR) and external stability (ES) enhance the private investment decisions. This confirms that firms in developing countries face other constraints than in more developed ones. Higher degree of trade openness and higher financial deepening increase private capital formation. Quantitatively--holding other variables fixed--one standard deviation improvement in structural reforms stimulates private investment by 0.29 percent (.12 X .025). External stability (ES) constitutes another determinant of private investment. The impact of one standard deviation is 0.24 percent (.08 X .031) on the private investment ratio. An interesting result is that the effects of both variables (SR and ES) are not instantaneous, respectively in two-year and one-year lags. This result indicates that investment decisions require reforms to be consolidated and economic environment to be more stable before materializing into real projects.
Our estimation also reveals the negative impact of economic volatility; calculated as a five-year moving standard deviation of inflation (StdInf5), on private investment decisions. This result is consistent with the findings of Aizenmann and Marion (1999)16. This may present new empirical evidence to support the view that the impact of economic volatility on economic performance is not trivial. This finding--together with the role of
15 We will recall that the real interest rates are calculated using discount rates. The implicit assumption
behind this choice is that interest spreads are rather stable. Otherwise, interest spreads should typically exaggerate interest fluctuations. If this is the case, the negative impact of interest rates on investment, represented by the statistically significant coefficient in our model, should have been underestimated.
16 In Aizenman and Marion (1999), volatility measures are based on the standard deviations of government
structural reforms (SR) and of external stability (ES)--confirms that a stable and sound investment climate is crucial for stimulating private investment.
Our estimation failed, however, to highlight the role of infrastructure on the firms’ decision to invest. This conclusion is always the case regardless of the measures tried (composite or disaggregated indicators). This does not mean, however, that infrastuctures does not constitute a real determinant of private investment. Actually, other studies have shown the importance of this factor on private capital formation (see section 2).
3.3. Sensitivity Analysis
The next step in our analysis is to test the robustness of our results. Hence, the alternative indicators of economic growth (Acc) and volatility (Vol) are introduced in the model. As far as economic growth is concerned, we have redefined the accelerator variable as the percentage deviation of the real GDP growth rate from its trend (Gap). The variable, Gap is calculated as the difference between the actual GDP growth rate and its trend, divided by the same trend. A positive value of Gap leads private investors to think that the economy has been performing well. In this case, the good prospect of profitability stimulates private investment (α1 >0).
Keeping in mind that the GDP growth trend cannot be observed directly, this variable has been calculated following two different methodologies. In Specification 2, the trend is simply processed as the five-year moving average of the GDP growth rate (Gap5). In Specification 3, it is constructed country-by-country using the Hodrick-Prescott (HP) filter on annual data (GapHP)17. Since the Gap variables are measured as shares or rates of change, they are unit free and comparable across countries. As seen in
Table 1, both methodologies do not change the significance of the variable of economic prospect. At the same time, the coefficients of the other explanatory variables are immune to the modifications.
Similarly, alternative measures of economic volatility have been considered. In
Specification 4 and 5, we have introduced the five-year moving standard deviations of GDP growth (StdGDP5) and of real interest rate (StdInt5). In Specification 4 the volatility of GDP growth (StdGDP5) appears to be harmful to private investment. In Specification
5, the turbulence of interest rates (StdInt5) does not appear to be a significant concern for investors. Other results are unchanged (see section 3.2)
3.4 Assessing the Impact of Structural Reforms, External Stability and Economic Volatility on the Private Investment of MENA Countries
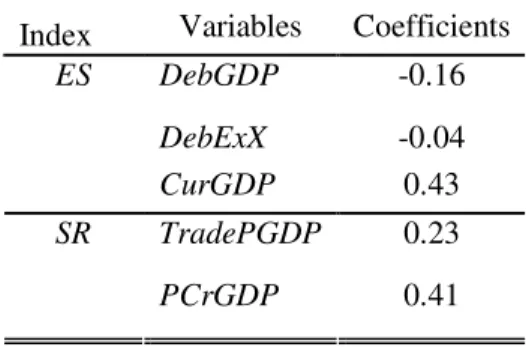
As mentioned earlier, using aggregate indicators overcomes the difficulties of estimating the impact of a large number of indicators that may have collinear relationships. This method also allows for subsequent calculations of the contribution of the initial indicators to the investment performance of the countries18. In this section, we use the benchmark equation estimated previously (see specification 1 in Table 1). Coefficients of the disaggregated variables are presented in Table 2. A number of conclusions can be drawn from these calculations.
First, structural reforms emerge as an important explanatory variable of private capital formation. The development of the financial system shows a strong impact on the
17 The HP filter decomposes time series into long-run trend and cyclical components. Through the
procedure, irregular components of the data are subsumed into the cyclical component and a relatively smooth trend is deducted.
18
The calculation is based on the estimated coefficients of the aggregate indicators in the regression, as well as on the weights of each principal component in the aggregate indicator combined with the loading of the initial variables in each principal component (see Nabli and Véganzonès-Varoudakis, 2004, for more details on the methodology).
firms’ decisions to invest (coefficient 0.41). This means that making the funds available to the private sector to invest is a priority. Trade openness also comes out to be a key variable in stimulating private investment by increasing competitiveness and providing market opportunities (coefficient 0.23)19.
Table 2: Structural Reforms and External Stability
Estimated Coefficients (Benchmark Equation)
Index Variables Coefficients
DebGDP -0.16 DebExX -0.04 ES CurGDP 0.43 TradePGDP 0.23 SR PCrGDP 0.41
Source: Authors' calculation
External stability represents another sector of reform, which is conducive to private investment. Progress in the current account balance shows an impact as high as financial development (coefficient 0.43). External debt to GDP, also, discourages private capital formation by reducing the incentive to invest, and the funds available to invest (coefficient -0.16).
All together, real progress in structural reforms and external stability in MENA would have helped private investment to catch up with other more advanced regions, East Asia in particular. In fact, as seen in Section 2, the MENA countries have been characterized with a low trade openness, a modest level of financial development, a high external debt, a slow economic growth, and a subsequent volatility of the economic activity. On the contrary, the East Asia and Pacific region has witnessed remarkable
19 Our result confirms that the overall impact of reducing trade barriers is positive (see discussion in section
progress in structural reforms and external stability, together with high rate of growth, low economic volatility, andoutstanding performances in terms of private investment.
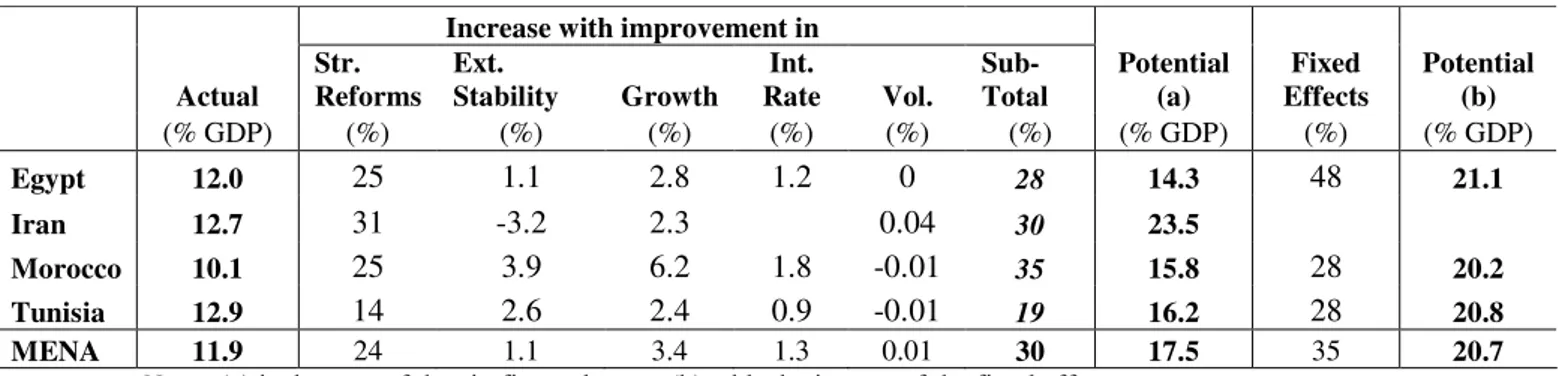
Table 3. Private Investment to GDP in the 1990s
Increase with improvement in
Actual Str. Reforms Ext. Stability Growth Int. Rate Vol. Sub-Total Potential (a) Fixed Effects Potential (b) (% GDP) (%) (%) (%) (%) (%) (%) (% GDP) (%) (% GDP) Egypt 12.0 25 1.1 2.8 1.2 0 28 14.3 48 21.1 Iran 12.7 31 -3.2 2.3 0.04 30 23.5 Morocco 10.1 25 3.9 6.2 1.8 -0.01 35 15.8 28 20.2 Tunisia 12.9 14 2.6 2.4 0.9 -0.01 19 16.2 28 20.8 MENA 11.9 24 1.1 3.4 1.3 0.01 30 17.5 35 20.7
Note: (a) is the sum of the six first columns; (b) adds the impact of the fixed effects.
Following this analysis, we have quantified how much the lack of reform, the external instability, and the economic volatility has contributed to discourage firms to invest in the region. To this end, we have taken the East Asian countries as reference and calculated the level of private investment that MENA could have reached if the region had undertaken the same level of reform and had faced the same economic conditions as East Asia. Our calculations focus on the 1990s. The results are presented in Table 3.
The structural reforms, because of their strong impact on private investment, and their clear deficit in most MENA countries, appear to be a key factor as far as firms’ decisions to invest are concerned. The benchmark equation shows that the firms would have invested 24 percent more during the 1990s, if MENA region had the same trade openness and financial development than East Asia. This increase would even have been higher in Iran (31 percent) because of a low financial depth and trade diversification, and in Egypt and Morocco (25 percent), due to a weak financial development. These results highlight the substantial contribution of the deficit in structural reforms for the low
private capital accumulation of the 1990s. This is also true for the 1980s (see Table in
Appendix 4).
As far as external stability is concerned, the debt burden of MENA economies has also contributed, however much less, to the slow private capital formation in the region. A more stable external environment, like in East Asia, would have stimulated investment decisions in average by 3.9 percent in Morocco and 2.6 per cent in Tunisia in the 1990s (8.4 percent in Morocco and 10 per cent in Egypt in the 1980s, see Table in Appendix 4).). Iran is the only country with a lower external debt ratio than East Asia (see negative sign of the contribution in Table 3)20-21.
Considering that the volatility of inflation has been relatively low in the MENA countries of our sample (see section 2), we have focused our analysis on the volatility of the economic activity which has been of more concerned. A more stable economic environment would have encouraged firms to realize their investment projects, which could have been increased by 2.3 percent on average for the region and even more in Iran (4.3 percent,).
A reason of the low private investment in MENA can also be seen in the slow economic growth compared to East Asia (see Appendix 2, Figure 10.1). This situation has constituted a negative signal for the enterprises to invest and decreased private investment by 3.4 percent during the 1990s (4.4 per cent in the 1980s, see Appendix 4).
Morocco has been more affected by the weak economic performances in the 1990s (Iran in the 1980s). Despite a relatively low impact, this result constitutes another argument in
20
This is due to the fact that, because of political circumstances, Iran could not receive long term loans in the international financial markets.
21 Our result confirms that external debt can be excessive in developing countries and not always used to
favor of reforms, which can also boost private investment through their impact on growth. Finally, interest rates in MENA have been higher than in other regions -- East Asia in particular. However, these higher interest rates seem to have played a marginal role in the low capital formation in MENA.
In summary, the private investment decisions would have increased by 30 percent and the investment ratio would have reached 17.5 percent of GDP--instead of 11.9 percent (see Table 3), if MENA had the same economic conditions as East Asia in the 1990s.
In MENA, however, investment ratio remains on average inferior as compared to East Asia. This low ratio is due to the fact that reform and stabilization efforts seem to have paid less in MENA. Fixed effects are, on average, smaller in the MENA countries than in East Asia (see Table 3)22. Hence MENA appears to be characterized by unexplained factors not always in favor of private investment. These factors have contributed on average to deter firms’ decisions to invest by 35 percent in the 1990s. This percentage has even been higher in Egypt (48 percent). If MENA countries had had the same fixed effects as East Asia, private investment in the two regions would have been rather similar, around 21 percent of GDP in the 1990s.
4. Conclusion
This paper shows that economic reforms, in addition to economic environment, greatly affect private entrepreneurs’ decision to invest. This result is robust the change in specifications, as well as in indicators. In this regard, our results are in line with the
conclusions of Greene and Villanueva (1991), Blejer and Khan (1984), and Loayza
(2000).
In MENA, the lack of economic reforms and the deficiencies of the economic environment explain well the deficit in private investment. This has been particularly the case for structural reforms, which were lacking in the 1980s and 1990s. In fact, private investment would have been increased by 24 percent in the 1990s, if the MENA region had benefited from the same level of trade policy and financial development as in East Asia. This percentage would have even been higher in Iran (31 percent), and in Egypt and Morocco (25 percent). Same conclusions can be drawn for external stability and economic volatility. An improvement of the debt burden and a more stable economic activity, similar to East Asia, would have stimulated private firms’ investment by 3.3 percent in the 1990s. These results might be generalized to other countries in the region which have faced an even higher deficit in structural reforms and/or a more instable economic environment (see Nabli and Véganzonès-Varoudakis, 2004).
Our findings confirm that the lack of economic reforms remains a problem for a majority of MENA countries which have failed to raise the rate of growth of their economy, as well as the productivity and the competitiveness of their enterprises (Dasgupta et al., 2002). This conclusion is even more critical in the context of high growth of the labor participation which asks for a substantial capital formation in order to better confront with unemployment in the MENA region (World Bank, 2004).
References
Aizenmann, Joshua and Nancy P. Marion (1993), “Macroeconomic Uncertainty and Private Investment”, Economic Letters 41 (February): 207-10.
Aizenmann, Joshua and Nancy P. Marion (1999), “Volatility and Investment: Interpreting Evidence from Developing Countries”, Economica 66: 157-79.
Agenór, Pierre-Richard, and Peter J. Montiel (1998), “Development Macroeconomics” (Draft of second edition, January).
Argimon, Isabel, Jose M. Gonzales-Paramo, and Jose M. Roldan Alegre (1997), “Evidence of Public spending Crowding-out From a Panel of OECD Countries”, Journal
of Econometrics, 68 (1): 29-51.
Balassa, Bela. (1978), “Exports and Economic Growth-Further Evidence”, Journal of
Development Economics, Vol. 5.
Balassa, Bella (1988), “Public Finance and Economic Development”, World Bank
Working Paper, n.31, Washington, D.C..
Barro, Robert J. (1990), “Government Spending in a Simple Model of Endogenous Growth”, Journal of Political Economy, 98 (5).
Binter, W.H. (1977), “Crowding-Out and the Effectiveness of Fiscal Policy”, Journal of
Public Economics, N.7.
Bisat, Amer, Mohamed A. El-Erian, Mahmoud El-Gamal and Francesco P. Mongelli. (1996), “Investment and Growth in the Middle East and North Africa,” IMF Working
Paper, WP/96/124.
Blanchard, Olivier J., and N. Fischer (1989), Lectures on Macroeconomics, MIT Press, Cambridge, Massachusetts.
Bleaney, Michael, and David Greenaway (1993), “Adjustment to External Balance and Investment Slumps in Developing Countries.” European Economic Review 37 (April): 577-85.
Blejer, Mario, and Mohsin Kahn (1984), “Government Policy and Private Investment in Developing Counties”, IMF Staff Papers 31, n.2, pp 379-403, Washington, D.C.
Brunetti, Aymo, and Beatrice Weder (1997), “Investment and Institutional Uncertainty: A Comparative Study of Different Uncertainty Measures,” International Finance
Caballero, Ricardo J. and Arvind Krishnamurthy (2001), “International and Domestic Collateral Constraints in a Model of Emerging Market Crises,” Journal of Monetary
Economics 48(3) (December): 513-548.
Cardosa, Eliana (1993), “Private Investment in Latin America.” Economic Development
and Cultural Change 41 (July): 833-48.
Cohen, Daniel, (1994), “Low Investment and Large LDC Debt in the 1980s”, American
Economic Review, 83 (June): 437-49.
Dasgupta, Dipak., Jennifer. Keller and Gopalan T. Srinivasan (2002), “Reforms and Elusive Growth in the Middle East. What Has Happened in the 1990s ?”, Middle East and North Africa, Working Paper Series, N. 25, July, the World Bank, Washington D.C.. Easterly, W. and R. Levine, (1997), “Africa's Growth Tragedy: Policies and Ethnic Divisions”, The Quarterly Journal of Economics, November.
Feder, G. (1982), “On Exports and Economic Growth”, Journal of Development
Economics, Vol. 12, No. 1/2.
Fitzgerald, E.V.K., Karel Jansen, and Rob Vos (1994), “External Constraints on Private Investment Decisions in Developing Countries”, in Trade, Aid, and Development, Jan Willen Gunning, Hen Kox, Wouter Tims and Ynto de Wit (ed.), New York: St Martin Press.
Frankel, J.A. and D. Romer (1999), “Does Trade Cause Growth”, The American
Economic Review, Vol 89, N°.3.
Friedman, Milton (1976), “The Line We Dare Not Cross: The Fragility of Freedom at 60 Percent”, Encounter.
Global Development Network Data Base, World Bank ,Washington, D.C..
Im, Kyung So, M. Hashem Pesaran, and Yongcheol Shin (2003), Testing for Unit Roots in Heterogeneous Panels, Journal of Econometrics 115: 53-74
IMF International Financial Statistics, various issues, Washington, D.C..
Jorgenson, Dale W (1963), “Capital Theory and Investment Behavior”, American
Economic Review, 53, no. 2 (May): 247-259.
Khan, Mohsin S., and Manmohans S. Kumar (1997), “Private Investment and the Growth process in Developing Countries”, Oxford Bulletin of Economics and Statistics, 59 (1): 69-88.
Khan, Mohsin S. And Carmen M. Reinhart (1990), “Private Investment and Economic Growth in Developing Countries”, World Development, Vol.18, No.1: 19-27.
Levine, Renelt. (1997), “Financial Development and Economic Growth: Views and Agenda”, Journal of Economic Literature, vol.35, pp.688-726.
Loayza, Norman, Klaus Schmidt-Hebbel, and Luis Serven (2000) "What Drives Saving Across the World?", The Review of Economics and Statistics, Vol LXXXII, n. 2, May.
McKinnon, Ronald I. (1973), Money and Capital in Economic Development, Washington, DC: Brookings Institution.
Nabli, Mustapha. (2000), “From a Growth Crisis to Prospects for a Strong Growth Recovery in the MENA Region”, mimeo, MNSED, World Bank, Washington D.C.. Nabli, Mustapha and Marie-Ange Véganzonès-Varoudakis (2004), “Reforms and Growth in the MENA Countries: New Empirical Evidences”», Middle East and North Africa
Working Paper Series No.36, the World Bank, Washington D.C..
Nazmi, Nader, and Miguel D. Ramirez (1997), “Public and Private Investment and Economic Growth in Mexico”, Contemporary Economic Policy, 15 (1): 65-75.
Pindyck, Robert (1991), “Irreversibility, Uncertainty, and Investment.” Journal of
Economic Literature 29 (September): 1110-48.
Rama, Martín (1993), “Empirical Investment Equations in Developing Countries.” In
Striving for Growth after Adjustment, edited by Luis Servén and Andrés Solimano
Ramírez, Miguel D. (1994), “Public and Private Investment in Mexico, 1950-90: An Empirical Analysis.” Southern Economic Journal 61 (July): 1-17.
Romer, Paul. M. (1986), “Increasing Return and Long Term Growth”, Journal of Political Economy, 94 (5).
Shaw, Edward S. (1973), Financial Deepening in Economic Development, New York: Oxford University Press.
Schmidt-Hebbel, Klaus and Tobias Muller (1992), “Private Investment under Macroeconomic Adjustment in Morocco.” In Reviving Private Investment in Developing
Countries, edited by Alay Chhibber, Mansoor Dailami, and Nemat Shafik. Amsterdam: North Holland.
Serven, Luis, and Andrés Solimano (1990), Private Investment and Macroeconomic
Adjustment: Theory, Country Experience and Policy Implications, World Bank, Washington, D.C..
Shafik, Nemat (1992), “Modeling Private Investment in Egypt.” Journal of Development
Economics 39 (October): 263-277
Sundararajan, Ved, and Subhash Thakur (1980), “Public Investment, Crowding Out, and Growth: A Dynamic Model Applied to India and Korea.” IMF Staff Papers 27 (December): 814-55.
Wai, U. Tun, and Chorn-huey Wong (1982), “Determinants of Private Investment in Developing Countries.” Journal of Development Studies 19 (October): 19-36.
World Bank (2004), Unlocking the Employment Potential in the Middle East and North
Africa. Toward a New Social Contract, MENA Development Report, Washington, D.C.. World Development Indicators Database, World Bank, Washington, D.C..
Appendix 1
List of countries of the sample
Country Region Benchmark and Specifications 2 to 4 (39 countries) Specification 5 (38 countries) Bangladesh SAS Y Y Bolivia LAC Y Y Brazil LAC Y Chile LAC Y Y China EAP Y Y
Cote d'Ivoire AFR Y Y
Cameroon AFR Y Y
Colombia LAC Y Y
Costa Rica LAC Y Y
Ecuador LAC Y Y
Egypt MENA Y Y
Gabon AFR Y Y
Ghana AFR Y Y
Gambia, The AFR Y Y
Guatemala LAC Y Y
Indonesia EAP Y Y
India SAS Y Y
Kenya AFR Y Y
Korea, Rep. EAP Y Y
Sri Lanka SAS Y Y
Morocco MENA Y Y Madagascar AFR Y Y Mauritius AFR Y Y Malawi AFR Y Y Malaysia EAP Y Y Niger AFR Y Y Nigeria AFR Y Y Pakistan SAS Y Y Peru LAC Y Y Philippines EAP Y Y Paraguay LAC Y Y Senegal AFR Y Y Togo AFR Y Y Thailand EAP Y Y Tunisia MENA Y Y Uruguay LAC Y Y Venezuela LAC Y Y
South Africa AFR Y Y
Appendix 2
Figure 1.1: Trade Policy across Regions* (%) Figure 1.2: Trade Policy in MENA* (%)
Source : Authors’ calculations from Nabli and Véganzonès-Varoudakis (2004)
Note: the trade policy indicator is defined as the ratio of exports plus imports to GDP, from which have been deducted the “Natural Openness” of the economy calculated by Frankel and Romer (1999), as well as the exports of oil and mining products.
Figure 2.1: Financial Development across Regions* (%) Figure 2.2: Financial Development in MENA* (%)
Source : Authors’ calculations from Nabli and Véganzonès-Varoudakis (2004)
Note: the indicator is the private credit by deposit banks and other financial institutions.
Figure 3.1: Foreign Debt to GDP across Regions (%) Figure 3.2: : Foreign Debt to GDP in MENA (%)
Figure 4.1: Foreign Debt to Exports across Regions (%) Figure 4.2: Foreign Debt to Exports in MENA (%)
Source : Authors’ calculations from Nabli and Véganzonès-Varoudakis (2004)
Figure 5.1: Current Account to GDP across Regions (%) Figure 5.2: Current Account to GDP in MENA (%)
Source : Authors’ calculations from Nabli and Véganzonès-Varoudakis (2004)
Figure 6.1: Volatility of Inflation across Regions (%) Figure 6.2: Volatility of Inflation in MENA (%)
Figure 7.1: Volatility of GDP across regions (%) Figure 7.2: Volatility of GDP in MENA (%)
Source : Authors’ calculations Source : Authors’ calculations
Figure 8.1: Telephones lines across regions (/1000 pop) Figure 8.2: Telephone lines in MENA (/1000 pop)
Source : Authors’ calculations from Nabli and Véganzonès-Varoudakis (2004)
Figure 9.1: Road Network across regions (km/km2) Figure 9.2: Road Network in MENA(km/km2)
Figure 10.1: GDP Growth Rate across Regions (%) Figure 10.2: GDP Growth Rate in MENA (%)
Appendix 3
Augmented Dickey Fuller Test (ADF)
Augmented Dickey-Fuller (ADF) Unit Root Tests
Variables
t-bar
stat. critical value ADF test ln(Priv) -2.52 -1.74* I(0) Acc -4.97 -1.73* I(0) Gap5 -5.20 -1.73* I(0) GapHP -5.90 -1.73* I(0) r -2.56 -1.82* I(0) SR -1.77 -1.69*** I(0) ES -1.84 -1.82* I(0) StdInf5 -1.67 -1.64*** I(0) StdGDP5 -1.78 -1.73* I(0) StdInt5 -1.82 -1.74** I(0) Residuals of Estimation: Benchmark -2.52 -1.97* I(0) Specification 2 -2.28 -1.97* I(0) Specification 3 -2.26 -1.97* I(0) Specification 4 -2.55 -1.97* I(0) Specification 5 -2.51 -1.97* I(0) Note: Data are compiled from World Development Indicators, Global Development
Network, and IMF International Financial Statistics. All unit root tests are augmented by 1 period lag. Critical values are from Im, Pessaran, and Shin (2003), with *, **, and *** indicating 1 percent, 5 percent, and 10 percent significance levels, respectively.
Appendix 4
Private Investment to GDP in the 1980s
Increase with improvement in
1980s Actual Str. Reforms Ext. Stab. Growth Int. Rate Vol. Sub-Total Potential (a) Fixed Effects Potential (b) (% GDP) (%) (%) (%) (%) (%) (%) (% GDP) (%) (% GDP) Egypt 11.0 16 10 -0.2 -3.9 -0.005 22 13.1 48 18.1 Iran 9.6 21 -5.8 11.5 - 0.015 27 19.2 19.2 Morocco 12.1 18 8.4 3.1 -1.7 -0.013 28 17.2 28 21 Tunisia 13.7 7 1.8 3.3 -2.5 -0.016 10 16.4 28 20.7 MENA 11.6 16 3.6 4.4 -2.7 0.00 21 16.5 35 19.8
Note: (a) is the sum of columns 1 to 6 (b) adds the impact of the fixed effects.