HAL Id: hal-02062734
https://hal-amu.archives-ouvertes.fr/hal-02062734
Submitted on 9 Mar 2019
HAL is a multi-disciplinary open access
archive for the deposit and dissemination of
sci-entific research documents, whether they are
pub-lished or not. The documents may come from
teaching and research institutions in France or
abroad, or from public or private research centers.
L’archive ouverte pluridisciplinaire HAL, est
destinée au dépôt et à la diffusion de documents
scientifiques de niveau recherche, publiés ou non,
émanant des établissements d’enseignement et de
recherche français ou étrangers, des laboratoires
publics ou privés.
Distributed under a Creative Commons Attribution| 4.0 International License
Carbone organique dissous dans des lagons d’atoll, par
combustion catalytique à haute température et par
spectrophotométrie
Jean Pagès, Jean-Pascal Torreton, Richard Sempere
To cite this version:
Jean Pagès, Jean-Pascal Torreton, Richard Sempere. Carbone organique dissous dans des lagons
d’atoll, par combustion catalytique à haute température et par spectrophotométrie. Comptes Rendus
Géoscience, Elsevier Masson, 1997, 324 (11), pp.915-922. �10.1016/S1251-8050(97)82505-0�.
�hal-02062734�
HAL Id: hal-02062734
https://hal-amu.archives-ouvertes.fr/hal-02062734
Submitted on 9 Mar 2019
HAL is a multi-disciplinary open access
archive for the deposit and dissemination of
sci-entific research documents, whether they are
pub-lished or not. The documents may come from
teaching and research institutions in France or
abroad, or from public or private research centers.
L’archive ouverte pluridisciplinaire HAL, est
destinée au dépôt et à la diffusion de documents
scientifiques de niveau recherche, publiés ou non,
émanant des établissements d’enseignement et de
recherche français ou étrangers, des laboratoires
publics ou privés.
Dissolved organic carbon in coral-reef lagoons, by high
temperature catalytic oxidation and UV spectrometry
Jean Pages, Jean-Pascal Torreton, Richard Sempere
To cite this version:
Jean Pages, Jean-Pascal Torreton, Richard Sempere. Dissolved organic carbon in coral-reef lagoons,
by high temperature catalytic oxidation and UV spectrometry. Comptes Rendus Géoscience, Elsevier
Masson, 1997. <hal-02062734>
GEOCHEMISTRY/ G~OCHIMIE (GEOCHRONOLOGY/ G~OCHRONOLOGIF)
Dissolvedorganic
carbon
in coral-reeflagoons,
by high temperature
catalytic
oxidation
and Wspectrometry
Jean Pages, Jean-Pascal TorrCton and Richard SempG
C.R. Acad. Sci. Paris, t. 324, skrie II a, p. 915 i 922, 1997
1. P. and J.-P. T.: Centre ORSTOM de Tahitr, BP 529, Papeete, Tahiti, Polynesie francake.
E-mall: pages@tahrti.rio.net R. 5.: Centre oceanologique de Marseille, case 901, F-13288 Marseille cedex 9, France.
Abstract Twosurveyswere carried out on ten atolls in theTuamotu archipelago (French Polynesia, Pacific Ocean). In vitro UV (250-400 nm) spectra of water samples gave absorption at 254 nm, Azs4. and spectrum slope, S* (computed from In Aj, versus J. ).These two descriptors are negatively correlated, and data points are arrayed along a hyperbola spanned between an oceanic pole (high S*, low A,,,) and a confined pole (low 5*, high A&.
Dissolved organic carbon (DOC) concentrations, [Cl, as assessed by HTCO, exhibit a narrow range (0.7-1.0 mg C.L-’ for most lagoons) contrasting with the wide diversity of optical characteristics. [Cl and Azs4 are positively correlated, with a significant intercept (0.5 mg CL-‘) representing non-chromophoric DOC. Carbon-specific absorption, c2s4, increases (from 0.4 to 1.3 m2.g-‘) with increasing [Cl, mainly according to the literature) owing to increased average molecular weight (MW) of the chromophoric DOC fraction, which also lowers S*.
Our optical data thus illustrate a gradient of confinement (or residence time) that corresponds to a continuum in DOC nature, especially in MWand hence in bioavailability. Optical methodsareconfirmed as quick and effective means of assessing DOM distribution.
Keywords: Coral reef lagoons, Dissolved organic carbon, Specific UV absorption, Tuamotu, France.
R&urn6 Carbone organique dissous dans des lagons d’atoll, par combustion
catalytique a haute tempbrature et par spectrophotomktrie
Deux campagnes ont prospecte dix lagons d’atoll des Tuamotu (Polynesie francaise, ocean Pacifique). Sur des echantillons d’eau, le spectre UV (250-400 nm) in vitro est decrit par I’absorption a 254 nm, A2s4, et la pente, S* (regression de In A, vs i.). Ces deux descripteurs sont negativement correles. Les points s’organisent le long d’une hyperbole entre un pole oceanique (fort S*, faible A& et un pole confine (faible S*, fort A&.
Le carbone organique dissous (COD) presente des concentrations ([Cl, determinees par HTCO) peu variables (0.7-1.0 mg CL-‘), contrastant avec la large diversite des proprietes optiques. [C] et Azs4 ont une correlation positive, avec une ordonnee a I’origine significative (0,5 mg CL-‘) correspondant a une fraction (c non chromophorique )) du COD. L’absorption specifique ramenee au carbone, ezs4, croit (de 0,4 a 1,3 m’.g-‘) pour des [Cl croissantes, surtout (d’apres la litterature) en relation avec une augmen- tation du poids moleculaire moyen, qui abaisse les valeurs de S*.
Nos mesures optiques decrivent ainsi un gradient de confinement (ou de temps de sejour) qui correspond a un continuum dans la nature du COD, dont son poids moleculaire et done sa susceptibilite a une action biologique. Cette methode rapide confirme son efficacite pour la description de la distribution de la MOD.
Note prt%entPe par Georges Pedro.
remise le 13 novembre 1996, accept&e apres r&ision Mots cl& : Lagons d’atoll, Carbone organique dissous, Absorption specifique UV, Tuamotu, France. le 24 fevrier 1997.
J. PagPs et al. DOC in coral-reef lagoons, from UV HTCO
Version
franqaise
M
AI.(;KE l’importance quantitative de la matiere organiquc dissoute (MOD) marine dana lc cycle global du car- abrkgtie bone, seule uric faible fraction de cette MOD
pcut Ctrc idcntitike chimiquement. Or. la na-
tul-e de la MOD conditionnc, entre autres, son utilisation par les bactcrics hktirotrophcs. Si I’identification fine cst csclue, la reconnais- sance de grdndcs catkgorics (par cxemple sur la base du poids molkculaire) semble possible par des mkthodes non chimiques. Kous avons employk la spectrophotomktrie dans l’ultrd- violet (cntre 250 et 400 nm), qui pcrmet un classement semi-quantitadf dc types de MOD. Paralltilement. un dosage classique du car- bone organique dissous ((:OD ; Shimadzu TO(:-.X00) fournit une comparaison avec lcs donrkcs optiques, en mPme temps que des valcurs absolues. Lcs observations, rkalisies danr le cadre du programme TypAtoll, ont kti efl’ectukes sur dix atolls des Tuamotu, au cows de dcux campagnes.
Les spectres d’absorption sont dkrits par lcur pente. Sx, et I’absorption i 254 nm, A,,,. (ks deux descripteurs prkntcnt une corrklation nkgdtivc (fig. 1 ; I-? = 0,60, n = 327 points). Chaque lagon fournit un nudge de points bien group& nettement SC- park dc celui dca autres lagons. A’ous dktermi- nom que la distribution des trchantillons le long de la courbe de rGgression correspond $ un grddient de confinement entre deux cxtrE- mes : d’une part, dcs eaux Cc okaniques ‘a. oli- gotrophes, i fort S* et fdible A,;,, d’auue part des eaux C( confinkes )), ou mksotrophes, i fort A,.,, et faible S*.
Lcs concentrations cn COD, [Cl, sent as- se% homogknes (0.7 i 1.0 mg CL-‘) dans la
1. INTRODUCTION
It is well accepted that dissolved organic
matter (DOM) represents the main organic compartment in the global aquatic carbon stock. Despite this imporrance, several au- thors have explicitly underlined that only a small part (5-30s) of marine DOM can be chemically characterized (Collins and Will-
iams, 1977; Chen and Bada, 1992; Benner et
plupart des lagons. Kckareka et Taiaro, lagons confinis, font exception ([CJ de 1,l et 1,X mg CL-‘respectivcment). Lc (:OD est bien cor- rdlk avec A,;, (r2 = 0,s). malgrk les khan- tillons oceaniques, i liger cxcils de COD par rapport $ leur .A,;, (fig. 2). Cette rkgrcssion prksente une ordonnke $ l’origine d’environ 0,5 mg CL- qui correspond i une fraction optiquemcnt inactive. L’absorption sptkili- que (ramen& au COD), E,; ,, varie entrc 0,4 et 1,4 m’.gC’. Elle prksente une corr@lation n& gkve avec S* (lie,,, vs l/S* ; 12 = 0.62).
Nous vtrifions que la concentration en COD prirdite i partir de A,,,, [C:,,], diflke peu (-+ 0,1 mg CL-’ en moycnnc) de la concentra- tion dcterminke par HTCO. [C,,,] (fig. 3).
L’no part de la variation de +, (augmcn- tation pour des [Cl. et des A,,,,, croissants) peut etre due au seul artefact (< mathkmati- que ,) de la prksence du (:OD opliqucment inactif; mais la proportion de COD (( chromo- phoriquc 3) pew aussi varier. Enfin, selon la littkrature. l’C~~lution de zy5,, et de S*, rcflhc
aussi la variation du poids molkulairc moyn de cctte frdCth1 optiquement active. Les GI- rackistiques optiques du COD varient beau- coup plus que la valeur globdle fournie par Ic
dosage HTCO i (C classique )a: en relation avec la nature de la MOD, et. done en fonction de son histoire. Sa susceptibilitk i une attaquc biologique cn depend.
Lcs mbthodes optiques sont rapides, et nous confirmons leur eticacitt pour l’dtudc qualitative ct semi-quantitaCve de la distribu- tion dc la MOD na~urellc.
al., 1992; Lee and Henrichs, 1993; Amon and Benner, 1996). This has a direct consequence on the perspectives of assessing DOM’s bio- availability, which is at least as important as knowing total DOC concentration (see ex- ample in Benner et al., 1995). Describing “bulk characteristics” of marine DOM will thus remain a plausible aim, while it would be
DOC in coral-reef lagoons, from UV HTCO J. Pages et al,
useful to recognize some broad categories (Hobbie, 1992), for instance through non- chemical methods (Cable it al., 1990).
Among these, optical characteristics have been widely used, perhaps more often in con- tinental waters (partial review in Moore,
1987) than in open-sea waters. We applied spectrophotometrr to characterize the waters of several coral-reef lagoons, with the initial aim of a typological, semi-quantitative classifi- cation (Pages et al., 1997). We could thus describe the distribution ofqualitative charac- ters of DOM (or at least of its “chromophoric” part) among different lagoons. Here, wc com- pare these results with those of the classical HTCO (high temperature catalytic osida- tion) assessment of DOC concentration, to determine whether i) there is a relationship between optical properties and DOC concen- tration, and ii) we can predict DOC from optics.
II. MATERIAL
AND METHODS
Our observations were part of several pro- grams studying the general biological produc-
tion ofatoll lagoons, and more specifically the processes in the water column. The main se-
ries of samples was taken during surveys (the “Typatoll” cruises) carried out in h’ovember 199.5 (“Typatoll 3”) and March 1996 (“Typa- toll 4”)) during which we studied a total of ten atolls in the Tuamotu archipelago (1.518%.
141-146”u’). op en-sea samples were also col- lected. Some characteristics of the lagoons studied here are given in table I.
Sampling was performed within a few hours on each atoll, at 5-S stations (see de- tails in Pages ~1 al., 1997).
Spectrophotometry was performed on board during the surveys. We used a Milton Roy “Spectronic 1201” fitted with a 100 mm quartz cell. We measured absorption (Ah) at
12 discrete wavelengths between 2.50 and 400 nm against blanks of distilled de-ionized water. Reproducibility of absorption values is good. Mean coefficient of variation on 71 du- plicates (either successive sub-samples or du- plicate samples) is 0.019 (i.e. less than 2%).
For DOC assessment, samples (11-mL) were not filtered (De Baar PI al. 1993), but preserved with HgCl, (200 PL of a 0.3 g.l,-’
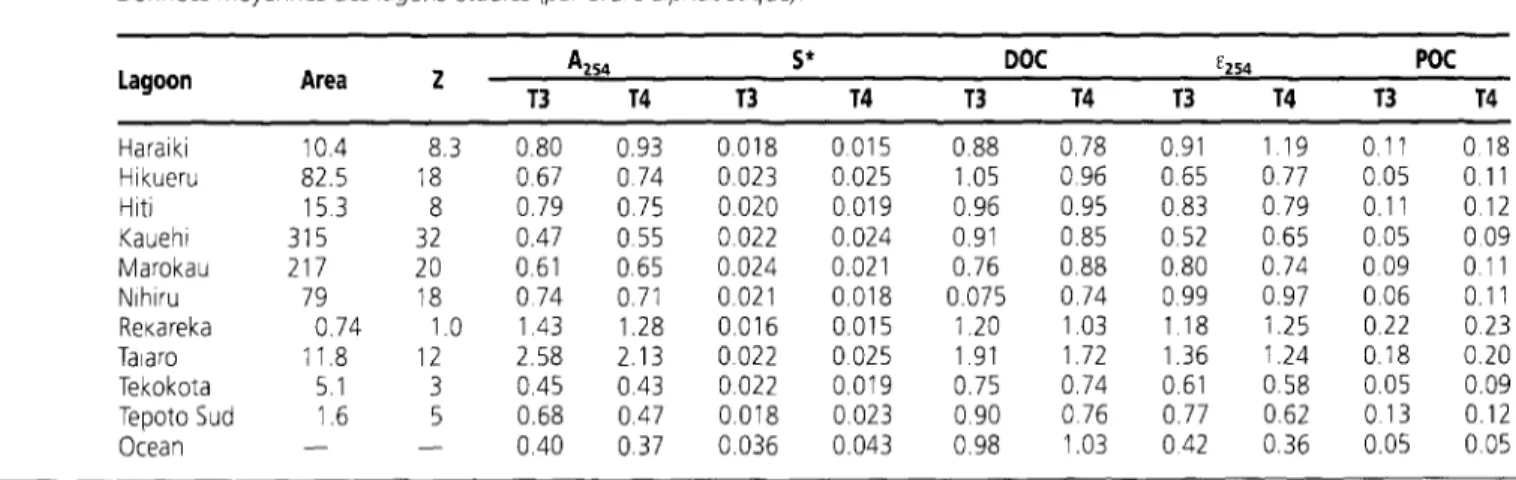
Table I Some averaged characteristics of the lagoons studied (lagoons in alphabetical order).
Donnees moyennes des lagons &dies (par ordre alphab@tique).
Lagoon Area 2 A 254 s* DOC E254 POC
T3 T4 73 T4 T3 T4 T3 T4 T3 T4 Haraiki 10.4 8.3 0.80 0.93 0 018 0015 0.88 0.78 0.91 1 19 0.11 0 18 Hikueru 82.5 18 0.67 0 74 0.023 0.025 1.05 0 96 0.65 0.77 0.05 0.11 Hlti 153 8 0.79 0.75 0.020 0.019 0.96 0.95 0.83 0.79 0.11 012 Kauehl 315 32 0.47 055 0.022 0.024 0.91 0.85 0.52 0.65 0.05 0 09 Marokau 217 20 0.61 0.65 0.024 0.021 0.76 0.88 0.80 0.74 0.09 0 11 Nlhlru 79 18 0 74 0.71 0.021 0.018 0.075 0.74 0.99 0.97 0.06 0.11 ReKareka 0.74 1.0 1.43 1.28 0.016 0.015 1.20 103 1 18 1.25 0.22 023 Talaro 11.8 12 2.58 2.13 0022 0025 1 91 1.72 1.36 1.24 0.18 0.20 Tekokota 5.1 3 0.45 0.43 0.022 0.019 0.75 0.74 0.61 0.58 0.05 0.09 Tepoto Sud 1.6 5 0.68 0.47 0.018 0.023 0.90 0 76 0.77 0.62 013 0.12 Ocean - - 0.40 0.37 0.036 0.043 0.98 1.03 042 0.36 0.05 0.05
Each figure IS based on s~xseparate stations. For each charactenstlc,twln columns give the results from Typatoll3 (T3)and Typatoll4(T4) surveys Lagoon area In km'; averaged depth (Z)In m, absorptron A,,, ;n mm'; spectrum slope S* In nm '; carbon-specific absorption E,,, In m2 (g C)-'; DOC and POCin mgC.L '.
Chaque vaieur est fondle sur six stations distinctes. Pour chaque paramPtre, deux coionnes donnent /es r&u/tats des deux campagnes, Typatoil3 (T3) et Typatoil4 (T4).
J. Pages et a/. DOC in coral-reef lagoons, from UV HTCO
Fig.1 Spectrum slope, S*, versus absorption at 254 nm, A,,, Symbols represent oceanic waters (I), Rekareka IA), Talaro (t), and other atoll lagoons IC). SolId curve represents the functloral linear regressIon of l/S* versus liA,S, (see table lli
Pente des spectres d’absorption S* par rapport j i’absorphon 3 254 nm, A,,. Symboles eaux ocPanique5 RI, eaux des lagons, Rekareka (A), Talaro i+i, autres (0). La courbe continue est ceiie de /a rPgress!on /haire fonctionnelle de l/S en foncbon de
l/A,, (vo/r tableau I!,
solution) and HCl (50 FL of a 6 N solution), and kept at 5 “C on board. Measurements were made (at least in duplicate) with stan- dard HTCO techniques on a Shimadzu TOC 5000. Mean standard error on duplicates was 0.046 mg CL-‘, i.e. 4.3%. These TOC figures were then corrected for particulate organic carbon (POC), which we determined with a Leco CHN analyzer.
III. RESULTS
1. Spectral parameters and qualitative aspects
Most of this section has been expounded elsewhere (Pages et al., 1997), but must be
briefly recalled for comprehension of the fol- lowing.
Absorption spectra show the classical linear relation between In A,and h (Bricaud ~1 al., 1981). Spectrum slope (S*) values range between 0.009 and 0,030 nm-’ in atolls, while oceanic samples exhibit higher values, up to 0.040 nm-’ (table I). ,4bsorption at 254 nm
0.04
0.03
0.01 I I I 0 I A,,, Cm’) 2
(A,,,) mostly ranges between 0.5 and 0.8 m-‘, with lower values (0.4 m-l) in oceanic sam- ples, and higher values (up to about 2 m-‘) in some confined lagoons (Rekareka and Taiaro)
A plot of A,,, against S* for all lagoon and seawater samples (fig. 1) shows an inverse cor- relation between these two descriptors. The waters from Taiaro, a closed lagoon with abundant terrestrial vegetation, are conspi-
CUOLIS outliers. Their abnormally high S* va-
lues stem from the presence of lignin degra- dation products and humic acids (ms in prep.). Excluding this lagoon, the best fit
(r? = 0.60) is given by the regression of (l/S*) against (l/A,,,,) (see table II).
Data points are not randomly distributed along this hyperbolic regression curve. Spa-
tially detailed observations in Tikehau lagoon (set details in Pages et al., 1997) show that
data points are arranged between an “ocea- nic” pole, with high S* values (- 0.04 nm-‘) and low A,,, (0.4 m-‘), and a “eutrophic” pole, with low S* (< 0.01 nrn-‘) and high 4,,, (> 2 m-‘). BY mixing different water types, we could see that the observed hyperbola corres- ponds to mixtures, in varying proportions, between two main types of water reflecting the above description of the two poles. We are thus dealing with a continuum of waters between which there is no basic difference, but only a continuous variation of propor- tions.
2. Quantitative aspects: DOC and carbon- specific absorbance
(a) DOC concentrations
For most lagoon samples, DOC concentra- tions [C] exhibit a narrow range, from 0.7 to 1.0 mg CL-’ (table I), against [C] values of - 1.0 mg C.L-‘in oceanic samples. Relatively high DOC concentrations are only found in Rekareka and Taiaro (averaging 1.11 and 1.82 mg C.L-’ ). Intra-lagoon variability is very low in most cases. Coefficient of \iariation (CV) for a given lagoon on a given survey generally amounts to - 5%, and this includes the (low) analytical variability. If we conside only “normal” lagoons and oceanic samples,
DOC in coral-reef lagoons, from UV HTCO J. Pages et a/.
Table II Functional correlations (Ricker, 1973) between variables. Corrilations fonctionnelles (Ricker, 1973) entre variables
X Y Data Slooe lnterceot r: n P
1 IA,,, l/S* all data - 16.6 75.3 0.60 327 < 0.001
A 254 Kl all data 0.553 0.508 0 76 142 < 0.001 A 254 [Cl without oceanic samples 0.580 0.465 0.83 130 < 0.001 1/s* 1/E,,, wlthout oceanic samples - 0.034 3.069 0.62 130 < 0.001
ICAl Ll lagoon averages, without oceanic samples 0.898 0.075 0.86 20 < 0.001
[C]: Dissolved organic carbon concentration, in mg C A214-versus-JC] regression (without oceanic samples).
they exhibit a 1.5-fold amplitude for [Cl, against a two-fold one for ,&I (see table I).
Absorption, A,,, (in m-l), is correlated with DOC concentration (fig. 2 and table II).
The overall regression (r2 = 0.76) is slightly improved (r) = 0.84) when oceanic samples exhibiting “too much”DOC arc excluded. W’e can note that this correlation is acceptable only after including the “high DOC” lagoons (Taiaro and Rekareka); with “normal” la- goons only, the correlation is statistically signi- ficant (r = 0.521, n = 107, P > 0.001) but the regression is worthless in terms of predicting
[C] from A,,,. The other salient point is the intercept, amounting to about 0.5 mg CL-’ of DOC without optical activity.
Inspection of the results indicates that Ayn4 allows a better discrimination between lagoons than does [Cl. To quantify the discri- minative potential of A,,, and [C] , we tested the null hypothesis of a homogeneous popu- lation comprising all stations in all lagoons and the ocean during the two surveys (22 sets of six data each), using the Kruskal-Wallis one-way analysis by ranks (two-by-two compa- rison on rank sums of adjacent sets; 21 com- parisons). Significance of the differences between lagoons was also tested using the Mann-I#‘hitney test (two-by-two comparison on all data; 213 (i.e. 21 - 20 t 19 t...) compa- risons). Results of the two tests confirm that optics are more able to discriminate between lagoons than chemical (HTCO) DOC measu-
rements.
-‘; (C J: measured DOC concentration [C,l: DOC concentration; computed from A254 and the
2%
7 00 05 10 4; (5ml) 20 25 30
Fig. 2 DOC concentration versus AZS4 Sarre symbols as In figure 1. Oceanic samples are not Included In the f#tted line
COD en fonctjon de A,, Les symboles sent /ei m@mes que ceux de /a fgure 1. Les Pchan tillons oceanlques sent excius de /a kgne drolte
(b) S@$iic absorption
We computed carbon-specific absorption as &gj-l = &+,/[C], with A in m-’ and [C] in mg CL-‘. Values of &p5q (see table I) range between 0.5 and 1.0 m’.g-’ in “normal” la- goons, but are higher for Rekareka and Taiaro lagoons (1.2-1.3 m”.g-‘), while ocea- nic samples exhibit low Ebb, values
(- 0.4 rn’.g-‘).
Comparison between Ebb,, and spectrum slope S* shows a general inverse trend (high Q~.+ values for low Y), with Taiaro samples as prominent outliers (figure not shown). Exclu- ding Taiaro, the best fit is given by a hyperbo- lic (l/E,,, versus l/S*) equation with signifi- cant correlation (r2 = 0.62, P < 0.001 for n = 130). Data points appear too widely scat- tered (figure not shown) for a satisfactory prediction of Q,, from S*.
J. Pages et al. DOC in coral-reef lagoons, from UV HTCO
(c) Prediction @DOC concentration
The various correlations seen above should allow determination of DOC conccn- tration, [Cl, from optical properties, in parti- cular from the regression between A,,., and DOC concentration. We obtain a set of com- puted values, [C,,], which we compare with actual (measured) values [Cm] (see fig. 3).
In the narrow range of “normal” lagoons (n = 96), mean values (+ s.d.) agree very well: 0.652 (+ 0.096) for [Cm], against 0.827 (i 0.083) for [C,,]. For oceanic samples, [C,,] values are underestimated (0.68 mg C.I,-’ ins- tead of l.OO), in accordance with the diver- gence between [Cm] and AZj, (section (a)). Considering now the whole range, with the two “eutrophic” lagoons (Rekareka and Taiaro), we obtain a high correlation
(r? = 0.857) between [Cm] and [C,,] (see fig. 3 and table II).
Iv. DISCUSSION
The relations we found between optical properties and DOC concentration, [Cl, have two aspects: i) quantified prediction of [C] and ii) semi-quantified evaluation of the na- ture of the DOC.
Optics, and especially absorption at a gi- ven wavelength, have been widely used as a proxy estimator (or a “surrogate parameter” (Summers et al., 1987)) of DOM concentra- tion, in the laboratory or in the field. Even if caution is necessary in some particular envi- ronmen ts, such as hard-water lakes (Stewart
20-
r 0 F .A5-
Fig. 3 DOC calculated from A;,,+ B comparea to measured values Same E symbos as in ftgLre 1 i
8 1 o-
COD caicuk 2 part? de A:,, par
rapport aux valeurs dPlermMe5
exp&~menta/ement Symboles 05 0.5 IO 20
voir la frgure I Lmm?as”red;~c1-~~
920
(andM’etze1, 1981), optical measurementspro- vide an interesting method for DOC assess- ment. once duly calibrated. In our case, agree- ment between measured [Cm] and computed [C,,] is reasonable (r2 - 0.86) across the whole range studied here (including Rekareka and Taiaro)
Excluding Rekareka and Taiaro, the “nor- mal” lagoons show a small relative variation in total DOC concentration (range 0.74-1.05 mg C.L-‘). This contrasts with the much wider variation in absorption (A,,, ran- ging between 0.43 and 0.93 rn-‘). We have
seen that A,,, discriminates better between lagoons than does bulk DOC concentration. The sensitivity of optical characteristics (both E,,, and S*) to minute variations in DOM nature and/or concentration has been shotvn in a previous paper (Pages rt al., 1997).
The DOC concentrations we found are quite normal for oligo- to mesotrophic waters (Martin and Fitwater, 1992; Guo it ul., 1993; Carlson and Ducklow, 199.5). In these “nor- mal” lagoons, then, the purely quantitatij-e aspect of optical measurements is useful only as a preliminary estimation of bulk DOC concentration, especially when considering the cost/benefit ratio (see the analogous conclusion reached by Moore, 1987).
The semi-quantitative evaluation of DOC nature has higher potentials. Our argumenta- tion is based on (i) the A,,,-versus-S* distribu- tion, and (ii) the correlation between [C] and A,,,. This latter shows the existence of a “re- sidual” colourless DOC fraction amounting to
about 0.5 mg CL-‘. Such an optically inactive
fraction (appearing as the intercept in the [C] -versus-ALj,i4 -. regression) has been found in other environments, at concentrations ran- ging between 0.4 and 0.9 mg CL-’ in oceanic samples (Amador et al., 1990; Vodacek et al., 1995) and between 2 and 6 mg C.L-’ in coas- tal or continental waters (De Haan and De Boer, 1987).
The relative increase in the ratio between active and inactive Cat increasing [C] leads to the mathematical artifact of increasing E,,~.(, even if the “true” specific absorption (E*) were constant, which is not necessarily true
DOC in coral-reef lagoons. from UV HTCO J. Pages et a/.
Our E,,, varies between 0.6 and 1.4 m’.g-’ in the lagoons studied. We found only one comparable value (0.29 m’.g-‘), obtained on
marine fulvics (Carder et ul., 1989). Most other published values range between 3 and 11 m”.g-‘, but were obtained with isolated fractions (humics or fulvics) of various aqua- tic origins (Summers it al., 198’7; De Haan ~1 al., 1988; Blough it al., 1993).
Among the identified factors of variation of E (at any wavelength) are ionic strength (Summers el al., 1987; De Haan el al., 1987) and pH (De Haan ~1 al., 1983), which are irrelevant for our measurement.5 on natural seawater. We deal here with marine DOM, which is an undetermined mixture of molecu-
les (Amon and Benner, 1996). The chief fac- tor controlling E in natural samples will be average molecular weight, MW, or “molecular size”. Several studies show, more or less expli-
citly a positive correlation between E and log MW. and a negative correlation between spec- trum slope S* (or the equivalent ratio E2/E3 (De Haan P/ al., 1988) and MW (Stewart and Wetzel, 1980; De Haan et al., 1983; Summers et
al., 1987; Senesi d al., 1989).
The “confined” pole, with high .&, (and high [Cl) corresponds to gradually increased average MN’ (as evidenced by the low S* va- lues), as found in other environments (Tran- vik, 1990; Guo et al., 1994). The increase in &2jI in this chromophoric portion may be also due to a parallel (and slight) increase in the proportion of high-e* molecules (Blough rf
al., 1993), such as lignin derivatives, or LW-
protecting compounds (Shick el al., 1992).
The continuity that we observe between la- goons suggests a continuum of MM:, such as is described by several authors (Moran et al.,
1991; Guo pt al., 1993; Amon and Benner, 1996). This array of IVIES can result in part from bacterial heterotrophic activity, which leads to decreased S* (Blough et nl., 1993).
Bacterial uptake induces very small variations in bulk propertics (Brophy and Carlson, 1989), but may alter the more sensitive optical properties of DOM.
v. CONCLUSIONS
Optical characteristics allow the predic- tion of DOC concentration with an accuracy of about + 0.1 mg CL’ (average absolute dif- ference between [Cm] and [C,]). The main potential of optics lies though in the ability to detect minute variations, or alterations. in the nature of DOC. or at least of its “chromopho- ric” portion.
We have noted that our data points (OUI lagoon samples) are arrayed. in the A,,.,- versus-S* plane, between two poles. A distance along the regression curve (measured on the graph from th e d ata points for open-sea sam- ples) would then also correspond to a factual distance (in space and/or in time) between the open sea and a water body. Optical cha- racteristics would then estimate confinement.
We could verify their good correlation with chlorophyll concentration Pages ~1 al., 1997),
which has been shown to be related to water residence time (Furnas PI al., 1990; Delesalle and Sournia, 1992).
Acknowledgements: The “TypAtoll” program was funded by ORSTOM, PNRCO and French Polynesia’s Delegation ti la Recherche. We thank the crews of French Navy patrol-boat “La Railleuse” and RN “Alis” for their cooperation. Measure- ments of POC were done by S. Bonnet and by N. Garcia. Discussions with J.T. Hollibaugh helped to clarify our concepts. Comments by an unknown reviewer led to definite improvement of a first draft.
1. Pages et al. DOC in coral-reef lagoons. from UV HTCO