O
pen
A
rchive
T
OULOUSE
A
rchive
O
uverte (
OATAO
)
OATAO is an open access repository that collects the work of Toulouse researchers and
makes it freely available over the web where possible.
This is an author-deposited version published in :
http://oatao.univ-toulouse.fr/
Eprints ID : 22871
To link to this article : DOI:
10.1
016
/ j.compfluid201809011
URL
http://dx.doi.org/
10.1016/j.compfluid.2018.09.011
To cite this version :
Rawat, Subhandu and Ramansky, Rémi, and
Chouippe, Agathe and Legendre, Dominique and Climent, Eric : Drag
modulation in turbulent boundary layers subject to different bubble
injection strategies (2019), Computers and Fluids, vol. 178,, pp.73 - 87
Any correspondance concerning this service should be sent to the repository
administrator:
[email protected]
Drag
modulation
in
turbulent
boundary
layers
subject
to
different
bubble
injection
strategies
Subhandu
Rawat
a,
Agathe
Chouippe
a,b,
Rémi
Zamansky
a,
Dominique
Legendre
a,∗,
Eric
Climent
aa Institut de Mécanique des Fluides de Toulouse, IMFT, Université de Toulouse, CNRS, Toulouse, FRANCE b Institute for Hydromechanics, Karlsruhe Institute of Technology, Karlsruhe, 76131, Germany
Keywords:
Turbulent boundary layer Bubbles
Drag reduction
a
b
s
t
r
a
c
t
The aim of this study is to investigate numerically the interaction between a dispersed phase composed of micro-bubbles and a turbulent boundary layer flow. We use the Euler–Lagrange approach based on Direct Numerical Simulation of the continuous phase flow equations and a Lagrangian tracking for the dispersed phase. The Synthetic Eddy Method (SEM) is used to generate the inlet boundary condition for the simulation of the turbulent boundary layer. Each bubble trajectory is calculated by integrating the force balance equation accounting for buoyancy, drag, added-mass, pressure gradient, and the lift forces. The numerical method accounts for the feedback effect of the dispersed bubbles on the carrying flow. Our approach is based on local volume average of the two-phase Navier–Stokes equations. Local and temporal variations of the bubble concentration and momentum source terms are accounted for in mass and momentum balance equations. To study the mechanisms implied in the modulation of the turbulent wall structures by the dispersed phase, we first consider simulations of the minimal flow unit laden with bubbles. We observe that the bubble effect in both mass and momentum equations plays a leading role in the modification of the flow structures in the near wall layer, which in return generates a significant increase of bubble volume fraction near the wall. Based on these findings, we discussed the influence of bubble injection methods on the modulation of the wall shear stress of a turbulent boundary layer on a flat plate. Even for a relatively small bubble volume fraction injected in the near wall region, we observed a modulation in the flow dynamics as well as a reduction of the skin friction.
1. Introduction
Itisawell-establishedfactthatanyobjecthavingnonzero
rel-ativevelocitywithrespecttotheupstreamfluidsexperiences
vis-cousdragatlargeReynoldsnumberduetothethinboundarylayer
developingontheobject’ssurface,wherethevelocityofthefluid
gradually reducesto that of the objectsurface. The reduction of
viscousdragisoneofthemostactiveareasofresearchinfluid
me-chanicsbyvirtueofitsimportanceinnumeroustechnological
ap-plications, suchasship locomotion,aircraftflight,fuel
transporta-tion through pipelines and vehicleaerodynamics. Plethora of
ex-perimentalandnumericalstudieshavebeenconductedinorderto
manipulateshearinduceddrag.Inthepresentstudywehaveused
directnumericalsimulationstostudythedragmodificationcaused
by theinteractionofmicro-bubbleswiththenear-wall structures.
Ever since thefirst DNSwas conductedby [26],it hasbecome a
∗ Corresponding author.
E-mail address: [email protected] (D. Legendre).
fundamentaltooltoabetterunderstandingofturbulence.Withthe
rapidadvancementindatastoragecapabilityandprocessorspeed
researcherscandoDNSwithalargenumberofbubbles.Whether
theresearchesuseexperimentsorDNS,mostofthedragreduction
techniquesfocusonthemanipulation ofnear-wallcycleof
turbu-lenceregenerationusingeitheractiveorpassivemechanisms.The
near-wall structures enhance themixing andthusthe transferof
momentumtowardsthewall,hencearedirectlyresponsibleforthe
productionofdrag.
1.1. Near-wallregenerationcycle
The flowvisualizationexperimentsperformedby[27]revealed
structuresofnear-wallturbulencecalledstreaks.Streaksare
quasi-streamwiseregions wherethevelocityislessthanthelocalmean
velocity at thesame height fromthe wall. The averagespanwise
streakspacing intheviscous sublayer andthe bufferlayer scales
inwall unitsandcorresponds approximatelyto
λ
+z =100,inwall
shear flows.Numerousexperimental andnumericalinvestigations
observed that thesestructures are self-sustained through a cycle
ofbreakingupandregeneration.Theflowstructuresarerandomly
locatedinspaceandtime,makingverydifficulttoextractasimple
mechanism to explain the breakdown andregeneration ofthem.
Withtheminimal-flowstrategyof[24]thisrandomnessisreduced
and it becomes possible to identify a simple regeneration cycle.
Following thisapproach [16] investigatedthe minimumReynolds
number and domain size needed to sustain a turbulent regime.
The flow visualization andcareful analysis of the energy
associ-ated with various Fourier modesevidenced a three-step process.
First,theinteractionofthespanwisemodulationofthestreamwise
velocity component (i.e.,nearwall streaks) withthe meanshear,
leads tothelift-up effect.Thislift-upeffectisresponsible forthe
redistribution ofstreamwise momentumthrough counter-rotating
quasistreamwise vortices. This redistribution of momentum leads
to thetransientgrowthofthe highspeed andlow speed
stream-wise streaks. Second, when these streaks reach high amplitude
they become unstable to secondary perturbation via inflectional
type instability. Finally, the unstable modes of the streaks
self-interactto re-energizethestreamwisevortices. Thisphenomenon
of lift up andbreakdown is called bursting.[27] reported that a
strongfavorablepressuregradientsuppressestheburstingprocess
andflow returntolaminarstate. Thisgavestriking evidencethat
burstingplaysacrucialroleinturbulencegenerationnearthewall.
1.2. Mechanismofdragreduction
Bursting of near-wall coherent structures intermittently
pro-duce andeject turbulent fluctuations intothe core region ofthe
domain(see [17]).Inbetweenthetwoburststhereisa quiescent
statewherethestreaksgetproduced,becomeunstableand
break-down. Numerousattemptshavebeenmadetoreduce theviscous
drag under thepremise that thebursting cyclecanbe controlled
bythemodificationandalterationofnear-wallcoherentstructures.
It isobservedthat streamwiseribletsreduce thedragby
stabiliz-ing the coherent streaks (see [4]). [49] used specific patterns of
protrusionsdispersedonthewall,whichinterferewiththe
coher-entstructuressuchthatitreducestherateatwhichenergyis
dis-sipated. Theyfound that thestreakspacingincreasedby 10% and
fluctuations of wall-normal velocity component is diminished as
compared tothesmoothwall whichwas consistentwithdrag
re-ductionusingpolymeradditivesclosetothewall[55].used
trans-versetravelingwavesintheirdirectnumericalsimulationsto
sup-presswallturbulence.Theyusedfinelytunedtransverseforce
con-finedtotheviscoussublayertoinduceatravelingwavewhich
con-sequentlyeliminatesthenear-wallstreaks[12].inducedstreaksby
generatingoptimalvorticesusingequallyspacedcylindrical
rough-ness elementsjustbeforetheleading edgeoftheboundarylayer.
Itwasshownthatthestreakssuppresstheinstabilityof
Tollmien-Schlichting (TS) waves thereby delaying the transition to
turbu-lenceandreducingviscousdrag.
Injections of micro-bubbles ina turbulent flow is another
ro-bust method for drag reduction. [38] were the first to
demon-strate this phenomenon for fully submerged asymmetric body,
wherehydrogenbubblesgeneratedviaelectrolysisintheboundary
layer resulted in significant drag reduction. Sincethen numerous
approaches both experimental [13,14,18,33,42,45] and numerical
[9,11,25,36,44,52,54,54] have been carried out in order to
under-standthisphenomenonandtherelativeimportanceofother
phys-icalparameterssuchasdiameterandconcentrationofthebubble,
bubble deformation, bubble coalescence and breakdown and the
methodofbubbleinjectionintotheflow,andpromisingefficiency
in actual shipscan now be obtained [28]. [54] numerically
sim-ulated afullydevelopedturbulent channel flowatReτ=135and
injected bubblesofdifferentsizes toachievedrag reduction.They
proposed three possible mechanisms: first associated withinitial
seeding ofthebubbles, second isrelatedto thedensityvariation
which reduces the turbulence momentum transfer and third is
regulatedby thecorrelationbetweenthebubblesandturbulence.
Theyemphasizedthat unlikethe drag reductiontechniquesof
ri-blets, spanwise travelingwaves, ”V” shaped protrusions or
poly-merswherethespanwisespacingwasincreasedandstreakswere
stabilized,herethestreakspacingseemstobeaffectedvery little
andtheybecomemoredistortedduetotheunsteadybubble
forc-ing. [9]numerically simulated turbulence boundary layer seeded
with micro-bubbles,they took the concentration of bubbles into
accountwhilesolvingthecontinuityandmomentumequationsfor
the carrier fluid flow. It was reported that micro-bubbles create
positive divergence for the fluid and shifts the quasi-streamwise
vorticalstructuresawayfromthewalltherebydisplacingReynolds
stress
h
uv
i
peakinpositivewallnormaldirection whichresultsinthereductionofproductionofturbulentkineticenergy.The
span-wise gapbetween thestreaks close to thewall was found tobe
increased, this effect was similar to the drag reduction method
ofriblets, travelingwavesorpolymer but differentfromfindings
of[54].Furthermore,[18]conductedexperimentalinvestigationof
theturbulentboundarylayeroveraflatplate with”plateontop”
configuration injecting bubbles at the leading edge. They found
that bubblesget preferentially accumulatedinthe narrowspatial
region close to the wall and the bubble concentration peaks at
y+=25duetobuoyancyforce thatisactingtowardsthewallfor
thisconfiguration.It was assertedthis highbubbleconcentration
closeto thewall decreases the coherence ofthenear-wall
struc-turestherebyreducingtheirlengthscales.Thiseventuallyleadsto
thereductionofmomentumflux towardsthewallwhichresulted
inthedecreaseinwallshearstressby25%.
The case of the vertical channel flow has been investigated
experimentally [48] and numerically [41], and an increase
(re-spectively decrease) of the wall shear stress has been observed
inupflow(respectively downflow)configurations.As describedby
[41]the presenceof the dispersed phasewill induce,through the
forcingterminthemomentum equation,anequivalentadditional
pressuregradientequal to±
φ
v(
ρ
f−ρ
b)
g (whereφ
v istheglobalvoidfraction,
ρ
f andρ
b thedensityof thefluid andthebubblesandg thegravitationalacceleration) that contributesto a
signifi-cantamountofwallshearstressmodification.
1.3.Goalofthepresentstudy
Asdescribedinthesection§1.2significantamountofefforthas
beenputinordertoadvancethedragreductiontechniquesinthe
lastthreedecades.However, itishardtoignore thatthereisstill
noconsensus on themechanism behinddrag reductionobserved
duetobubbleinjection.Forinstance,somestudiessuggestthe
de-creaseinthecoherence ofthenear-wall structuresduetothe
in-teractionofbubbleswithnear-wallturbulence,whereasothers
re-portednear-wallcoherentstructures becomingmoreorganizedas
aconsequenceofstreaksstabilization.Themechanismresponsible
forthe drag reduction is dependent on the voidfraction, bubble
diameter,physical forces like buoyancyand liftforces andinitial
seedingofbubbles.Thegoalofourstudyistoinvestigate
numer-icallythedispersionofbubbles inturbulentboundarylayerflows
andtheeffectsofdifferentbubbleinjectionmethods onthedrag
modulation. Forthis purpose we first consider the minimal-flow
unitconfigurationinordertoisolatetheinfluenceofthedifferent
contributionsofthetwo-waycoupling,namelytheforcing dueto
momentum exchange betweenthe bubbles and the flow, the
in-fluence ofthe localconcentration inthe continuityequation (i.e.
divergence effect) and in the momentum equation. We propose
fourconfigurationsinwhichthosecontributionsareactivated
gener-atethe inletboundary condition forthesimulation ofthe
turbu-lentboundarylayers.Anumericalstrategybasedontwodifferent
domains is proposed to save computational time. Different
bub-ble injection methods for a fixed bulk void fraction were tested
toknowwhethertheyhavedifferentimpactontheflow
modifica-tionandtheirinfluenceonthenear-wallregenerationcycle.
Non-deformablesphericalbubbleswhicharetypicallysmallerthanthe
smallest structure of the background flow are considered in this
study.Lagrangian trackingofthedispersedphasefits thistypeof
physicalconfiguration.Ourapproach isinthiswaysimilar tothe
Lagrangian tracking employed by [53] in Taylor-Couetteflow and
canreproduceeffectivecompressibilityeffectsduetovoidfraction
variationsasdescribedintheworkof[9].
The paper is organized as follows: Section 2 is devoted to a
description of the numerical method. We introduce the
numeri-cal strategy basedon theSyntheticEddyMethod (SEM)to
simu-lateturbulentboundarylayerandwedetailthemodelaccounting
for the feedback effect of the bubbles on the carrying phase. In
Section3some directnumericalsimulationsofminimalflowunit
configuration were conducted to study the preferential
accumu-lationof bubblesandinvestigatetheir influence onthe turbulent
structures andregenerationcycle.Finally,themain resultsonthe
dragmodulationrelatedtotheinjectionofbubblesinaboundary
layerarereportedinSection4.MorespecificdetailsontheSEMis
providedinAppendixBfollowedbyavalidationofthesimulation
oftheturbulentboundarylayeraswellasasetofverificationsof
theimplementationofthe differentcontributionsofthetwo-way
couplingofthebubblephaseontheliquid.
2. Numericalmethod
ThenumericalapproachisbasedonEuler–Lagrange modeling:
the continuous phase flow is predicted through direct solution
of the Navier-Stokes equations while Lagrangian bubble
trajecto-riesarecomputedbynumericalintegrationofmomentumbalance
equation. Modeling the presence ofbubbles isbased on
volume-averaging of the momentum and continuity equations including
momentumsource termstogetherwithspatialandtemporalvoid
fractionvariations.
2.1. Equationforthecarryingsinglephaseflow
Assuming constant physical properties (viscosity and density)
for a Newtonian incompressible fluid, we consider the Navier–
Stokesequationsforthecontinuous(liquid)phase
∇
·u = 0 (1)∂
u∂
t +∇
·(
uu)
= − 1ρ
∇
p+∇
·¡ν£∇
u+(
∇
u)
T¤¢
+ g (2)Thesystemofequationsisdiscretized onastaggerednonuniform
grid witha finite volume approach.Spatial derivatives are
calcu-latedwithsecondorderaccuracyandweusesemi-implicit
Crank-NicolsonschemefortheviscoustermandthreestepsRunge–Kutta
scheme for time integration. The JADIM code has already been
widelyusedandvalidatedforlaminarandturbulentconfigurations
insingle-phaseconfigurations(seeforexampleduringthelasttwo
decades[2,15,31,35,40]).
Spatially developing flows asa turbulent boundary layerpose
some challenges:if one wants to avoid an unnecessary long
do-main, time-dependentinletboundary conditionsneed tobe
con-sidered. The flow downstream is highly dependent on the inlet
condition whichshould bevery closetotherealturbulence.
Tur-bulent inlet generation techniques for spatially developing flows
havebeenan active areaofresearch fromthelast threedecades.
Forbubbleladenturbulentboundarylayer,[10]adaptedaspectral
method to synthetically generate turbulent initial condition with
prescribed energy spectra and Reynolds stress tensor. With this
initialization theydida smallprecursor simulationandcombined
it withthemethodof[32] to generatetheinletvelocity field for
themainsimulationwithlongerdomain.Inthepresent studywe
implemented SyntheticEddy Method(SEM ) proposed by [20] to
generate theinlet boundary condition. SEM givesa time
depen-denttwodimensionalvelocityfieldattheinletplanewiththe
pre-scribedmeanandcovariancealongwithtwopointsandtwotimes
correlations. Thisapproachalongwiththenumericalimplantation
details arepresentedinAppendixA.Notethattherecycling
tech-nics([51],[50],[32]) arenotconsidered hereduetothetwo-way
couplingwiththebubblyphase.Indeed,theflowisalready
mod-ifiedandthereforecannot be recycledastheflow isnot
pseudo-periodicanymore.
2.2. Lagrangiantrackingofbubbles
Weutilizetwo-waycoupledEuler-Lagrangianframeworkwhere
the dispersed phase is composed of Nb pointwisespherical
bub-bles. Bubble trajectories are computed solving Newton’s second
law,wheretherateofchangeofmomentumofthebubbleisequal
to thetotal external forces
6
Fb actingon it. The external forcesconsist ofdrag,fluid acceleration,added-massandliftforces.The
radius, volume andvelocity of the bubble are noted asRb, Vb=
(
4/3)
π
R3b andv,respectively.The vorticityoftheliquidis
Ä
.Thebubbleforcebalancecanbewrittenas:
d x d t = v (3)
ρ
bVb d v d t =(
ρ
b−ρ
f)
Vbg−ρ
fVb 3 8 Rb CD|
v−u|
(
v−u)
+ρ
fVb D u D t +ρ
fVbCM·
D u D t − d v d t¸
−ρ
fVbCL(
v−u)
×Ä
(4)whereCDisthedragcoefficient,CM theaddedmasscoefficient,CL
istheliftcoefficientandthehistoryforceisneglected[34].
Bubble shapeisassumedtobesphericalinthisstudy.The
as-sumption hasbeena posteriori validated by calculatingfromthe
simulationsthebubbleWebernumberWe=
ρ
d|
v−u|
2 d/σ
basedontheslipvelocity
|
v−u|
.Itsmaximumvaluehasbeenfoundtobeoftheorderof10−2.Hence,thedragcoefficientC
Discalculated
throughthecorrelationof[39]
CD= 16 Reb
"
1 +µ
8 Reb +1 2µ
1 + 3 . 315 Re1/2 b¶¶
−1#
(5)wherethebubbleReynoldsnumberisdefinedas
Reb=
|
u−v|
2 Rbν
, (6)theadded-masscoefficientisCM=1/2andtheliftcoefficientCL is
givenbytherelationof[31]:
CL=
·
1 . 8802(
1 + 0 . 2 Reb/Sr)
3 1 RebSr +³
1 2 1 + 16 /Reb 1 + 29 /Reb´
2¸
1/2 (7)withSrthelocalshearratenondimensionalizedbytherelative
ve-locityandthebubblediameter.
Directbubble/bubbleinteractionsareneglectedconsideringthat
the averaged void fraction in Section 3 and 4 is
8
v=0.02 and0.001, respectively. However,the effectofconcentration peakson
bubble/bubble interaction will be discussed in Section 4.1.
Bub-ble/walloverlapispreventedbyassuminganelasticbouncingwith
theplanewall.Thecomputationoftheseforcesrequiresthe
each bubblelocation.Weusedsecond-orderaccuracylinear
inter-polationscheme.Athird-orderRunge-Kuttaschemeisusedfor
in-tegratingtheforce balanceintime withatypical timestepequal
to one fifth of the viscous relaxation time of the bubbles. Loop
nesting is used when time steps of both phasesare widely
sep-arated. When the Eulerian time step (based on numerical
stabil-itycriteria)issmallerthantheLagrangiancharacteristictimethen
solutions ofbothsetsofequationsaresynchronized.Forlarge
ra-tioofthesetimesteps
1
tEuler/1
tLagrange,Lagrangianinnerloopsareintegratedinafrozenflowfieldandtheglobalcomputingtimeis
dominatedbytheLagrangiansolverforO
(
105−106)
bubbles.Typ-ically,wehave
1
tEuler/1
tLagrangeC20.TheLagrangiansolverJADIMhasalsobeenvalidatedandused
in thepast forthe simulationof bubblesinduced convection [5],
bubblemigrationinapipeflow[30]andbubblepreferential
accu-mulationinCouette-Taylorflow[3,6].
2.3. Thetwo-waycouplingmodel
To account forthe feedback effect ofthe dispersed phase on
the carrying fluid flow, we average the Navier-Stokes equations
in acontrol volume offluidpopulated bymanybubbles. The
ba-sic principles of this operation can be found in several previous
works such as [1,7,9]. The averaging procedure is based on the
function characterizing the presence of the continuous phase
χ
clocally whichisunity ifthereis fluidatlocation xattime t and
zerootherwise.
Then thelocalvolumefractionofthecontinuousphase
ε
c(x,t)ε
c(
x, t)
= 1V ZZZ
V
χ
c(
ξ
, t)
d 3ξ
=h
χ
ci
V, (8)whereVisthevolumeofthecells.Wenotethatthecorresponding
void fractionis computed as
ε
d(
x,t)
=1−ε
c(
x,t)
. In our study,the voidfractionassociatedwiththecontrol volumeis estimated
byaddingthevolumeofeachbubblecontainedinthiscontrol
vol-ume, which is estimated through the Lagrangian tracking of the
bubbles. The volume averagingprocess leads toa newsystem of
continuityandmomentumequations:
∂ε
c∂
t + Uc·∇ε
c= −ε
c∇
·Uc (9)ε
cρ
c∂
Uc∂
t +ε
cρ
cUc·∇
Uc = −∇
[ε
cPc] +∇
[µ
cε
c£∇
Uc+(
∇
Uc)
T¤
] + Fd→c (10) Fd→c= − 1 V Nb,l,(i, j,k) X b=1·
ρ
bVb(
d vb d t −g)
¸
. (11)Theinfluenceofthebubblesonthecontinuousphaseisrelatedto
thelocalforcinginducedbyeachbubbleviathemomentumsource
termFd→c andtothelocalevolutionofthefluidvolume fraction
ε
c.Inthoseequations,wehaveneglectedmomentumtransportbysmall-scale fluctuations(scales smaller than the control volume).
The corresponding tensor
h
u′ iu′ ji
c, similar to the Reynolds stresstensor,mayhavetwomainphysicalorigins:theclassicalturbulent
fluctuation ofthecontinuousphase,andthebubbleinduced
fluc-tuationsduetofinitesizeeffectsandwakeinteractions([47]).The
formercontributionisnot consideredsince weintendtoperform
directnumericalsimulationsofthecontinuousliquidflowwhileit
isreasonabletoneglectthelatterwhenconsideringdilutebubbly
flows.Notethat,insomestudies(seeforexample[5,9,29,37]),the
fluid inertia is subtracted from(11), becauseinthese studiesthe
volume occupiedby the bubbles in the cell is not considered in
themomentumbalanceequation(10)through
ε
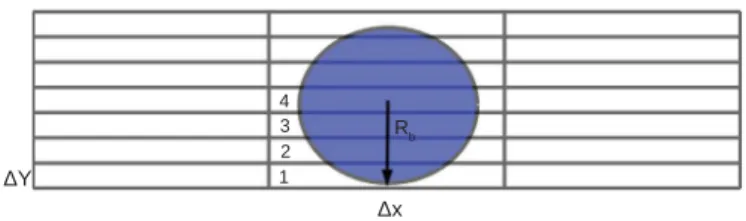
c(x,t).Fig. 1. Schematic representation of bubble close to the wall. Cell 4 contains the center of the bubble, the contribution due to this bubble to εc is accounted at cell
4 only. Cell 1, 2 and 3 also share some portion of this bubble therefore we set
εc(1) = εc(2) = εc(3) = εc(4) .
The system ofequation is discretized on a staggered
nonuni-formgridwithafinitevolumeapproach.Thepressureandthe
liq-uidvolumefractionarelocatedatthesamenodeandthevelocities
arefacecentered.In thecell(i,j,k)ofvolumeVi, j,k,the valueof
ε
c,(i,j,k)isdirectlycalculatedfromthenumberofbubblesNb,(i,j,k)presentinthecell(i,j,k)by:
ε
c,(i, j,k) = 1 −ε
d,(i, j,k) = 1 − Nb,(i, j,k) X b=1 Vb Vi, j,k (12)The point particle approach is well suited when the size of
thebubbles is smallerthan thesmallest scaleof variationof the
fluidflow.Fig.1givesaschematicrepresentationofasingle
bub-bleclosetothewall.Gridsizeinstreamwiseandspanwise
direc-tionsis muchlarger thanthebubblediameter.Eq.12 isvalidfor
Rb≪
1
,butclosetothewall1
y>Rb.Althoughbeyondthemodel’sassumptions,itisunavoidable tosimulatelarge Reynoldsnumber
flowswithintermediatebubblesizeatareasonablecomputational
cost.Theminimumpossibledistanceofthebubbleisy+=R+
b from
thewall.Thevalueof
ε
cisbasedonthepositionofthecenterofthe bubble,as a consequence,the cells closeto the wall (where
Rb>y)doesnotfeelthepresenceofthebubbles(
ε
c=0).Torem-edythisproblemandpreventthelargewall-normalgradientof
ε
cinthe vicinity ofthewall we impose a constant value for
ε
c forthecells locatedbetweeny=0 andy=Rb.We note thatthe
ap-proximationisrathercrudebutwetestedthatwithoutanyspecific
treatment forthe value of
ε
c closeto the wall and we obtainedqualitativelysimilarresults.
In Appendix B we provide various verification and validation
of the numerical development proposed for this paper. Namely,
B.1 presents validation of the single phase turbulent boundary
layersimulations against the numericalsimulations of[23].Then
inB.2andB.3,weproposesimpleoriginaltest casestocheck the
two-waycouplingmethodin orderto verifyeachcontribution of
the terms induced by the presence of bubbles in the system of
equations(9–10).
3. Minimal-flow-unitconfiguration
As seen fromthe Eqs. 9 and 10, the presence of bubbles
af-fectstheflow through differentcontributions.There isa void
ef-fectinbothmomentum andcontinuityequationsaswellasa
di-rectcontributiontothemomentumcoupling(Eq.11).Thepointof
thesectionistostudytheeffectofeachofthesecontributions(as
well astheirpossible interplays)on thenearwall flow structure.
We considerin thissection the minimal flow unit [24] in which
adynamicalprocessforthegenerationofthewallflowstructures
isextracted.Morespecifically,tostudytheinteractions ofthe
dis-persedbubblyphasewiththeself-sustainedwallstructure
mecha-nism,westudythefollowing5cases:
mfu0:One-waycoupledsimulationi.e. Fd→c=0 ineq 10and
ε
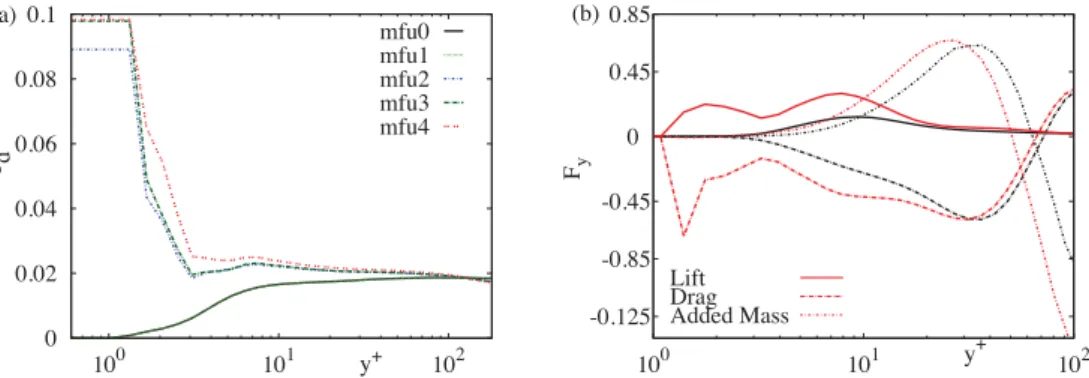
c=1ineq9andeq10Fig. 2. (a) mean bubble concentration profiles ( εd ( y )) as a function of wall normal coordinates for mfu0, 1, 2, 3, 4 . (b) mean lift, drag and added mass forces acting on the
bubbles for mfu0 (black) and mfu4 (red) normalized by the friction velocity of the mfu0 case. (For interpretation of the references to colour in this figure legend, the reader is referred to the web version of this article.)
Table 1
Computational domain and discretization parameters used in the minimal-flow- unit box at Re τ= 180 .
Name L x L y L z N x N y N z S t 8v R +b Re τ
mfu0 2.2h 2h 1h 32 82 24 0.28 0.02 1.3 180
mfu1: Only momentum feedback from the dispersed to the
fluid phase isconsidered i.e. Fd→c=6 0 ineq 10 and
ε
c=1ineq9andeq10
mfu2:Onlythevoideffectisconsideredincontinuityequation (9)via
ε
cwithFd→c=0ineq10andε
c=1ineq10mfu3:Onlythevoideffect(
ε
c6=1)isconsideredinmomentumequation(10)withFd→c=0ineq10and
ε
c=1ineq9mfu4: The void effect (
ε
c6=1) is considered both incontinu-ityandmomentumequationsandthefeedback(Fd→c)term
fromthedispersedtocontinuousisalsoaccountedfor.
Thedescriptionofthedomainsizeandparametersusedforthe
two-phase simulation is given in Table 1 and are similar to the
configurationproposedinJiménezandMoin[24].TheStokes
num-berisdefinedasSt=
τ
b/τ∗
,whereτ
bisthebubblerelaxationtimedefined as
τ
b=R2b/6ν
andτ∗
=ν
/u2τ is the time scale based onfriction velocity uτ.We useperiodic boundaryconditions forthe
velocity in all three directions, and a mean pressure gradient is
imposedinordertoobtainedtheprescribedflowrate.Pleasenote
that the caseofthe mfu4 simulationshave alsobeenperformed
withatwice finermeshinall directions,andthatnosizable
dif-ferenceswereobserved.Thereforeweconcludethatthemeshused
forthesimulations describedinthepaperis fineenough to
cap-tureallthehydrodynamicfluctuations.
In case of one-way coupled minimal-flow-unit (mfu0 ) the
streamwiseandthespanwisedimensionsofthecomputational
do-main are L+
x ∼400 and L+z ∼180 respectively in wall units. The
Reynolds number basedon uτ corresponds to Reτ∼180.Spacing
betweenthenear-wallstructuresisfoundtobearound
λ
+z ∼80−
100 therefore mfu0 could have two pairsof highandlow speed
streaks.Thissizeischosensothatbubbledynamicscouldbe
stud-iedduringtheinteractionofthesestreaks.Wesetthebubble
vol-umefractionat
8
v=0.02alongwithabubbleradiusofR+b ≈1.3,correspondingtoaStokesnumberSt≈0.28.
In Fig.2(a) we present themean bubbleconcentration profile
asa function of the wall normalcoordinate. The bubble
concen-tration is computedby averaging over time anddirections
paral-leltothewall.Weremarkthattheprofileobtainedfor mfu0 and
mfu1 are very close and decrease towards the wall whereas in the mfu 2, 3, 4 thereisasharpincreaseinthebubble
concentra-tioncloseto thewall.Sincethedifferentbubbledistributions are
only dueto a modification ofthe carrierflow, we concludethat,
atthisvolumefraction,voideffectsinboththecontinuityor
mo-mentumequationshavemuchmorepronouncedeffectontheflow
thandirectinterphasemomentumcoupling.Toanalyzefurtherthe
strong modificationofthe meanbubbleconcentration we givein
figure 2(b) the mean drag, lift and added mass forces actingon
thebubbleasafunctionofwallnormaldistanceforthe mfu0 and
mfu4 . It appears that in mfu4 ,lift anddragforces are modified
when the voideffectalters thecarrierphase flow andthere isa
negativepeakinthedragforceclosetothewall.Asaconsequence,
thereisanetforce actingonthebubblestowardsthewallwhich
resultsinhighbubbleconcentrationclosetothewall.
The second-order turbulent statistics are analyzed to further
understand the effectof bubbles on the fluid phase. In Fig. 3(a)
root-mean-squarevelocity inthe streamwiseandwallnormal
di-rectionisshownasafunctionofwalldistanceforall cases.Inall
casesexcept mfu1 turbulenceintensityishigherthansinglephase
case and the peak is slightly shifted towards the wall. Similarly,
Reynoldsstressprofileisalsomodifiedduetothepresenceofthe
bubble, higherturbulent stress intensityis observed in mfu2,3,4
ascomparedto mfu0 and mfu1 (Fig.3(b)).Thepeak ofReynolds
stress ismoved towardsthewall whichinturnincreasesthe
pro-ductionofturbulentkineticenergyproductionnearthewall.
Reynoldsstressisdeterminedbythecontributionofthe
burst-ing andsweepevents,thereforewe investigatetheeffectof
bub-bleinjectionsontheburstingandsweepcycle.Contributiontothe
Reynolds stress from the fourquadrants (Fig.4) iscomputed for
mfu0 and mfu4 (see Section 4.4 for details). Negative
contribu-tiontotheReynoldsstress(-u
v
)fromthesecondandfourthquad-rant accounts for the burst andsweep events.Close to the wall
sweepeventdominatesandburstingismoreprominentawayfrom
the wall.Thecrossovertakesplaceaty+≈15for mfu0 .In mfu4
wheredragincreasewas observed,thenegativecontributionfrom
both sweepandbursteventshaveincreasedandthepointwhere
they first cross each other is shifted towards the wall (y+≈14).
The positivecontributionto-u
v
fromthefirst andthirdquadrantisreducedin mfu4 ascomparedto mfu0 .
TheabovetestcasesindicatedthatfeedbackforceFd→c6=0has
minimal effectonthenear-wallstructureordragmodulation.The
mostimportantfactoristhevoideffectinthecontinuityand
mo-mentumtransferequations,whichplaysacrucialroleinthe
mod-ification ofthenear-wall coherentstructures andsignificantly
in-creasesthebubbleconcentration nearthewall.Dragchangeis
al-most samein both mfu2 and mfu4 asreported inTable 2. This
similarity between mfu2 and mfu4 is also clear from rms and
Reynolds stress (-u
v
) profiles inFig.3. From theabove test casesitisclearthatbubbleconcentrationclosetothewallhasa
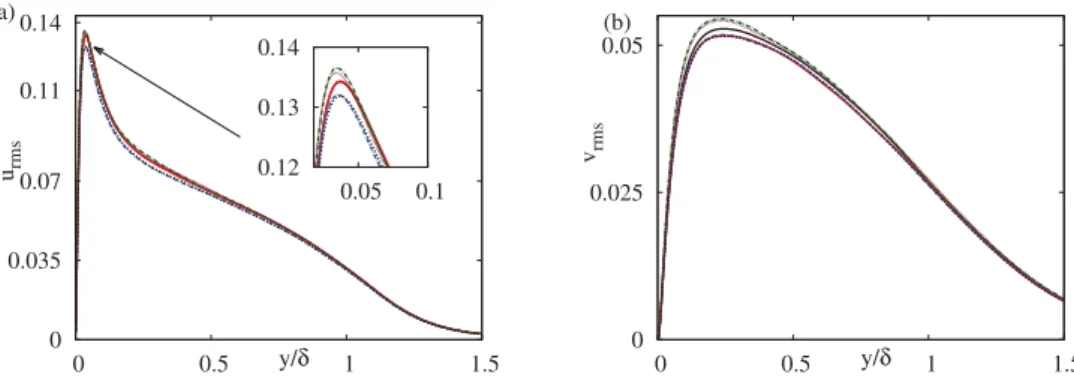
Fig. 3. (a) Comparison of u rms(y +) and vrms(y +) for the mfu0, 1, 2, 3, 4 cases. Each curve is normalized by the friction velocity of the mfu0 case. (b) Reynolds stress profiles −u v normalized by the friction velocity of the mfu0 case.
Fig. 4. Contribution to the Reynolds stress from the four quadrants. black lines: mfu0 and red lines: mfu4 . Each curve is normalized by the friction velocity of the mfu0 case. (For interpretation of the references to colour in this figure legend, the reader is referred to the web version of this article.)
Table 2
Drag modulation in different cases.
Name mfu0 mfu1 mfu2 mfu3 mfu4
Cf−Cf,0
Cf,0 0% 0% 8.5% 10.3% 8.5%
4. Modificationofaturbulentboundarylayerduetobubble injection
Wenowconsiderthecaseoftheturbulentboundarylayer.The
flow is generatedwiththe aid ofthe SyntheticEddyMethod
in-troducedinSection2anddetailedinAppendixA.Table3
summa-rizesthespecificitiesofthecomputationaldomainand
discretiza-tionusedinthecurrentsection.Formoredetailsonthevalidation
ofthesimulationofthesingle-phaseturbulentboundarylayerthe
readerisreferredtoB.1.
Table 3
Computational domains and discretization parameters used in turbu- lent boundary layer simulation.
L x L y L z N x N y N z 1+x y +min 1+z
10 δ0 2 δ0 3.56 δ0 360 66 136 18 0.14 9.0
4.1. Influenceofthebubbleinjectionstrategy
Contrary tothe minimal flow unit considered inthe previous
section,intherealwallflowsatlargeReynoldsnumber,thereare
multiplenear-wallstructuresalongwiththelarge-scalestructures.
[36]intheir DNSofturbulentboundarylayerwithmicro-bubbles
showed that bubbles migrate away from the wall as they move
alongthe streamwisedirection andthisdecreases their abilityto
modulatethenear-wallcoherentstructures.InTurbulentBoundary
Layer(TBL)simulationof[9],anytimeabubbleleavesthedomain
itisrandomlyreinjectedinsidetheturbulentboundarylayer.With
thisinjectionprocedure,thebubbleconcentrationprofilespeak
af-tery+=100andwhentheaveragevolumefractionofthebubbles
islow (
ε
d=0.001) thereare veryfew bubblesnearthewall (seeFig.5).Forthisreason,themodificationofthedragcoefficientand
thenear-walldynamicsis minimal.Therefore,higherbulk bubble
volumefractionisrequiredtogeneratesomesignificantchangesin
drag.Thealternativetoenhancethebubbleinteractionwith
near-wall coherent structures for a fixed global volume fraction is to
injectbubblesatdifferentheightsclosetothewall.
We considerfive casesof bubbleinjections assummarized in
Table4. Inthe first fourcases (denoted:2Rb, 4Rb, 6Rb and8Rb)
bubblesare injected closetothe wallatdifferenty+. Inthefifth
case(named: Random ),thebubblesare spontaneouslynucleated
atrandompositionsinthewholedomainwithavelocityequalto
thelocalfluidvelocity.Inadditionthosesimulationsarecompared
Fig. 5. Panel (a) on the left compares the mean bubble concentration profiles, panel (b) shows the streamwise evolution of the friction coefficient C f ( x ), the solid black line
Fig. 6. Comparison of the velocity RMS for Single-phase , 2Rb , 4Rb , 6Rb and 8Rb cases. (a) variance of the streamwise u rms and (b) wall-normal vrms velocity components
normalized by the free stream velocity U 0 as a function of wall-normal coordinate ( y ). Color coding is similar to Fig. 7 .
witha singlephase flow whoseparameters are givenin Table3.
Inall casestheoverall bubblevolumefractionwithin the
bound-arylayeriskeptfixedat
8
v=0.001.Notethatinthecasedenoted2Rbthebubbleradiusisonefourthoftheradiusoftheotherthree
cases,thiswasdone toinvestigatetheeffectofinjectingthe
bub-blesveryclosetothewall(the injectionpositionhastobelarger
than the bubbleradius). However, note that since the bubble
di-ameterisalreadysmallerthantheturbulentwallstructureswedo
notexpect averyimportanteffectofthebubblediameteraslong
asthegasvolume fractionisconstant.The case Random is
sim-ilar to the case-Bof [9] in which whenevera bubbleleaves the
computationaldomainitisreinjected atarandom locationinside
theboundarylayer.Inothercaseswhenthebubblesleavethe
do-main they are reinjected at random positions on the x−z plane
located atthe height of2Rb, 4Rb, 6Rb and8Rb from thewall
re-spectively. Note that forthe bubble diameter considered here, it
can be checked that for air bubbles in water and for a realistic
boundarylayerthicknesstheWebernumberisactuallyvanishingly
small,consistentlywiththeassumption ofsphericalbubbles
con-sideredinSection2.2.
Figure 5(a) presents theprofile of theaverage bubble volume
fractionofthevariouscases.Theprofilesarecomputedfrom
spa-tialaverageinspanwisedirectionandtimeaveragingandaregiven
for a streamwise location x=10
δ0
, for which Reθ≈1100. Bubbleconcentration profilepeaksatthelocationofthebubbleinjection
andthengraduallydecreasesaswemoveawayfromthewall.This
explainsthattheconcentrationprofilesdifferfromthetrendofthe
literature ([9,36]) withmuchmoreintense peaksthat canbealso
locatedinthebufferlayer.Thepeakofbubbleconcentrationinthe
nearwall region suggeststheexistence of bubble/bubble
interac-tions,whichhavebeenneglectedinthepaper.Todiscussthe
im-pactonthebubble dynamicsoftheinducedbubble/bubble
inter-actionsinthenearwallregion,weconsiderthebubble-bubble
dis-tancecomparedtothecharacteristiclengthoftheturbulent
struc-tures.Theminimumaverageinter-bubble distance,inwallunit,is
expressedas
δ
+ b =R + bµ
4π
3ε
d¶1
/3.Takingthevalueofthelocal
con-centrationpeak,
ε
d∼0.1(seefig.10)gives:δ
b+≈5,whichremainssmallerthanthewallstructuresintheverynear-wallregion.This
indicates thatthebubblesinteractmuchmorewiththeturbulent
structures thanwithotherbubbles, andthat bubble-bubble
inter-actionsarenotexpectedtobedominantinthisregion.
The evolutionofthe temporalandspanwiseaverage skin
fric-tion coefficientCf
(
x)
=2h
τ
wi
(
x)
/ρ
U2 in thestreamwise directionisshowninfigure5(b),here
τ
w=µ
dU/dy.Inthecaseof2Rb and4Rbthedragissmallerthanintheone-waycoupledcase,forcase
Random the dragseems to be unchanged, whereasthe drag
in-creasesin cases6Rb and8Rb.Thisincrease canbe interpretedas
the consequence ofthe wall-normal location of bubble injection.
Notethat thesmallvariationsbetweenthecases2Rb and4Rb
in-dicatethatthemainparameterforthealterationofthewall
struc-turesisthelocalvolumefractionofthenearwallregion.The
bub-ble diameter and the bubble number density separately are not
dominant. Thisisconsistentwiththeprevioussectionwhereitis
observed thatthebubblesmainlyinfluencethewallthroughvoid
fractioneffectandnotdirectmomentumcoupling.Thisconclusion
onlyholdsforsmallenoughbubbles,forlargebubblesthe
momen-tumforcingcausedbyeachbubbleshouldprevail.Theinduced
ef-fect of the injection position is further detailedin the following
consideringtheReynoldsstressanditsanalysisusingquadrant
de-composition.
4.2. Turbulentfluctuationsandenergy-Spectrum
The turbulent statistics (urms=
p
u′ 2) computed for the cases
discussedaboveareshowninFigs.6(a)and(b).Thevelocity
com-ponents are normalized by the free stream velocity U0. In cases
2Rb, 4Rb streamwise and wall-normal turbulent energy
fluctua-tionsareslightlylowerthanthe Single-phase case,whereasthey
are higher in 6Rb and 8Rb. These findings are consistent with
observed modification ofthe skin-friction coefficient. Similarly, a
reduction of the turbulent fluctuation was reported by [11] and
[44] in their DNS of turbulent boundary layer andchannel flow
simulations laden with micro-bubbles. However, unlike them we
donotobserveanynoticeableshiftinthermspeakalongthe
wall-normaldirection.Itispossiblethatbecausethedragreduction
ob-served hereislessthan4percent,theshiftinwall-normal
direc-tionisnegligible.
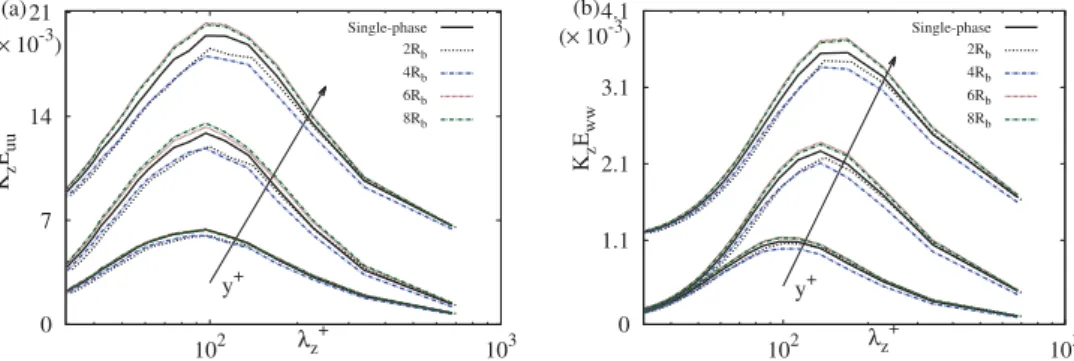
To analyze the cause of drag modification due to this
injec-tionstrategypre-multipliedspanwiseenergyspectrumisanalyzed
forcases2Rb, 4Rb,6Rb,8Rb and Single-phase case. Figures7(a)
and7(b)showpre-multipliedspanwiseenergyspectrafor
stream-wise (KzEuu) andspanwise velocity components (KzEww) atthree
different heightsfrom the wall (y+=4.0,10,15). In all the cases
thespectralenergypeaksatthewavelengthof
λ
+z ≈80−100and
thispeakshiftsgraduallytowardshigherwavelengthsaswemove
awayfromthewall.Thiswavelengthcorrespondstothe
character-isticspacingbetweenthe streakscloseto thewall.However, 2Rb
and4RbhavelowerenergycontentthantheSingle−phase
simula-tion,whereas6Rband8Rbhashigherenergycontent.Asexplained
inSection 1.1near-wallcycleconsistsofstreakswhichafter
gain-ing sufficientenergy become unstableand breakdown to
gener-atevortices.Incases6Rband8Rb higherenergystreaksaremore
pronetoinstabilitywhichresultsintheireventualbreakdowninto
vortices. Increaseininstability ofthecoherentstructures leadsto
moreviolentburstandsweepevents,whichresultsintheincrease
in turbulent shear stress production (see Fig. 9). Opposite could
coher-Fig. 7. Pre-multiplied spanwise energy spectrum comparison for Single-phase , 2Rb , 4Rb , 6Rb and 8Rb case at y + = 4 . 0 , 10 , 15 . Panel (a) on the left shows pre-multiplied
streamwise energy spectra ( K z E uu ) for streamwise velocity component and Panel (b) on the right shows pre-multiplied spanwise energy spectra ( K z E ww ) for streamwise
velocity component. To better discern the curves at y + = 10 and 15 for K
z E uu we have plotted 5 · 10 3 + K z E uu at y + = 15 . Similarly, 1 · 10 3 + K z E ww is plotted at y + = 15 for
K z E ww .
Fig. 8. Single-phase , 2Rb , 4Rb , 6Rb and 8Rb cases are compared. Panel (a) on the left compares the Reynolds stress profiles −u v as a function of y + , panel (b) on the right
compares turbulent energy production term ( P = −u v d U/d y ) as a function of y + . All curves are normalized with the free stream velocity. Color coding is similar to Fig. 7 .
entstructuresisreducedwhichmakesthemlessunstableand
de-creasesturbulentshearstressproduction(seefigure9).
4.3. Shearstressandturbulentenergyproduction
We examine the Reynolds stress (−u
v
) and turbulent energyproductionterm(P=−u
v
dU/dy)inFigs.8(a),(b)respectively.Itisapparent thatwhencompared toSingle−phasecasetheReynolds
stressisreducedfor2Rb,4Rbcasesandremainsalmostunchanged
for Randomcase, whereas for6Rb and 8Rb it increases.Reynolds
stressprofileismildlyshiftedawayfromthewallincases2Rband
4Rb compared to Single−phase case. However, forcases 6Rb and
8Rb theReynolds stress profileshifts towards the wall. Reynolds
stress profile peaks at y+≈69 inSingle−phase case, it shifts to
y+≈73for2R
band4Rbandtoy+≈64for6Rband8Rb.Theshift
in Reynoldsstress away fromthewall could be attributedtothe
shift invortex cores tohigher y location.The opposite trend
oc-curs for6Rband8Rb wheretheReynoldsstress peakismovedto
lower ylocation inferringthemovementofvorticalstructures
to-wardsthewall.TurbulentenergyproductionPtermappearstobe
decreased forcases 2Rb and 4Rb and increased for6Rb and 8Rb
whencomparedtoSingle−phasecase.
4.4. Quadrantanalysis:Burstingandsweepingevents
Intensity andfrequency ofbursting andsweep eventsare the
maincontributortotheReynoldsstress.Inordertounderstandthe
modificationofReynoldsstress,theinfluenceofmicro-bubbleson
the bursting cycleis investigated using quadrant analysis.
Quad-rant analysis computes the fractional contribution of the
turbu-lent fluctuations to the Reynolds stress at each point inthe
do-main.Theu−
v
planeisdividedintofourquadrants;Q1representsu >0,
v
>0,wherehigh-speedfluidrushesawayfromthewall,Q2containsu<0,
v
>0,wherelow-speedfluidmovesawayfromthewall, this is generally calledbursting, Q3 represents u<0,
v
<0eventswherelowspeedfluidmovestowardsthewallandQ4
con-tains u>0,
v
<0 events where high-speed fluid rushes towardsthewall, usually referred assweep events.Therefore, Q2 andQ4
contributeto thenegativepartofReynoldsstress andQ1andQ3
bringapositivecontribution.Contribution fromQuadrant2and4
isgenerallymuchhigherthanQuadrant1and3.
InFig.9weshowthefractionalcontributionofthesefour
quad-rants as a function of wall-normal coordinateat the streamwise
location of x=6
δ0
for the first fourcases in Table 4.Very closetothe wall, sweeping events(Q4) is aleading contributorto the
turbulent Reynolds stress. For the single phase case, at around
y+≈14the contributionof Q2 becomesequal toQ4 and further
awayburstingeventsdominatetheReynoldsstress.Forcases6Rb
and8Rb this intersectionpoint for Q4 andQ2 mildly shifted
to-wardsthewalltoy+≈13.6&13.4respectively.Ontheotherhand,
forcases2Rb,4Rbthisintersectionpointismovedawayfromthe
wall to y+≈14.6 & 15.11 respectively. In cases 6R
b and8Rb the
intensity of sweep and ejection is enhanced as compared to all
the other cases. Whereas in cases 2Rb, 4Rb contribution to the
Reynoldsstress dueto sweeping and bursting eventsis reduced.
ThepositivecontributiontotheReynoldsstressfromquadrantQ1
andQ3 is enhanced incases 2Rb and4Rb andreducedfor cases
6Rband 8Rb.
Thus,forcases6Rb and8Rb thebubbleinjectionincreasesthe
intensityof burstingand sweeping eventsthereby increasing the
Reynoldsshear stress.Whereas, in cases2Rb, 4Rb, thereis a
de-crease of the negative contribution from Q2 and Q4 and an
in-creaseof the positive from Q1 and Q3, which results inthe
de-crease in total Reynolds stress. As burst andsweeps are located
Fig. 9. Single-phase , 2Rb , 4Rb , 6Rb and 8Rb cases are compared. Panels (I), (II), (III) and (IV) are arranged according to the four quadrants of the u-v plane. Color coding is
similar to Fig. 7 .
Fig. 10. Contour of λ2 < 0 is shown at 10% of its absolute value in light green color up to streamwise distance of x = 8 δ. Bubbles positions are shown with black spheres. (For interpretation of the references to colour in this figure legend, the reader is referred to the web version of this article.)
adjacent to thequasi-streamise vortices (see [9]) change in their
intensitymustbecorrelatedtotheinteractionofbubbleswiththe
near-wallcoherentstructures.
4.5. Bubbledispersion:
λ
2criterionInthissection,preferentialaccumulationofbubblesinducedby
the coherent structures is examined. Bubbles and vortical
struc-tures mutually interact with each other in a turbulent flow. Lift
force,localpressuregradientandaddedmassforceencouragethe
accumulationofbubblesinlowpressureregionsoftheflow[8,37].
Such low pressure regions, which often correspond to the
vor-tex cores, are classically identified by
λ2
criteria ([22]). Itcor-responds to negative values of the second-largest eigenvalue of
S2+
Ä
2whereSandÄ
arethesymmetricandantisymmetricpartsofthevelocitygradienttensor
∇
u.Figure10showsthecontourofλ2
<0 at10% of its absolutevalue andthe bubble positions ataparticularinstant.One canobservethatbubblesare preferentially
accumulatedin
λ2
<0regions. We furthercompare theprobabil-ity(Pb
λ2)ofbubblesto samplethe regionofthefluidwith
λ2
<0against theprobabilityofthefluid (Pf
λ2) having
λ2
<0.Fig.11(a)shows the probabilities Pf
λ2 and P
b
λ2 as a function of wall
nor-mal distance for all the cases listed in Table 4. Basically, for all
the case Pf
λ2 presentsa similar profile,with a minimum around
Fig. 11. Probability of occurrence of λ2 < 0 for cases listed in Table 4 and Single- phase case. P f
λ2(y ) and P
b
λ2(y ) are shown with lines and points respectively.
Table 4
Bubble radius and distance to the wall of the injec- tion plane for the different run. For all cases the over- all bubble volume fraction within the boundary layer is 8v = 0 . 001 . Case 2Rb 4Rb 6Rb 8Rb Random R + b 0.3 1.3 1.3 1.3 1.3 y + in j 0.66 5.28 8.0 10.5
-y+=20.Morespecifically,forthe Single-phase casePf
λ2 peaksat
y+≈19.5, whereas incases 2R
b, 4Rb, 6Rb and 8Rb thepeak
re-spectivelyshiftstoy+≈21.2,21.5,16.8and16.7.Forthecases2R b
and4Rbwheredragreductionwasobserved,thepeakofthe
prob-ability distribution Pf
λ2 shifts away from the wall, while in case
6Rband8Rbitslightlyshiftstowardsthewall,andfortheRandom
case no such shiftwas observed. This indicates that the vortical
structures aredisplacedtohigherwallnormallocationswhenthe
drag isreduced andthey move towards the wall incaseof drag
increase.Overall,theprobabilityPb
λ2> P
f
λ2 demonstratesthat
bub-bles in turbulent flow get preferentially accumulated in the
At thedistanceto thewall corresponding tothe bubbleinjection
there isa sudden variationinPb
λ2 butfurtheraway,sayy
+>10,
bubbles accumulate in
λ2
<0 regions. Moreover, the probabilitydistribution Pb
λ2 becomes similar away fromthe wall for all the
casescorrespondingtobubbleinjectionatthewall(2Rb,4Rb,6Rb
and 8Rb). This is in contrast with the Random case which
devi-atesfromtheothercases.Thisisduetospontaneousnucleationof
bubblerandomlyinthewholedomain.
5. Conclusion
We develop further the numericaltoolsnecessary to simulate
aspatially developingturbulentboundarylayerladenwith
micro-bubbles. We have implemented a numerical approach which
en-ables tocomputebubbledispersionwithtwo-waycouplingbased
onEuler-Lagrangeapproach.Theformulationofthefeedbackofthe
dispersed phase on thecontinuous one is basedon local
averag-ing thatmodifiestheNavier-Stokes equations.Tostudythe
physi-cal mechanisms atplay inthe alterationofthewall flows bythe
presence ofmicro-bubbles,we considered twodistinct situations.
Firstweconsideredaminimalflowunitladenwithmicro-bubbles.
Thismodelflowenablestoisolatetheself-sustainprocessof
gen-eration of the wall structures. Our results demonstrate that the
bubbles tend to migrate closeto the wall mainly dueto the
oc-currence ofsweep events.Thismigrationcanbe attributedtothe
relative low Reynolds numbers explored for those configurations
andthe simplifieddynamicsof theminimal flowthat might
em-phasizetheinfluence ofthose sweepevents.Moreover,wenotice
thatthepresenceofthebubblestendstoreinforcetheoccurrence
of suchviolent events.Alsoit appears thatthe bubblesinfluence
the flow mainlythrough effects causedby thevoid fraction
fluc-tuations (both in momentum and continuity equations) and not
through direct momentum coupling. Since mostof the effect on
thewallshearstressappearstobeduetothebubblesintheclose
vicinityofthewall,wediscussedtheinfluenceofbubbleinjection
methodsonthemodulationofthewallshearstressofaturbulent
boundarylayer.Weobserveachangeintheflowdynamicsaswell
as a modification of the skin friction, even fora relatively small
bubble volume fractioninjected in thenear wall region.The key
parametersseemtobethevoidfractionandtheinjectionposition
whereasthebubblesizeislessimportant,atleastaslongas
bub-blesaresmallerthanoroftheorderofthefrictionlength.Itseems
thatthedragisdecreasedwhenbubblesareinjectedintheviscous
sub-layerwhileitisincreasedwhentheyareinjectedinthebuffer
layer.Weshowthatthisdragbehaviorisrelatedtoachangeofthe
nearwallflowstructures,andthusoftheirregenerationcycle,
de-pendingonthebubblesinjectionlocation.Theresultingchangein
theintensityoftheso-called”sweep” and”burst” causesa
modifi-cationofthemeanstreamwisemomentumfluxinthewallnormal
direction,asconfirmedbytheReynoldsshearstressprofiles
result-inginthechangeoftheskinfriction.However,itremainsanopen
problem inturbulence howto quantitatively relate the alteration
oftheregenerationcycle(oratleasttheevolutionofthedifferent
quadrantscontribution)totheoverallwallshearstress.
Acknowledgments
We acknowledgethesupportofthefrench ANR(Project
num-ber ANR-12-ASTR-0017). This work was performedusing HPC
re-sourcesfromGENCI-CINES/IDRISandCALMIPcenterofthe
Univer-sity ofToulouse.We alsothankAnnaïgPedrono forher technical
support.
AppendixA. TheSyntheticEddyMethod(SEM)
TheSyntheticEddyMethod SEM techniqueisbasedonthe
hy-pothesisthat turbulencecanbemodeled assuperpositionsof
co-herent structures. [46] suggested that superpositionof analytical
eddieswith shapesinspired by realcoherent structures provides
a decent approximationof lower-order statistics ofwall-bounded
flows. Therefore, SEM deals with generating synthetic eddies at
theinletplane usingspecificshape functionwhichcontainstheir
spatial andtemporal characteristics. The inlet plane is located at
x=0andhas physicaldimensions[0, Ly]×[0, Lz]in wall-normal
andspanwisedirections, whilethe full domainhasthe length Lx
inthestreamwisedirection.Thegridisuniforminthestreamwise
(x)andspanwise(z)directionswithresolution
1
xand1
zrespec-tivelyandstretchedinwall-normaldirection(y)usingatangential
stretchingfunction,thus
1
yincreasesawayfromthewall.Asafirststepathree-dimensionalvirtualboxBcontaining the
eddies is created around the inlet. The dimensions of the box B
are [−lx,lx]×[−ly,Ly+ly]×[−lz,Lz+lz] and eddiesare generated
atsomerandomlychosenlocationsinsidethisdomain.Thevolume
oftheboxisdenotedbyVBandthenumberofeddiesproducedis
NE.
Thestochastic velocity signal u˜ ata point xis assumedtobe
thesuperimposition ofthecontributionfromalltheeddies NE in
theboxB, ˜ ui
(
x)
= 1p
NE NE X k=1ǫ
kf σ (x)(
x−xk)
(A.1)where
ǫ
k accountsforthepositiveornegativecontributiontothesynthetic field andhas equal probability to take value ±1.Here
theshapefunctionfortheeddiesisdefinedas
fσ (x)
(
x−xk)
=p
VB 1σ
xσ
yσ
z f³
x−x kσ
x´
f³
y−y kσ
y´
f³
z−z kσ
z´
(A.2)fhasacompactsupporton[−1,1]andsatisfiesthenormalization
condition
Z1
−1
f2
(
x)
d x= 1 (A.3)Fig. A1. Pictorial representation of synthetic eddy method. Purple square represent the inlet plane where the initial turbulent condition is supposed to be generated. Black domain is the boundary of the virtual box whose size is dependent on the length scales of the eddies generated.
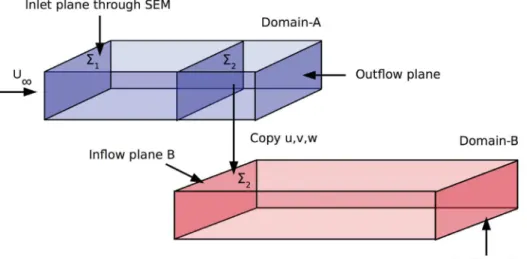
Fig. A2. Schematic representation of Domain-A - Domain-B configuration.
Inthepresentstudyfischosentobeatentfunction,
f
(
x)
=½p
32
(
1 −|
x|
)
, x ≤10 , otherwise (A.4)
Here
σ
x,σ
y,σ
zcontrolthesizeoftheeddygenerated.Itisad-visedtochoosethelengthscalesclosetotheonefoundinreal
tur-bulentflowasitstronglyaffectstheturbulentfluctuations
gener-ateddownstreamoftheinlet(see[43]).However,differentchoices
forlengthscaleshavebeeninvestigatedin[19]and[21]and
sensi-tive dependence ofthe results onthem is discussed indetail. In
the present study we have chosen length scales to be isotropic
(
σ
x=σ
y=σ
z=σ
(
y)
) andtovary withthe wall normaldirection(y)basedonPrandtl’smixing-lengthhypothesisi.e.
σ
(
y)
=ky.How-ever,duetothegridstretchinginthewall-normal(y),closetothe
wall the sizeof theeddy becomestoo smallto bediscretized in
spanwise and streamwise direction, therefore the following
rela-tionisusedtoestimatethesizeoftheeddies
σ
(
y)
= max{
ky,1
}
(A.5)where
1
=max(1
x,1
y,1
z)
andk=0.41istheVonKármáncon-stant. The eddiesgenerated inside the box B are convectedwith
constantvelocityUccharacteristicoftheflowusingTaylor’sfrozen
turbulencehypothesis.Ateachtimestepthenewpositionsofthe
eddiesaregivenby
xk
(
t + dt)
= xk(
t)
+ Ucdt (A.6)wheredtisthetimestepofthesimulation.Whenaneddyleaves
the boxB,a neweddy isgenerated onthe inletof thebox with
randomspanwiseandwall-normallocations.
Once u˜ is generated on the inlet plane with the appropriate
temporal and spatial correlations, one obtains a velocity field u
withtheprescribedmeanandcovarianceprofiles,by linear
trans-formationofu˜,(providingthatu˜iu˜j=
δ
i j):ui
(
y,z,t)
= Ui(
y)
+ Ai j(
y)
u˜ j(
y,z,t)
(A.7)whereUi(y)isthemeanvelocityprofileandAij(y)istheCholesky
decompositionoftheReynoldsstresstensorRij(y)profile:
Ai j=
p
R11 0 0 R21/A11p
R22−A221 0 R31/A11(
R22−A21A31)
/A22p
R22−A221−A32
(A.8)Becausewith SEM techniconlythelargestturbulentstructures
are generated, the flow presents a transient region downstream
theinletplanebeforereachingthefullyrealisticturbulent
correla-tionsandstructures.Eddiesofsmallersizewerefoundtoundergo
alongtransientandtherefore,requirealongercomputational
do-main toreach higherReynoldsnumber.Moreover, awayfromthe
wall the smaller structures dissipate rather than to evolve into
large-scale structures resulting in unphysical velocity field.
How-ever, whenPrandtl’smixing-length hypothesis(seeEq.A.5) isused
to provideinhomogeneityinthewall normaldirection,the
large-scale structures away fromthe wall breakdown andenergy
cas-cadestosmallerscales,therebyprovingmorephysicaleddy
distri-butions.
Topreventtheinteractionofbubbleswithunphysicalstructures
due tothe transient,we add bubbles afterthetransientand
dis-regard the transientlength in furtheranalysis. Tosave
computa-tionaltimethesimulationispartitionedintotwoseparate
simula-tions ([10]). Theyare referredas Domain-A and Domain-B
sim-ulations. The advantage ofthis setup isthat we have toperform
Domain-A simulationonly onceto makea databaseofmore
re-alistic inletboundaryconditions. Domain-B ,whenprovided with
theinletconditionissuedfromthe Domain-A ,simulationdoesnot
need anytransitionlengthto becometurbulent. Thestrategy
im-plementedcouldbesummarizedinthefollowingsteps:
1.Domain-A utilizes SEM togenerateboundaryconditionatthe inletplane
6
1.2. Ateverytimesteps of Domain-A run,thevelocityfield inthe
y−z plane
6
2 locatedatstreamwise location 12δ
is savedtothedisc.
3. Domain-B readsthisvelocityfieldevery timestepasaninlet
boundarycondition.
AppendixB. Verificationandvalidation
We presentthe differenttest casesusedtoverifyandvalidate
the newimplementations inourJADIM code.We firstreport the
validationoftheturbulentboundarylayersimulationinB.1.Then
inB.2themomentumforcing termFd→c hasbeentestedwithout
anyothervoidfractioneffectbysetting
ε
c=1(case1),andeven-tually inB.3thedifferentcontributionsofthevariation
ε
c inboththe continuityandthemomentum equationsareverifiedwithout
consideringtheeffectofFd→c (cases2to6).
B1. Validationoftheturbulentboundarylayersimulation
We report herethe validationoftheturbulent boundarylayer
simulation.Asexplained,inSectionAppendixA,thesynthetic
ed-dies generatedneedsome streamwisedistancetoevolveand
Fig. B1. (a) Mean flow profiles U +(y +) ; (b) profile of the variance of the three velocity components u +
rms , v+rms and w +rms ; (c) Reynolds stress −u ′v′
+
profile. Comparison with the DNS of [23] .
Table B1
Relative error for the pressure gradient as a function of the mean void fraction.
α 5 . 1 × 10 −4 5 . 1 × 10 −3 5 . 1 × 10 −2 Relative error for 1P 5 . 4 × 10 −6 7 . 3 × 10 −6 6 . 3 × 10 −6
the interaction of bubbles with these un-physical structures and
savecomputationaltime,we havebrokenthesimulationintotwo
parts Domain-A - Domain-B (Fig. A2). In Domain-A we
per-formed a single phase simulation in order to generate an inlet
boundary condition database that will be subsequently used for
the two-phase flow simulations carried out in the Domain-B .
Table 3 presents the dimension and the mesh resolution of the
Domain-B .Notethat Domain-A isthree timeslongerin
stream-wise direction than Domain-B andof thesamesize inspanwise
andwall-normaldirections.
FigureB1showsthestatisticsofturbulenceforthesinglephase
flowcomparedagainsttheDNSresultsof[23]atReθ≈1100where
Reθ=U0
δ
θ/ν
.Thesestatisticsarecomputedbytemporalandspan-wiseaverageatagivenstreamwiselocation.Thestreamwisemean
velocity profileisingoodagreementwith[23].Similarly,the
pro-files of the variance of the streamwise and wall-normal velocity
componentsareingoodagreement,but,forthespanwisevelocity
componentweobserveaslightdiscrepancywhichislikelydueto
thesmallerspanwisewidthconsideredinoursimulations.
B2. Verificationoftheimplementationofthemomentumforcing termFd
→c
We first verifythe momentum forcing term Fd→c by
consid-ering the pressure drop generated by a random distribution of
fixed identical bubbles. We consider a 3D channel as shown in
the figureB2.Thedimensionsof thechannel areLx,Ly andLz in
the x, yand z directions,respectively. Theyare chosen such that
Lx=5Lyand Lz=1.175Ly.Nbbubbles ofvolume Vbare randomly
distributedandmaintainedfixedinthecentralpartofthedomain
Fig. B2. Sketch of the geometrical configuration used for the verification in the case 1 with N b = 40 , 0 0 0 uniformly distributed bubbles of radius R b = 2 × 10 −4 L y .
Lx/4≤xb≤3Lx/4.Inthisregionthemeanvoidfractionisthus
α
= NbVbLxLyLz/ 2
Threedifferentvoidfractions,
α
=5.1×10−4,5.1×10−3and5.1×10−2, are considered. We impose a constant inlet velocity U=
U1ex. Stress-free boundary conditions are imposed on the four
boundaries parallel to the mean flow and inflow-outflow
condi-tionsintheaxialdirection. Themeshisregularinthexandz
di-rectionswhileitisnon-uniformintheydirection.Thenumbersof
cellsineachdirectionareNx=50andNy=Nz=64,respectively.
Inthiscase,wedo notconsidertheeffectofthevoidfraction
in the system of equations (9–10). By imposing the momentum
sourceterm−Fbexforeachbubble,thepressurejumpbetweenthe
inletpressurePinandtheoutletpressurePoutisgivenby: