an author's https://oatao.univ-toulouse.fr/22887
https://doi.org/10.1088/1748-3190/aaec61
Gavrilovic, Nikola and Abdulghani, Mohamed and Marino, Matthew and Watkins, Simon and Moschetta, Jean-Marc and Bénard, Emmanuel Avian-inspired energy-harvesting from atmospheric phenomena for small UAVs. (2018) Bioinspiration & Biomimetics, 14 (1). 1-20. ISSN 1748-3190
https://doi.org/J0.1088/l 748-3190/aaec61
Bioinspiration & Biomimetics
PAPER
Avian-inspired energy-harvesting from atmospheric phenomena for
small UAVs
N Gavrilovic 1e, A Mohamed2C, M Marino2C, S Watkins2, J-M Moschetta 1(!) and E Be nard 1(!) 1 ISAE-SUPAERO, Université de Toulouse, 31400 Toulouse, France
2 RMIT University, GPO BOX 2476,Melbourne, Victoria 300 l,Australia
E-mail: nikola.gavrilovic@isae.fr
Keywords: energy harvesting, energy extraction, atmospheric phenomena, small UAV, performance improvement, aerodynamics, flight mechanics
Abstract
Fixed-wing small, unmanned aerial vehicles usually fly in atmospheric boundary layers that are often un der the influence of turbulent environments. Inspired by nature' s flyers, an application of an energy-harvesting flight strategy for increasing the energy state of the aircraft is presented. This paper provides basic longitudinal flight dynamic model exposing the physics behind the process. It shows significant power savings in flight with a sinusoïdal and stochastic wind profile with active control of energy-harvesting. The active control based on optimized proportional gains was implemented for energy extraction from realistic atmospheric conditions, leading to significant energy savings for a 'bird-sized' vehicle. The paper reveals the equipment and necessary preparations for the flight test campaign. Moreover, it describes the design of a custom controller and its calibration in the wind tunnel against roll movements during pitching maneuvers. Finally, it investigates the benefits and potential of the automated process of energy-harvesting with simple proportional control through flight tests in a turbulent environment, validating the concept through the increased energy state of the aircraft.
Nomenclature
Cv CL CM Cr D E, K1, K2, ... ,K,, L L,,x M m p T T; Vw
X;, Z; a Drag coefficient Lift coefficient Moment coefficient Thrust coefficient Thrust force, N Specific energy, J • kg-1 Control gains Lift force, NLongitudinal length scale, m Moment,N·m Mass,kg Specific power, J/(kg • s) Thrust force, N Turbulence intensity Airspeed, m · s-1 Weight,N
Longitudinal, vertical and lateral components, m -s-1
Ground speed and climb speed, m • s-1
Angle of attack, deg
8 Elevator deflection, deg Î Flight-path angle, deg 0 Pitch angle, deg
</> Roll angle, deg
1. Introduction
Small unmanned aerial vehicles (SUAVs) usually operate within the lowest level of the atmospheric boundary layer. Such a flying environment implies a complex interaction between the natural obstacles (i.e. the Earth' s relief and living world), physical conditions and moving atmosphere. Being surrounded by either human-made or natural obstacles, small UAVs can very often experience turbulence with characteristic length scales on the order of a couple of meters. The performance of those small vehicles is usually limited by the amount of onboard energy. Therefore, the lack of endurance and range greatly reduces the utility of such vehicles. Ideas of dynamic energy transfer between atmospheric phenomena and flight vehicles are observed in nature. The airspace of small UAVs is
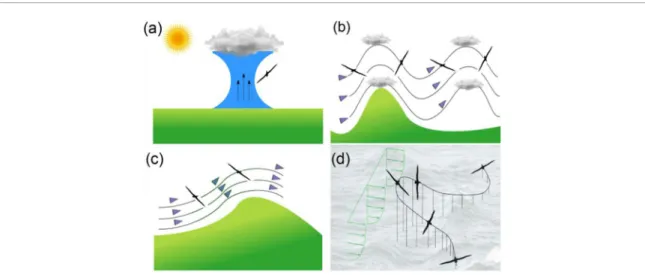
very often shared with natural flyers. Observations of various bird species through years have shown that birds use their natural sensory systems, according to Videler [1], for perception and utilization of atmospheric phenomena. The available energy is present in the form of vertical air movements (see figures 1(a)) such as thermals, spatial gradients as for example shear layers and short-period temporal gradients, described as gusts. Various styles of flight could be noticed while bird watching. According to [2, 3] birds use several strategies of energy-harvesting, which serve as an inspiration for all the current improvements in the field of UAV long endurance performance. Interaction of wind with obstacles such as buildings, hills or waves can result in vertical air motions (see figures 1(b) and (c)). Many birds with knowledge of soaring techniques use these up-drafts in order to minimize the invested energy of flapping. Unequal heating of earth’s surface provoked for example by punctured cloud layer, implies uplift of hot air, known as thermal. Eagles, condors, vultures and many other large birds use these up-drafts with a technique called thermal soaring in order to reduce energy invested while searching for prey. Another example is sweeping flight within the gust caused by the waves. Gulls and pelicans use these gusts to power their flight along the wave cliffs. Some birds, such as kestrels, remain motionless above a point on the ground by flying into the wind at a speed equal to that of the wind. This flying technique is called wind hovering. However, there are many reasons why identical copies from nature to practical technologies are not achievable. It took millions of years of evolution to develop such extraordinary sensory systems and skills of natural flyers, whereas, an imaginative inspiration and transformation into technology are usually based on multiple steps of abstraction.
2. Related research
A significant amount of work from Brown [4] has been reported on an analysis of biological systems and
mechanisms in bird skin for detection of atmospheric disturbances. However, complex bio-structure of natural flyers cannot be replicated for technical application. Instead, it can serve as inspiration for the following achievements. The bio-inspired system for sensing of atmospheric disturbances on vehicle’s wing was introduced by Mohamed [5–7], and further experimentally tested for disturbance rejection [8–11]. Furthermore, real-time information on the angle of attack from wing pressure measurements in the purpose of wind field estimation was demonstrated by Gavrilovic [12].
The performance of SUAVs is degraded by the lim-ited amount of onboard energy due to the small pay-load capacity and low Reynolds number flight [13]. These performance constraints can be significantly augmented by atmospheric energy harvesting flight strategies. Atmospheric energy harvesting aims to exploit disturbances, resulting in increasing the energy state of the aircraft and overall performance in the form of endurance and range.
One of the most famous strategies for flying between sources of lifting air is known as MacCready [14] speed to fly principle. Recent findings by Mako-vin and Langelaan [15] reveal that the optimal air-speed for maximizing the energy transfer between the vehicle and quasi-stationary wind (as for example thermal) is between best lift-to-drag ratio and speed estimated by MacCready theory, depending mainly on the magnitude of the vertical wind component and time needed to go back to initial altitude. An applica-tion of a biomimetic energy harvesting algorithm to the trajectory planning of a small UAV within atmos-pheric convection is presented by Gudmundsson et al [16]. This work is further developed into a control algorithm with decisive mechanism whether to devi-ate from original flight trajectory or to take advantage of it [17]. The optimal flight trajectories for energy-harvesting inspired by albatross flight (that are often called dynamic soaring are shown in figure 1(d)) were demonstrated by Zhao [18], Bonnin [19] and, most recently, Liu [20]. While a significant amount of work
has been done on exploiting long-duration atmos-pheric effects with a flight strategy often called autono-mous soaring (for example the experiment described by Fisher [21], Watkins [22], Mohamed [23] and more recently by Depenbusch [24]) and dynamic soaring (exploiting spatial gradients), a few theoretical works have been performed on exploiting gusts. The longi-tudinal point mass flight dynamic model using optim-ized control law for energy harvesting within Dryden and sinusoidal wind models have been demonstrated theoretically by Langelaan [25, 26] and Depenbusch [27]. Both energy extractions from static and dynamic soaring are usually treated as deterministic problems. On the other hand, the nature of gusts is inherently sto-chastic, with short duration, and generally far greater spatial variation. Previous work performed by Patel and Kroo [28] examined a way of gust energy harvest-ing in both theor etical and exper imental ways. The flight tests demonstrated the feasibility of the concept with a simple feedback control law. However, the con-trol input was based on the energy state of the aircraft and its change in time, which is why it was limited to only exploitation of uniform vertical gusts. A method to compute an equivalent thrust coefficient which occurs due to vertical gust is proposed by Phillips [29], with the conclusion that the effect is too small to be useful for commercial aircraft. On the contrary, this approach shows a significant performance improve-ment for small UAV is possible.
The presented research provides an overall meth-odology of preparing the system for energy-harvest-ing from atmospheric phenomena. Some theoretical aspects will be presented, exploiting the sinusoidal and more complex stochastic wind field. The work pro-vides a natural extension to existing work published [30], whereby, theoretical aspects of atmospheric energy extraction are explored. This paper goes further with the experimental setup for wind field estimation and its usage for active control of energy-harvesting. It takes the advantage of currently available sophisticated equipment for sensing of flow disorders.
It enhances the understanding of the energy-extraction mechanism and points out the difficulties and challenges of experimental outdoor tests.
3. Flight mechanics
3.1. Theoretical aspectsThe aim of this section is to reveal the mechanisms for energy retrieval from atmospheric phenomena through equations of motion and the possible influence of some aerodynamic parameters on overall energy gain.
A basic example of energy-extraction is illustrated in figure 2. A small UAV suddenly experience a vertical wind with a certain magnitude, at speed Uo. Since lift
acts perpendicular to the local wind, the new lift vec-tor will be tilted forward with a small additional comp-onent acting as an effective thrust. This additional lift component is performing a positive work on the air-craft and negative work on the gust. The figure also shows the case of a downdraft, where the aircraft is experiencing negative g’s. This case also brings posi-tive energy gain to the aircraft. The concept remains valid also if the aircraft is flying through a lateral gust, where the bank angle is such that the aircraft performs a downwind turn aligning lift force with the gust. In general, a positive work is achieved when the lift vec-tor is aligned with the gust. The previously described mechanism has been explained in the work of Patel and Kroo [28]. Further investigation of more complex flight physics is exposed with the decomposition of equations of motion.
The equations are developed for flight with wind disturbances in the only vertical plane (i.e. longitudi-nal flight dynamics shown in figure 3). The develop-ment of the system of equations for aircraft motion follows the works of Langelaan [25, 26] and Lawrance [31].
The fundamental purpose of atmospheric energy-harvesting is to elevate the energy state of the aircraft by performing controlled maneuvers according to experienced wind perturbations. The system of differ-ential equations for longitudinal flight dynamics is expressed in the air-path reference system and pre-sented with equations (1), (2) and (3).
T − D − W sin γ = W/g( ˙V + ˙wxcos γ− ˙wzsin γ)
(1)
−L + W cos γ = W/g(−V ˙γ + ˙wxsin γ + ˙wzcos γ)
(2) M = ¨θIyy.
(3) Very often, the aircraft’s lift and moment coefficients can be expressed by the Maclaurin series according to Rasuo [32, 33] and presented in equations (4) and (5).
CL = CL0+ CLαα + CL ˙α ˙αl 2V + CL ˙θ ˙θl 2V + Ç CLδeδe+ CL ˙δe ˙δl 2V + . . . å con + . . . (4) CM= CM0+ CMαα + CM ˙α ˙αl 2V + CM ˙θ ˙θl 2V + Ç CMδeδe+ CM ˙δe ˙δl 2V + . . . å con + . . . . (5) With further integration, we have a rate of energy change with time (specific power equation in equation (6)).
˙Es = ˙Ea/m =−gwz+ qS/m(CTcos α− CD) V − V( ˙wxcos γ− ˙wzsin γ). (6)
The first term of this equation states that energy can be gained with a negative component of vertical wind (static soaring in thermal and orographic updraft). It represents the rate at which gravitational potential energy is harvested when flying within an updraft (wz < 0). This rate is independent on the flight,
depending only on the strength of the updraft and weight of the vehicle. The most representative case of such an energy gain would be a soaring flight of birds in thermals. The second part illustrates power loss due to drag and power available in form of thrust. Finally, the last term reveals the potential of wind gradients. With a proper control law, the goal of any atmospheric energy harvesting strategy would be to maximize and maintain the last term at a positive value, with respect to the optimal relation with the power required.
The third part of the previous equation is isolated and taken for further integration. It reveals specific flight cases for which energy transfer between aircraft and the atmosphere is maximized. By analyzing wind derivatives in the longitudinal plane, we can distin-guish some specific flight cases for maximization of energy gain. The wind field is assumed to be frozen in space, where ∇w is the spatial gradient of the wind vector, as shown in equation (7).
dw dt = ∇w ñ ˙xi ˙ zi ô = ∂wx/∂x∂wx/∂z ∂wz/∂x∂wz/∂z ï˙xi ˙ zi ò . (7) The specific flight cases for maximization of energy retrieval have been obtained, with detailed decomposition, including first- and second-order derivations of specific power equation parts related to the wind derivatives are shown in equations (8) and (9). ˙Ea, ˙w x/m =−V ˙wx cos γ = ∂wx/∂x (V cos γ + wx) V cos γ− ∂wx/∂z (−V sin γ + wz) V cos γ (8) ˙Ea, ˙wz/m =−V ˙wzsin γ = ∂wz/∂x (V cos γ + wx) V sin γ +∂wz/∂z (−V sin γ + wz) V sin γ. (9)
Analysis of different parts of previous equations and multiple derivations brought the upcoming extreme cases, where specific flight maneuvers can be recognized.
(1) Energy maximization in presence of horizontal wind shear ∂wx/∂z would
imply climbing into a positive gradient and descending into a negative gradient with an optimal flight path angle shown in equation (10). γ = sin−1 Ç wz± 8V2+ w2z 4V å . (10)
Assuming the vertical wind component is much less than the forward airspeed, optimal flight path angle is close to 45°.
(2) Energy maximization in presence of vertical wind shear ∂wz/∂x would imply climbing
into a positive gradient and descending into a negative gradient with optimal flight path angle shown in equation (11).
γ = cos−1 Ç wx± 8V2+ w2x 4V å . (11)
Assuming the horizontal wind component is much less than the forward airspeed, optimal flight path angle is close to 45°.
It can be concluded that maximization of energy transfer between the aircraft and wind requires certain maneuvers to be performed. Those maneuvers need to be adjusted according to the wind field. Therefore, we justify the purpose of using active control dur-ing energy harvestdur-ing cycles. It is also important to note that it would be possible to undertake an analy-sis in which kinetic energy is defined with respect to groundspeed rather than to airspeed. However, in the examples illustrated in figure 4, the fundamental source of energy is the variation in wind speed that the vehicle encounters as it passes through the wind gradi-ent. Moreover, it is the vehicle’s airspeed and not the groundspeed which determines the aerodynamic force that is produced. Therefore, while it is possible to use both formulations to solve for flight trajectories that result in no net change in mechanical energy over a period of cyclical ascent and descent, the mechanism by which useful energy is gained must be understood in relation to the vehicle’s movement relative to the air. The previous statements are in accord with a descrip-tion of the mechanism by Rayleigh [34] and more recently by Taylor [35].
3.2. Simulations
Simulations were conducted in order to reveal the physics behind the energy-harvesting mechanism. In these simulations, we consider only the longitudinal motion of the aircraft represented as a point mass model with the equations previously described
in section 3.1. The kinematics of the vehicle has been solved with Matlab’s Runge–Kutta ordinary differential solver ODE45. The solutions of the system are (1): the airspeed (2), pitch and (3) flight path angle, from which all the other parameters of flight can be assessed. Aerodynamic derivatives and polar have been obtained with vortex lattice method using athena vortex lattice (AVL), including the prediction of viscous drag as demonstrated by Bronz [36], where the viscous drag coefficient was in function of a chord-based Reynolds number and the total angle of attack of each section. All the parameters of the aircraft are shown in table 1. The geometrical representation of the aircraft is shown in figure 5, based on a conventional high wing model aircraft ‘Tundra’ later described and used for the experimental investigation. The active control used in simulations consists of a set of proportional gains, as shown in equation (12), which has been previously demonstrated by Gavrilovic [30]. The elevator of the horizontal tail will be deflected according to a priori known wind field. The active
Figure 4. Flight maneuvers for energy maximization within wind gradients.
Table 1. Aerodynamic properties of Tundra.
Parameter Value Description
m 1.2 kg Mass of the aircraft
b 1.3 m Wingspan
la 0.2 m Mean aerodynamic
chord
S 0.26 m2 Surface of wing
Airfoil Clark Y Wing
V 13 m s−1 Airspeed
λ 6.5 Wing aspect ratio
Iyy 0.115 kg · m2 Pitch moment of
inertia
(CL/CD)max 12.5 Lift to drag ratio
CLα 5.12/rad Lift slope
CLq 13.78/rad — CLδe 0.45/rad — CD 5 · 10−6 𝛼4 − 4 · 10−5 𝛼3 + — 4 · 10−4 𝛼2 + 3.2 · 10−3𝛼 + — 0.041 — CMα −3.33/rad — CMq 19.83/rad —
control involves a set of proportional gains that directly multiply a priori known wind components and their derivative. Determination of the proportional gains has been performed with an optimization method for a certain gust profile.
δe= K1w + K2˙w.
(12) The optimization problem has been established with the objective of maximizing the specific power gain coming from the wind derivative, using the non-sorting genetic algorithm II (NSGAII). Optimization algorithm used in this work can be found in OpenMDAO package for PYTHON programming language. It is important to point out that the maximum lift coefficient represented limiting factor for maximum energy harvested within sinusoidal wind profiles. During optimization, the maximum gain in specific power would usually be constrained by maximum lift coefficient achieved in oscillations. The second constraint is related to the maximum allowed angle of deflection for the elevator of the horizontal tail.
3.2.1. Sinusoidal wind profile
The first results in this study reveal simulations in the vertical plane with arbitrarily imposed sinusoidal wind profile with frequency and amplitude, shown in figure 6. Two flights from table 2 are shown in figure 6. The first one is with energy-harvesting mode (full lines on the figure). The second flight shown in figure 6 (presented with dashed line) represents auto stabilization for maintaining constant altitude level. The second sub-graph in figure 6 shows the variation of certain parts of the specific power equation. In case of energy-harvesting flight, the power coming from the wind fluctuations is always positive and of significant magnitude compared to required power. The wind specific power showed on the second sub-graph of figure 6 represents the third part of the specific power equation from section 3.1. The graph also shows that the aircraft performs maneuvers according to the theoretical representation in figure 2. For the negative component of vertical wind, the elevator deflection is positive which corresponds to pitching up maneuver and vice versa. The third subgraph shows the calculated trajectory, where the aircraft maintains almost constant energetic level. The results demonstrated
a relatively constant trajectory (constant energetic level) with around 40% less required thrust with active control for energy extraction when compared to cruise flight conditions in the calm atmosphere. The amount of energy gained from wind fluctuations has been compensated with less required thrust in order to maintain the same energy level as in steady flight. The last sub-graph illustrates the activation of horizontal stabilizer during the flight, satisfying the constraint of never exceeding fifty degrees of activation. Despite the idealistic flow conditions (i.e. unrealistic gust profile), the simulations proved the feasibility of the atmospheric energy harvesting flight strategy and showed promising values in terms of extended range and endurance.
Results related to four different flight cases are summarized in table 2. All the flights performed alti-tude hold task, meaning that mean altialti-tude change was zero. The reference flight is conducted in the calm atmosphere (i.e. with no wind conditions) where the necessary thrust coefficient is determined. The second flight considers a flight with fixed-stick within vertical wind profile shown. It illustrates potential benefits in the case of no control. The next flight assumes usage of proportional-integral (PI) regulator for maintain-ing altitude hold within given wind conditions. This flight requires around 7% more power when com-pared to reference flight. It reflects on the auto-sta-bilization mode of autopilot in loitering at constant altitude. Finally, the fourth flight brought a saving of around 40% when compared to a reference value. Pre-vious results evaluate three possible flight scenarios within sinusoidal vertical gust and their comparison with flight through the calm atmosphere. It can be concluded that energy-harvesting brought significant energy savings, and would, therefore, be preferred flight regime in such atmospheric conditions.
To further explore the feasibility of energy-harvest-ing, where additional flight simulations with different frequencies and magnitudes of the sinusoidal profile were performed. The equations of flight dynamics were solved with the objective of maximizing the mean specific power (noted as Pm,wind and the third part of
general specific power equation) coming from wind fluctuations. The constraining parameter for specific power maximization was the maximum lift coefficient.
Following figure 7 introduces the ratio between mean specific power coming from wind fluctuations and mean specific power lost due to drag in the function of gust frequency and magnitude. The introduced ratio quantifies the savings in term of necessary thrust to maintain stable energetic level. Any ratio bigger than zero would provide savings in term of thrust required to overcome drag. It can be concluded from the results shown in figure 7 that the ratio of mean specific power from wind fluctuations and required power grows considerably with the magnitude of the sinusoidal gust. On the contrary, the rise in frequency for a single magnitude did not bring any significant benefits to the overall power of the aircraft. The results demonstrate the importance and contribution of wind magnitude
in energy transfer between the aircraft and turbulent atmosphere.
Figure 8 shows variation in flight path-angle for energy extraction maximization within the sinusoidal wind profile (colored dots represent the corre sponding values at the same time of the simulation). Once again wind profile is assumed to be frozen in space. The third sub-figure illustrates theoretical conclusions of the sub-chapter 3.1 (shown in figure 4) related to neces-sary flight path orientation according to the gradient strength and sign. With positive and decreasing verti-cal wind component (weakening downdraft) aircraft tends to descend. With negative and increasing vertical wind component (increasing updraft) aircraft tends to increase its climb.
3.2.2. Kaimal spectrum profile
Before attempting any experiment a more complex wind field was utilized in the simulations. A more representative gust was generated with expanded Fourier series following the natural law of turbulence dissipation defined by Kaimal [37]. The process in sections 3.1–3.2.1 was repeated and the control was optimized for the more representative wind field defined by the Kaimal spectrum presented in [37] and
Figure 6. Flight simulations within sinusoidal wind profile. Table 2. Flight regime comparison.
Flight case
Altitude hold
Mean energy gain Flight through calm atmosphere ±0 m Reference ct Fixed-stick flight wz= 2 sin (1.8t) ±0.35 m +2% Auto-stabilization flight
wz= 2 sin (1.8t)
±0.02 m −7%
used in [30]. The Kaimal spectrum was developed from the long-term experimental study over the flat homogeneous terrain. The recent findings of Fortuniak [38] confirmed that the spectral and co-spectral properties of the flow at the top of the urban roughness sublayer were almost identical to those for homogeneous flat terrain and many universal functions found for investigated surfaces can be directly applied for urbanized areas. Although the Kaimal spectral representation is empirical, it incorporates several factors such as terrain roughness, wind shear and mean wind magnitude which cannot be found in widely used Von Karman or Dryden spectral representations.
Once again, positive contribution to specific power from wind fluctuations can be seen on second sub-graph of figure 9. A relatively stable energetic level was achieved with around 15% less required thrust when compared to cruise conditions. This is a significant reduction compared to the sinusoidal representation of gust, but nevertheless, 15% is still considerable. The following sections discuss a flight test campaign in real atmospheric conditions.
4. Methodology and instrumentation for
experiments
4.1. Sensors
Real-time sensing of the flow oncoming onto an aircraft is required to enable effective gust soaring. Although onboard accelerometers can be used they are reactive in nature [39]. Flow sensors capable of sensing the disturbance (i.e. Gust) rather than the perturbation induced, is required. Mohamed et al [17] described phase advanced sensors capable of sensing gusts before they induce a perturbation providing a control system with valuable time to react. Such sensors were experimentally proven for gust mitigation applications, enabling a reduction in perturbations by up to 50% [9]. By utilizing these sensors in the work presented in this paper, it is possible to sense oncoming gusts for energy harvesting. The phase advanced sensors described by Mohamed [9] have been used here. These sensors consist of pressure-based multi-hole probes that can measure flow angles and airspeed in flight. A single tube provides real-time measurement of the local angle of attack and airspeed ahead of the
Figure 7. Ratio of mean specific power from wind fluctuations and required power for sinusoidal profile (w = kgsin(ωt)).
wing. Therefore, two probes placed at mid-span of the wings were deemed sufficient for gust soaring.
If gust length scales were equal to or larger than the wingspan, then flight through such a large gust structure would result in only pitching and heav-ing motion. However, gusts smaller than the wheav-ing- wing-span would provoke unequal load distribution along wingspan implying additional roll and yaw moments on the wing. The longitudinal energy harvesting con-troller developed focuses on the pitching and heav-ing motion. Other disturbances are accounted for using standard attitude stability loops implemented on the autopilot micro-controller. In order to prevent unwanted motion of the aircraft due to the relatively small gusts (less than wingspan), two pitch probes have been used on experimental aircraft for gust mitigation similar to how Mohamed [9] has done it. The calibra-tion of the multi-hole probes has been performed with a method presented by Chue [40]. The calibration of sensors is conducted in nominally smooth flow condi-tions in order to establish the relation of pressure and angle of attack. Pressure measured by the pitch probe shows a linear relationship with the angle of attack for defined airspeed. Measured differential pressure is therefore normalized with dynamic pressure in order to ensure independence from various airspeeds. Pre-viously explained sensing system is based on Taylor’s hypothesis assuming that turbulent structures remain frozen during advection, by Taylor [41]. Of course, turbulence always varies and is in reality never frozen. However, the hypothesis holds true, particularly over short distances.
4.2. Flight vehicle
To verify the energy extraction method, flight trials using a custom flight controller were performed. Other studies have shown simulation studies and flight tests performed on efficient glider models which have low drag and good aerodynamic performance [26, 30, 42].
We utilize a commercially available recreational aircraft (1300 mm wing-span shown in figure 10) based on Tundra short take-off and landing (STOL) vehicle. This type of aircraft could be representative of a powered drone which has been loaded with sen-sors and other payloads. It has a relatively stable and conventional configuration with durable landing gear (serving mainly to protect pitch probes on landings) and considerably more payload space when compared to glider configurations of similar size. Modifications to the aircraft were required to house pressure probes on each side of the wing.
4.3. Control architecture
The internal avionics system consists of the main board containing microcontroller, inertial measurement unit, device for wireless serial communication and peripheral devices such as global positioning system (GPS) and pressure sensors. The integrated microcontroller is Teensy 3.5 featuring 32 bit 120 MHz processor. All the components used in this work are shown in table 3. The mainboard shown in figure 11 has been designed to accept six servo devices (as output channels), two flight receivers with serial communication and multiple analog and digital inputs for sensor acquisition. Wireless serial communication can be established through Xbee
devices, enabling real-time insight of flight parameters on the laptop. The flight controller’s onboard six degrees of freedom IMU provides basic inertial feedback from accelerometer and gyroscope, later transferred to pitch and roll angles. All the parameters of flight are written on micro secured digital card with the sampling frequency of 100 Hz except for the GPS which update rate was set to be 5 Hz.
The flight control system was developed to have three modes. The first mode allowed fully manual control (MC) enabling the pilot to remotely control the servo commands on the aircraft from the ground. There is no active stabilization in this mode. The second mode is semi-automatic (SC), providing stability in roll axis and thrust regulated airspeed. SC mode still allows the pilot to interact and correct flight path from the transmitter. Finally, the third mode is fully automatic (FC) where elevator, ailerons, and thrust are following designed control laws. The software for flight control was designed in a way to permit the pilot to remotely select the desired control mode. Switching between the chosen modes in flight was achieved with a switch on the transmitter. Usual transmitter setup implies two reserved channels for potentiometer knobs. Such a configuration allows in-flight fine gain tuning of con-trol law for stabilization or energy-harvesting.
4.4. Wind tunnel testing
The first phase of wind tunnel test campaign was related to sensor calibration. The Industrial Wind Tunnel at RMIT enabled controlled and repeatable experimental conditions. The sensor calibration has been performed in nominally smooth conditions with turbulence intensity Ti < 1.5%. The first objective was to find the coefficients of the linear function for the relation between pressure measurements on the pitch probes and angle of attack.
A dedicated installation was constructed to allow pitch and heave of the aircraft. The test rig consists of two 3D printed joints attached to the wing allowing smooth rotation around center of gravity and transla-tion along metal wires attached to the floor and ceiling of the wind tunnel, see figure 12(a). The installation also allows aircraft to be fixed at a certain height in the tunnel having only rotational freedom of movement. Rotation of the vehicle was achieved with programmed activation of the elevator. Pressure-based multi-hole probes are often used to measure unsteady flow angles and velocity [43, 44]. Calibration of such instruments performed in controlled conditions allows accurate estimation of flow direction and dynamic pressure of the oncoming flow. Two multi-hole probes attached to each side of the wing have been used for local esti-mation of the angle of attack. The probes consist of three vertically aligned holes at tube’s tip. Addition-ally, static ports are distributed circularly at the outer surface of the tube. The central tube measures the total pressure, which when subtracted with static port ena-bles the estimation of dynamic pressure. The knowl-edge of dynamic pressure allows the conversion into airspeed. The probe’s tip was chamfered at 45° ena-bling range of measurements for angle close to 90°. As shown in figure 13, the differential pressure measured by directional tubes follows a linear relationship with
Figure 10. MAV airframe with pitch probes.
Table 3. Flight control components.
Part Description
Microcontroller Teensy 3.5
Mainboard (shield) Custom design
IMU MPU-6050
DGPS NEO-M8P2 RTK ublox
Pressure sensor Honeywell 005NDAA3
Serial communication Xbee S1PRO
O
Mlcrocontroller & Shlelde
Ground Station.GPS
0
Sensors0
Transmitter & Receiver; NMEA �
---� 8 Channel
• IMU
8
SD card data loggerC,
Servo block...
-�
!Jll'll!I,�
·
-
>---A
r"1
-
·
•-_;;t'� ... �· Figure 1 L Control architecture.the angle of attack. The linear fit enabled gradient to be determined and later used as a gain in the flight control system.
The case when the aircraft is being fixed for heaving and free for rotation implies equality of the pitch angle delivered by the IMU and angle of attack provided by pitch probes shown in figure 14(b). The control hard-ware including IMU device was installed inside the fuselage, and the angle of incidence was varied while the wind tunnel was working. The equality condition enables data required for pressure sensor calibra-tion as demonstrated by Mohamed [9]. Moreover, figure 14(a) illustrates the spectrum of the pressure based angle of attack and angle delivered by the IMU. It can be observed that all the frequencies and ampl-itudes of pressure based angle have a very high correla-tion with the angle from inertial measurements. This test was performed with pilot induced oscillations during the calibration procedure. Testing for various wind-tunnel speeds determined that the probe meas-urements were sensitive to Reynolds number effects. Therefore, the pressure difference between directional tubes was normalized with dynamic pressure in order to enable a reliable angle of attack estimation for vari-ous speeds.
The second phase of wind tunnel testing was related to roll stabilization and tuning of control law gains. RMIT’s Industrial Wind Tunnel (table 4 for details) was considered sufficiently large to simulate
the relevant turbulence conditions of varying length scales and intensities. Passive turbulence generation, using the hollow box, represented the most suitable method for producing elevated levels of turbulence intensity inside a wind tunnel. The hollow box, shown in figure 12(c), acts as a turbulence generator in this study. The turbulence spectrum inside the wind tun-nel was measured using the cobra probes, shown in figure 12(b), through stationary measurements (fixed position relative to wind tunnel walls). The spectrum follows −5/3 decay law as shown in figure 15. A stand-ard proportional-integral-derivative (PID) regulator was introduced in the control law system. The control coefficients were tuned manually from transmitter potentiometers. The aircraft was tethered to the front platform and ceiling neglecting drag force and weight (see figure 12(c)). The objective of having stable air-craft in the roll was a requirement from energy extrac-tion flight. Since energy harvesting tends to exploit only vertical and horizontal wind disturbances in our
Figure 13. Pitch probe calibration with upstream AoA.
Figure 14. (a) The angle of attack spectrum for IMU and Pitch probes on the test rig (b) Design of custom made pitch probes.
Table 4. RMIT industrial wind tunnel specification.
Specification Characteristics
Test section type Closed
Test section dimensions (width, height, length)
3 m, 2 m, 9 m Turbulence intensity, Ti 1.5% (empty)
case, roll motions are highly unfavourable since they can topple the aircraft out of the pitching phase. Each position and rotational angle of the hollow box ensures one length scale and turbulence intensity measured by a cobra probe in the wind tunnel. By varying these two parameters we introduce several turbulent scenarios. Mainly two positions of the hollow box were used with 0 and 45 degrees of rotation providing several turbu-lent intensities as shown in table 4.
The roll axis PID gains were tuned in the various experimental turbulence levels shown in table 4, via a process of real-time monitoring of amplitude spec-trum. Figure 16 shows the amplitude and frequency of roll angle during wind tunnel tests for the lowest and highest turbulence intensities achieved, 10% and 26% respectively. The criterion for choosing coefficients of implemented PID regulator was the average level of the amplitude of spectrum signal. The final selection was achieved by running the aircraft for 100 s over a range of estimated gain values, while analysing the resulting data, with the values selected which correspond to the least average amplitudes of the spectrum.
4.5. Gust energy extraction controller
An attitude stability flight mode which utilises several control laws was used in the flight controller as the gust energy extraction controller. As shown in figure 17 we estimate horizontal and vertical wind components from several parameters given by the sensors on-board. Based on longitudinal flight dynamics shown in figure 3 we have the following expressions for wind components in equations (13) and (14).
wx= ˙xi− V cos(θ − α)
(13) wz = ˙zi+ V sin(θ− α).
(14) Those components are being multiplied after with a set of proportional gains. Finally, the sum of wind component multiplied by a proportional gain and its derivative is used as an input to the elevator. The coefficients K1, K2, K3, and K4 have been determined and optimized from a point mass simulations for a given flight test aircraft with a method described by Gavrilovic [30]. The optimization was performed with non-sorting genetic algorithm found in
Figure 15. Longitudinal spectrum of turbulence measured with cobra probes within RMIT industrial wind tunnel with turbulence
intensity Ti = 10% (Hollow box installed).
OpenMDAO package of PYTHON. Obtained gains were then finely tuned during a flight test campaign (see section 4.6 for details). The objective function for gain optimization was energy state maximization within wind profile generated from Kaimal [37] spectrum.
One more controller has been added with the aim to control thrust input. Initial flights were performed in the calm atmosphere (no wind conditions) whereby necessary thrust was determined to perform loitering
at a constant altitude (noted as the maximum allowed thrust in figure 18). This value was set as maximum allowed thrust in FC mode. Moreover, once the air-speed exceeds 12 m s−1 the controller shuts off the thrust and the aircraft glides until the airspeed drops below 10 m s−1, where the maximum allowed thrust is again activated. A difference of 2 m s−1 between defined minimal speed for thrust activation and speed for thrust cut is defined in order to prevent too fast activation and deactivation of the motor which could
Figure 17. Control law for energy-harvesting.
Figure 18. Airspeed controller for FC mode.
lead to the destruction of electrical components. The airspeed controller is illustrated in figure 18.
As there were two probes for the angle of attack and airspeed estimation (see figure 10), they have served as a decisive mechanism for energy extraction control. If both provided outputs with difference less than a 5%, FC mode would be activated and the elevator would act based on estimated wind velocity components. In contrary, elevator input would be cancelled. This con-dition was imposed in order to ensure that pitching is performed for sufficiently large length scales of gust to warrant energy extraction.
4.6. Outdoor flight testing procedure
The chosen test site was a large cricket field surrounded by large gum trees in northern Victoria Australia shown in figure 19. A large number of surrounding trees and low-rise buildings ensured a turbulent environment. Surrounding residential houses contribute to the formation of the atmospheric boundary layer while adding to the well mixed and homogenous turbulence. For a degree of experimental repeatability, the SUAV was flown in the flight pattern shown in figure 19. The blue line of the flight path represents either MC or SC mode of control. Both modes respect pilot inputs and allow corrections in flight. Once the aircraft was aligned to an upcoming wind, FC mode was chosen from a transmitter (as a representative white arrow in figure 19). Once the SUAV went out of the segment, the pilot would input roll and pitch commands to bring back the aircraft back to the initial position.
The flights were performed with two transmitters interconnected with a cable. This setup allowed pilot flight control in all modes while a co-pilot had full
manipulation over the control of the gain tuning of the controller and flight mode selection. This improved the safety of the experiment and allowed the co-pilot to change gain and review flight response without dis-traction. One of the requests for the flight tests was to maintain relatively constant altitude and close to the height of the surrounding trees to place SUAV in areas where strong turbulence may be experienced. The total flight time of a single test was around 600 s. Flights were performed in different weeks to capture a wide range of turbulence conditions however the aircraft was exposed to a northerly wind the majority of the time which was normal for the season. A series of test flight was conducted to first trim the aircraft at a cruise condition. Furthermore, the velocity in which the air-craft would fly at minimum power for loitering flight was determined. The aircraft would fly steady and level, however, would stall if the pitch was increased. This airspeed was maintained throughout all flights using the airspeed feedback in the controller especially when the energy extraction system was activated (see figure 18 for details). This ensured that any energy gains are from additional energy from the surrounding environment and not due to thrust and power contrib-utions. Small rudder corrections from the pilot were required to maintain a headwind flight vector as there was limited directional stability.
5. Analysis of results from outdoor flight
testing
Specific, mechanical energy in this study represents the sum of potential and kinetic energy of the vehicle, as shown in equation (15). The aerodynamically useful
mechanical energy of flying vehicle (Es) is defined
as the mechanical energy to do work on the air and represents the sum of the vehicle’s potential energy relative to the Earth and its kinetic energy relative to the air [34] (see also end of section 3.1 for a detailed explanation).
Es= gz + V 2
2 .
(15) Both figures 20 and 22 show a significant gain in energy when FC (full auto mode with energy harvesting) is activated. The difference between the airspeed and groundspeed in flights presented suggests that strong winds were experienced, sometimes even up to 8 m s−1. The difference in the airspeed and angle of attack between two pitch probes was most of the time negligible (less than 5%), meaning that gusts had the same or bigger length scale as the wing. The last subplot in figure 20 indicates the energy state of the aircraft and also time periods when FC mode is activated (red lines on figures). The effectiveness of the regulator in charge of roll stabilization can be seen on the subplot related to roll angle in flight. Time periods with FC mode activated show very small levels of deviation in roll angle, as tuned PID regulator proved to be effective in roll disturbance rejection.
The flight shown in figure 21 illustrates a part of energy-harvesting mode for around 5 s. The control
system has reacted to the strong horizontal wind gradi-ent. The flight segment shows that increasing comp-onent of the horizontal wind velocity leads to growing deflection of the elevator which resulted in higher val-ues of angle of attack (pitch up and climb). The whole principle was in accordance with theoretical aspects of power maximization presented in section 3.1, as the aircraft was climbing within positive, horizon-tal wind gradient. The fact of significant energy gain confirms the effectiveness of such a controller, even in the case of a strong spatial gradient. This segment of flight belongs to overall flight shown in figure 20 and is the fourth-time FC mode is activated. The flight paths were mainly performed in form of half ellipses with a straight steady and level flight path until the activation of the controller for energy extraction system (ref to figure 19). The duration of FC mode was limited by a visual distance of the aircraft. Once the vehicle would tend to move away too far from pilot’s sight, FC mode was deactivated and aircraft was manually taken down to reasonable altitude and distance, from where the whole process was repeated. Another limitation is related to the height where gradient strength becomes weak or disappears. Strong wind gradients usually exist in proximity to the surface or obstacle endings and tend to lose their strength with increasing alti-tude. First flight shown on figure 20 was evidently in a presence of very strong wind gradient coming from
the north. Each time FC mode was activated, climb resulted in around 60 m of altitude. It can also be seen from the graph that all the energy extraction parts (FC mode activated) resulted with the similar energetic level at the end of FC mode.
The second flight shown in figure 22 brought dif-ferent energetic levels at the end of each segment of flight with FC mode turned on, as atmospheric condi-tions were varying significantly with time. This flight resulted intwo parts where FC mode was activated with significant energy gain, one with moderate gain and one with almost no gain. The reason why there was no gain in the third segment with FC mode on (third part in figure 22) is that the wind was uniform and constant in time and space with no significant gradients.
The last flight presented in this paper shown in fig-ure 23 consists of four segments with the energy extrac-tion mode activated. The first segment of flight exploited
strong gradients with a significant increase in energy state of the aircraft for around 60 s. The second segment has been enlarged and presented in figure 24. It reveals a notable rise in the energy state of the aircraft as long as the vehicle is experiencing strong gradients. At the end of the segment shown in figure 24 (marked with a circle), the estimated wind became uniform and energy stopped increasing. Furthermore, two remaining segments kept the energy state at a stable level with no significant ben-efits. This is to be expected because of the stochastic nature of the gusts. No two wind conditions encountered by the UAV are expected to be identical.
Finally, figure 25 illustrates the segment of flight for energy harvesting within negative vertical wind comp-onent (varying updraft). With decreasing magnitude of updraft we have a decreasing deflection of the eleva-tor and with an increasing component the controller tends to increase elevator deflection (increasing pitch).
Figure 22. Flight parameters of flight test 2.
Figure 23. Flight parameters of flight test 3.
This has a direct effect on the angle of attack as shown. The plot for the angle of attack given by two pitch probes reveals that no significant differences were experienced. This means that the aircraft experienced a gust with a length scale equal or above pitch probe separation. The tendency of the controller in real flight proved to be in accordance with flight simulations for wind power maximization through a sinusoidal wind field (see figure 6 for the tendency of an elevator and corresponding wind component). Although the nega-tive component of vertical wind (updraft) had a posi-tive contribution to the energy state of the aircraft itself (as explained in section 3.1) the separate contribution of the controller could not be evaluated.
6. Conclusion
The theoretical results presented in section 3 show that significant energy savings are possible with a simple control law based on a set of proportional gains. The flight simulations have proved that the energy-harvesting within sinusoidal wind profile brings remarkable savings in term of invested power. It was shown that energy extraction represents a preferred flight strategy when compared to all other flight scenarios. The research presented builds the required knowledge for implementing a simple proportional
controller for gust energy extraction of small aerial vehicles. It can be concluded from the experimental results that wind components can be effectively estimated and used for certain flight strategies. The presented experimental study proves the validity of developing a system, for estimation and exploitation of wind disturbances, which can, with a proper control law, raise the energy state of the aircraft.
A powerful, lightweight and low-cost autopilot system was designed and assembled as a part of this research. An instrumented UAV was equipped and test flown in order to demonstrate the feasibility of energy-harvesting from atmospheric phenomena. Moreover, an effective stabilization system for roll motions has been designed from wind tunnel experiments and implemented for flight tests. It can be concluded from the results that the presence of strong wind gradients can be successfully exploited by a small unmanned aerial vehicle. The stochastic nature of the problem, arising due to the randomness of the gusts, is evident from the variation in flight data. Clearly, the very sim-ple proportional control used in this experiment has certain limitations. Having in mind that the propor-tional control is optimal only for certain gust strength, the research opens a possibility for a new study related to the improvement of a control law, providing the opportunity to the vehicle to benefit optimally from
different gust scenarios. Also, some future work will imply usage of sensors capable for estimation of bat tery savings due to the gains in energy extraction flights.
Acknowledgments
The research was undertaken as a part of the RMIT Unmanned Aircraft Systems Research Team, within the Sir Lawrence Wackett Aerospace Research Centre, at RMIT University. The presented paper is a result of scientific collaboration between ISAE-Supaéro from Toulouse, France and RMIT University from Melbourne, Australia. The present work has been partly supported by the Agence Nationale pour la Recherche (ANR) under research grant LABCOM "MIDLELAB" and by the Région Occitanie under the research grant "E-Albatros".
T he authors are grateful for the scholarship sup ported by the University of Toulouse and Doctoral School of Aeronautics and Astronautics (EDAA) from ISAE-Supaéro. Also, enormous gratitude goes to RMIT UAS research team for providing necessary equipment and facilities for the tests.
ORCIDiDs
N Gavrilovic (!) https://orcid.org/0000-0002-2004- 7282 A Mohamed G https://orcid.org/0000-0002-9592- 1034 M Marino Cl!) https://orcid.org/0000-0001-7720-5029 J-M Moschetta G https://orcid.org/0000-0001-6585-2333 E Benard (!) https://orcid.org/0000-0002-7991-6913Referenœs
[ l) Videler J J 2005 Avian Flight (New York: Oxford University Press) pp 46-50
[ 2) Scott C and McFarland C 2010 Bird Feathe,-a Guide to North
Arnerican Species (Mechanicsburg: Stackpole Books) pp 13-41
[ 3) Pennycuick C 2008 Modelling the Flying Birds (Amsterdam: Academic) pp 296-305
[ 4) Brown R and Fedde R 1993Airflow sensors in the avian wingJ. Exp. Bio/. 179 13-30
(5) MohamedA, Watkins S,Clothier R and Abdulrahim M 2014 Influence ofTurubulence on MAV roll perturbations Int J. Micro Air Veh. 6 175-90
[ 6) Mohamed A, Watkins S, Fisher A, Marino M, Massey K and Clothier R 2015 Bioinspired wing-surface pressure sensing for attitude control of micro air vehicles J. Airer.
52 827-38
(7) MohamedA, Watkins S, Clothier R,Abdulrahim M, Massey K and Sabatini R 2014 Fixed-wing MAV attitudestability in atmospheric turbulence, part 2: investigating bio-inspired sensors Prog. Aerosp. Sei. 711-13
[ 8) Poksawat P, Wang Land Mohamed A 2017 Gain scheduled attitude control of fixed-wing UAV with auto control tunning
IEEE Trans. Contro/Syst. Technol. pp 1192-203
[9) MohamedA,Abdulrahim M, Watkins S and Clothier R 2015 Development and flight testing of a turbulence
mitigation system for micro air vehicles J. Field Robot. 33639-60
[ 1 o) Abdulrahim M, Mohamed A and Watkins S 2017 Control strategies for flight in extreme turbulenceAIAAAtmosperic
FlightMechanicsConf (Texas)
[ 11) Gigacz R, MohamedA, Poksawat P, Panta A and Watkins S 2018 Exploring tandem wing UAS designs for operation in turbulent environments Int J. Micro Air Veh. 10 254-61
(12) Gavrilovic N,Bronz M,Moschetta J-M and BenardE 2018 Bioinspired wind field estimation-part l:AoA measurements through surface pressure distribution Int J. Micro Air Veh.
10 273-84
[ 13) Elbanhawi M, Mohamed A, Clothier R, Palmer J L,Simic M and Watkins S 2017 Enabling technologies for autonomous MAV operations Prog. Aerosp. Sei. 91 27-52
(14) MacCreadyP 1958 Optimum airspeedselector Soaring 10-1 [ 15) Makovin D and Langelaan J 2014 Optimal persistant
surveillance using coodrinated soaring AIAA Guidance, Navigation and Contrai Conf. 2014 0261
[ 16) Gudmundsson S, GolubevV, Drakunov S and Reinholtz C 2016 Biomimemic opportunistic approaches in energy conserving/harnssing flight-path modeling for UAS AIAA
Modeling and Simulation Technologies Conf. (Washington, DC)
[ 17) Gudmundsson S, GolubevV, Drakunov S and Reinholtz C 2017 A biomimetic energy-conserving/harvesting trajectory planning for a sUAV AIAAAtmospheric FlightMechanics Conf (D enver,CO)
[ 18) Zhao J 2004 Optimal patterns of glider dynamic soaring
Optim. Contrai AppL Meth. 25 67-89
[ 19) Bonnin V, BenardE, Toomer C andJean-Marc M 2015 Energy harvesting mechanism for UAV flight by dynamic soaringlnt. J. Micro Air Veh. 7 213-29
(20) Liu D-N,Hou Z-X, Guo Z, YangX-XandGaoX-Z 2017 Bio-inspired energy-harvesting mechanism and patterns of dynamic soaring Bioinspir. Biontim. 12 1-21
[ 21) Fisher A, Mohamed A, Elbenhawi M, Clothier R, Watkins S, Carrese R, Simic M, Abdulrahim M and Palmer J 2016 Micro air vehicle soaring in urban environmentsAustralian Contrai Conf (Newcastle,Australia) pp 9-14
[ 22) Watkins S, MohamedA, Fisher A, Clothier R, Carrese R and Fletcher D 2015 Towards autonomous MAV soaring in cities:
CFD simulation, EFD measurement and flight trials' !nt. J.
Micro Air Veh. 7 441-8
[ 23) MohamedA, Carrese R, Fletcher D F and Watkins S 2015 Scale resolving simulations to predict the updraught regions over buildings for MAV orographie lift soaringJ. Wind E ng. Ind.
Aerodyn. 140 34-48
(24) Depenbusch N,BirdJ andLangelaanJ 2017 TheAutoSOAR autonomous soaring aircraft part 2: hardware implementation and flight results J. Field Robot 35 435-58
[ 25) Langelaan J 2011 A gust controller for small uninhabited gliders Tech. Soaring 35 48-60
[ 26) Langelaan J 2009 Gust energy extraction for mini and micro uninhabited aerial vehicles/. Guid. Contrai Dyri 32 463-72 (27) Depenbusch N and Langelaan J 201 O Receding horizon control
for atmospheric energy harvesting by small UAVsAIAA Guidance, Navigation and Contrai Conf 2010 8180 (28) Patel C K and Kroo I 2008 Theoretical and experimental
investigation of energy extraction from atmospheric turbulence 26th !nt Congress of theAeronautical Sciences (Anchorage,Alaska, USA)
(29) Phillips J H 1975 Propulsive effects due to flight through turbulence/. Airer. 12 624-6
[ 30) Gavrilovic N, Benard E, Pastor P and Moschetta J-M 2018 Performance improvement of small unmanned aerial vehicles
through gustenergyextractionAIAAJ.Aircr. 55 741-54 [ 31) Lawrance N and Sukkarieh S 2009 Wind energy based path
planning for a small gliding unmanned aerial vehicle AIAA
Guidance, Navigation and Contrai Conf (Chicago, I llinois)
[ 32) Rasuo B 2014 Flight mechanicsFaculty of Mechanical Engineering, University of Belgrade, Belgrade, Serbia pp 40-89 (in Serbian)
[33] Rasuo B 2007 Some analythical and numerical solutions for the safe turn manoeuvres of agricultural aircraft—an overview
Aeronaut. J. 111 593–9
[34] Rayleigh L 1883 The soaring of birds Nature 28 534–5
[35] Taylor K G, Reynolds V K and Thomas L R A 2016 Soaring energetics and glide performance in a moving atmosphere
Phil. Trans. R. Soc. B 371 1–14
[36] Bronz M 2012 A contribution to the design of long endurance mini unmanned aerial vehicles PhD Thesis ISAE, Supaero, Toulouse
[37] Kaimal C and Finnigan J 1994 Atmospheric Boundary Layer
Flows, their Structure and Measurements (New York: Oxford
University Press) pp 32–63
[38] Fortuniak K and Pawlak W 2015 Selected spectral characteristics of turbulence over an urbanized area in the Centre of Lodz, Poland Bound. Layer Meteorol. 154 137–56
[39] Mohamed A, Clothier R, Watkins S, Sabatini R and Abdulrahim M 2014 Fixed-wing MAV attitude stability in atmospheric turbulence, part 1: suitability of conventional sensors Prog. Aerosp. Sci. 70 69–82
[40] Chue S H 1975 Pressure probes for fluid measurements Prog.
Aerosp. Sci. 16 147–223
[41] Taylor G I 1938 The spectrum of turbulence Proc. R. Soc. A 164 476–90
[42] Allen J M and Lin V 2007 Guidance and control of an autonomous soaring vehicle with flight test results 45th AIAA
Aerospace Sciences Meeting and Exhibit (Reno, Nevada)
[43] Chen J, Haynes B and Fletcher D 2000 Cobra probe
measurements of mean velocities, Reynolds stresses and higher order velocity correlations in pipe flow Exp. Therm. Fluid Sci. 24 206–17
[44] Watkins S, Milbank J, Loxton B and Melbourne W 2006 Atmospheric winds and their effects on micro air vehicles