HAL Id: hal-01611465
https://hal.archives-ouvertes.fr/hal-01611465
Submitted on 4 Mar 2021
HAL is a multi-disciplinary open access
archive for the deposit and dissemination of
sci-entific research documents, whether they are
pub-lished or not. The documents may come from
teaching and research institutions in France or
abroad, or from public or private research centers.
L’archive ouverte pluridisciplinaire HAL, est
destinée au dépôt et à la diffusion de documents
scientifiques de niveau recherche, publiés ou non,
émanant des établissements d’enseignement et de
recherche français ou étrangers, des laboratoires
publics ou privés.
Automatic Generation of the Dental Scheme based on
2D radiographs
Pierre Michel, Valentin Prezelin, Pauline Blery, Yves Amouriq, Jeanpierre
Guédon, Florent Autrusseau
To cite this version:
Pierre Michel, Valentin Prezelin, Pauline Blery, Yves Amouriq, Jeanpierre Guédon, et al.. Automatic
Generation of the Dental Scheme based on 2D radiographs. SPIE Medical Imaging, Feb 2018, Houston,
TX, United States. �10.1117/12.2287117�. �hal-01611465�
Automatic Generation of the Dental Scheme based on 2D
radiographs
Pierre Michel
a, Valentin Prezelin
a, Pauline Bl´
ery
b, Yves Amouriq
b, Jeanpierre Gu´
edon
c, and
Florent Autrusseau
ba
Ecole Polytechnique de l’Universit´
e de Nantes, rue Ch. Pauc, La Chantrerie, 44306, Nantes
France
a
INSERM U1229-RMeS, Laboratory of Regenerative Medicine and Skeleton, University of
Nantes, UFR Odontologie, 1, place Alexis Ricordeau, 44042, Nantes, France
b
Ecole Polytechnique de l’Universit´
e de Nantes, LS2N, rue Ch. Pauc, La Chantrerie, 44306,
Nantes France
ABSTRACT
For every patient, nowadays, dentists use a software to generate the dental scheme. The dental scheme is basically a diagram representing the whole dentition of the patient. On this diagram, each tooth is represented along with the various operations the patient underwent. The dental scheme for instance shows whether some teeth are missing, or if any treatment was ever performed on the dental roots, it also represents the dental fillings, removable prosthesis, dental crowns or tooth bridges. Filling up the dental scheme may be tedious for dentists, as for every new patient, they would have to carefully make an inventory of every dental care the patient underwent. In this work, we intend to study the feasibility of automatically generating the dental scheme from radiographs. Indeed, we aim to propose an image processing method that would automatically detect missing teeth, as well as any dental care in the dentition, this may save a significant amount of time during the dental consultation. In a first step, our method extracts the relevant portion of the scanner image, i.e. we automatically crop the dentition and thus remove the jaws and chin. The bending of the jaw (dentition curvature) is also estimated, and allows to distinguish the upper and lower jaws. A local minimum/maximum computation coupled with the Hough transform, and a fit with Gaussian Mixture Models helps us to segment the teeth despite strong luminance irregularities due to the imaged spine.
Keywords: Dental scans, radiographs, image segmentation, watershed, level sets.
1. DESCRIPTION OF PURPOSE
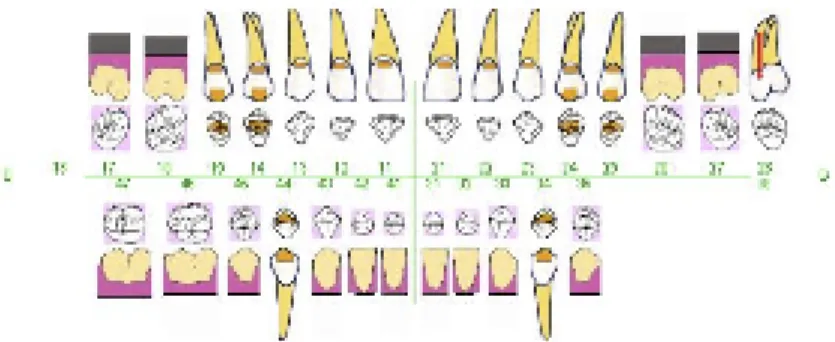
The aim of the dental scheme, as represented in Fig. 1, is to represent in a single diagram the various treatments within the patient’s dentition. Every dentist has at his disposal a software that can generate the dental scheme, such a diagram is useful for the dentist to anticipate the future care, but it is also used for postmortem identi-fication.1 Indeed, for some particular deaths, the corpse may only be identified by its dentition. In France, for
such a scenario, the coroner generates the dental scheme as observed on the corpse and publishes this scheme on a dentistry magazine being distributed to all the dentists of the region where the dead body was found.
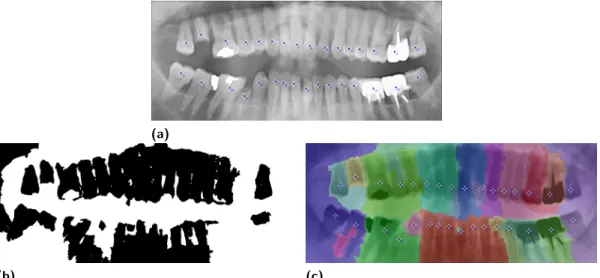
Most dentists have at their disposal either the x-ray scanner for intra oral (bitewing) radiography, or even for panoramic radiograph. In order to acquire the bitewing radiographic image, one needs to place a thin film inside the patients’ mouth before the x-ray acquisition. Such technique basically targets a few teeth and is mainly used to detect dental caries. The scanner used for panoramic radiographs circles around the patient’s head, and captures the whole dentition within one single flattened image. Both types of radiographs are shown in Fig. 2.
Many image processing methods have been proposed in order to characterize and describe the human den-tition. However, most of the works have focused on caries detection.2,3 In,2 a color-based segmentation was
Further author information: (Send correspondence to F.A.)
Figure 1: An example of dental scheme, exhibiting any treatment on a patient’s dentition. Each color or symbol represents a particular care.
(a) (b)
Figure 2: (a)intra oral / bitewing radiograph, and(b)panoramic radiograph.
used to detect the caries on already extracted teeth (one single tooth was used for the segmentation), whereas in other works,3 the Otsu segmentation is employed after a contrast enhancement step, and a k-means clustering
method for the caries detection. Both of these methods operates directly on photographs and not radiographs. In a study on edge detection techniques,4 several methods were analyzed, the goal here was to find the best edge
detection that may help to detect discontinuities in dental radiographs compared to a healthy tooth. Besides the numerous methods that try to detect tooth decay, or to optimize teeth segmentation, a project5,6was devoted to
the study of caries diagnosis, bone density diagnosis and lesion/bone defect diagnosis was studied. In this work, two types of lesions are searched for, closed boundary lesions and bone deformation. In,7 the goal was to detect areas of lesions from periapical dental X-rays using level sets and an SVM classifier. This method appears to perform quite well, but the goal is limited to the detection of lesions in a broad sense. It is not suited to detect missing teeth or to differentiate between certain special cares such as a dental crown or a bridge. One project was specifically designed for postmortem identification,1 in this work, the authors mainly focused on the teeth
segmentation issue. When dealing only with periapical radiographs, the authors benefit from higher contrast, and a reduced noise within the images.8 A different approach9 uses a viewing angle of the CT parallel to the
teeth roots, whereas in our work, the panoramic X-ray image is acquired in front of the patient. In some other works,10 the objective was to correctly segment wisdom teeth, these latter being positioned at the very end of
the dentition, in the back of the jaws, the artifacts generated by the spine (as explained later in this paper) has little impact on the molars and wisdom teeth, thus simplifying the segmentation.
In this project, we aim to not only detect the teeth (or more precisely the absence of teeth), but we also want to be able to locate tooth decay, dental fillings, as well as crowns/bridges or even root treatments or dental implant. In the end, sufficient information should be collected from the panoramic or intra-oral radiographs to be able to generate a dental scheme. This paper is organized as follows: In section2, we present the data-set we have at our disposal, as well as some preliminary tests that have been conducted with State of the Art methods. We show that some well-known algorithms for image segmentation fail on some particular panoramic radiographs. We then briefly introduce the proposed method. In Section3, we give some more detailed explanations on the various processes the images go through, and we provide some results. We finally conclude this work in section
2. METHODS
We have at our disposal 72 bitewing radiographic images and 34 panoramic radiographs. The central line which separates the upper and lower parts of the dentition is searched for, the full panoramic radiograph goes through a binarization step. A discrete Radon-like projection with an orientation angle 0◦ (across the image rows) is computed, and we average every bin, a sudden decrease in the projection bins represent the dark space between the upper and lower teeth.
Commonly, two neighboring teeth may overlap when the panoramic image is flattened, indeed, the panoramic image basically shows a sort of flattened projection of the dentition, so depending on the curvature of the jaw, some teeth may exhibit an overlap, especially the teeth in the back of the dentition, whereas for the front teeth a small spacing may occur between two neighboring teeth.
(a)
(b) (c)
Figure 3: For 32 manually determined markers (top panel), we show the output of the Level Sets method (left panel) as well as the results for the watershed method (right panel).
Knowing the problem we encounter, we might expect that most of the tools we have at hand would be able to easily and accurately segment the teeth. We have thus tested a few of the State-of-the-Art methods, such as the Level-Sets11 or the Watershed.12,13 As can be seen on Figure 3, neither the Level-Sets, and nor the Watershed are able to correctly segment the teeth, despite a rigorous positioning of the initial markers.
We can notice that when testing the Level Sets method (bottom left panel in Fig. 3), the spreading from the seed (marker) using a fast marching algorithm, often merges with neighboring areas, and the segmentation of two (or more) consecutive teeth can merge into one single area. A similar behavior can be observed when using the watershed algorithm (bottom right panel in Fig. 3). It should be noted here that an inversion of the pixels’ brightness was necessary prior to run the watershed method, indeed, the teeth should be seen as valleys (darker areas within the image) for the watershed method to properly work.
The Active Contours14,15 have been tested on 34 panoramic radiographs, when a radiopaque material is
present within the radiograph (as can be seen in Figure4(a)), it may induce a strong bias on the acquired image, and thus the segmentation is altered (Figure 4(b)). A sudden brightness increase is regularly observed on the radiographs and is caused by the imaging of the cervical vertebrae. Such a local enhancement has a strong influence on most of the tested radiographs, the Active Contours fail to properly segment the teeth located in the center of the lower jaw (cf. Figures4(c) and4(d)). Figure 4(f)shows the best results we could observe on the 34 tested images. However, as we can see, most of the teeth are not clearly separated from their neighbors. The segmentation often groups several consecutive teeth together.
In view of the poor results offered by these widely accepted methods, we then opted for a simplified technique that will basically look for the gap between the teeth, while exploring the image into one dimension.
(a) (b)
(c) (d)
(e) (f)
Figure 4: Active Contours (snakes) for three input radiographs
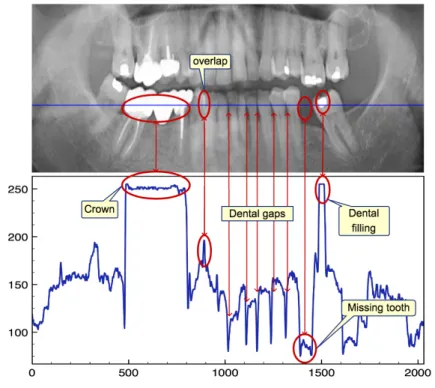
Based on the assumption that two consecutive teeth will present a gap (at least near the root), we have decided to run a local maximum / minimum algorithm on every single line of the 2D scan. Each 1D row vector is isolated, and the local minima are highlighted. This allows to determine the average width (and height) of the teeth. The main idea is represented on Figure5, where we show for a given panoramic radiograph the 1D profile of one row. We furthermore highlight the various features one might encounter on the 1D profile, and link these 1D features to the actual phenomenon occurring within the image.
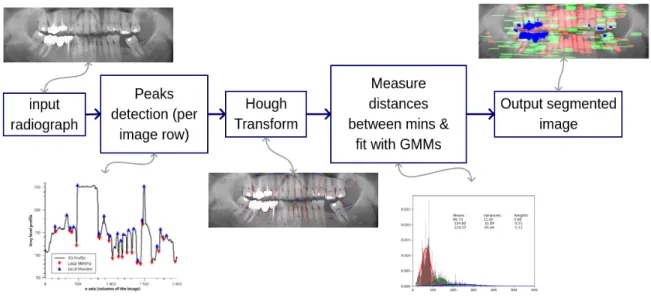
Figure 6: Block diagram representing the various steps the images go through.
Once the local minima algorithm launched both horizontally, and vertically on the image, we can detect the spacings between teeth, as well as the overlapping that may occur. Of course, we encounter some false detections. Effectively, the radiographs can be quite noisy, and the noise may generate local bumps or hollows. A Gaussian blur with a kernel size of 11 is used to smooth the image prior to detect the minima. Next to the local minima/maxima detection, the Hough transform16 is used to fit the gaps/overlaps between the teeth.
Figure9shows for one radiograph the Hough line segments detected on both the horizontal and vertical profiles. We then collect all the horizontal distances between the minima. Such distances supposedly represent the teeth width. These distances should then be roughly distributed along a couple of ranges, the front teeth (incisors and canines) should be grouped within one width range, and the back teeth (premolars and molars) should be grouped in another (bigger) range. A Gaussian Mixture Model is then used in order to fit the distributions of spacings (between the assumed gaps). Such method allows to reduce the false positives one might encounter. Most of the local minima being incorrectly detected due to the background noise, would thus not be considered as they are being isolated and do not follow a repetitive pattern. The whole process is summarized in the block diagram represented in Figure6.
Besides the separation of the teeth along one jaw, it is necessary to separate the two jaws.
(a)
(b) (c) (d)
Figure 7: (a)Separation between the maxilla (upper jaw) and mandible (lower jaw) based on local minimas along the columns. (b)to(d), 3 different estimations of the dentition’s curvature.
Figure 7 shows how it is possible to detect local minimas along the columns in order to seek for the gap between the upper and lower jaws (resp. maxilla and mandible). On Fig. 7(a)we display the local minima along the image columns with red dots. The area of interest is restricted to the image vertical center region. Once these spots located a simple equation fitting can help us to separate via a curve the upper and lower part of the dentition. This fitting curve is represented with the blue lines in Figures7(b)to 7(d).
3. RESULTS
One of our objectives in this work is to efficiently tackle the problem caused by the spreading of the spine radiopacity, and it’s effect on the teeth segmentation.
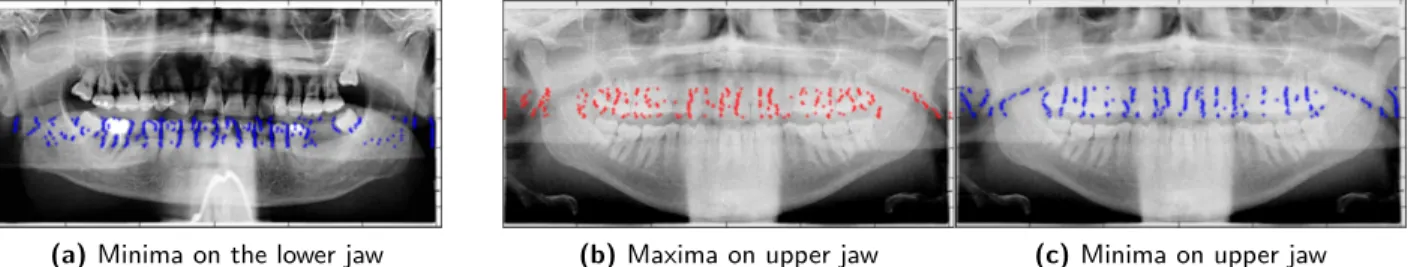
(a) Minima on the lower jaw (b) Maxima on upper jaw (c) Minima on upper jaw
Figure 8: Minima/Maxima for every line profile of the image. Detection of local minima in the lower jaw dentition only (a), detection of local maxima(b)and local minima(c)in the upper jaw.
Effectively, as can be seen in the Figure 8, during the x-ray acquisition, the spine (or more precisely, the cervical vertebrae) generates a column-like artifact behind the chin and the lower jaw. The spreading of this radiopaque column depends on the acquisition method and parameters. This phenomenon can even be aggravated when the patient wears a necklace (as can be observed on Fig. 8(a)).
Figure8thus shows the local minima and maxima on a given radiograph. These localized low/high intensity spots can be merged and fitted into oriented segments. The Hough transform is then used to generate these segments, as can be observed in Figure9. Globally, the local minima can detect quite accurately the gaps between the teeth. As compared with the tests performed on both the Level Sets and the Watershed (Fig. 3), one can notice that the teeth separation seems to be more efficient here. It can be seen that the artifacts generated by the spine (bright beam behind the chin and lower jaw) has no impact on the detection of these local minima, which by definition relates to their neighborhood.
Figure 9: Local minima along the horizontal (blue) and vertical (red) profiles. The Hough transform was used to fit and draw line segments.
All the distances between the local minima are collected, Figure 10(a)represents all the inter-minima dis-tances, along with their histogram (represented vertically on the right panel). As the histogram seems to exhibit distinct distributions, we used a Gaussian Mixture Model to fit the various distances distributions into three subpopulations. An example is given in Figure10(b). The whole distribution of distances has been fitted onto three distinct Gaussian functions. The objective here is to distinguish various teeth widths. For each fitted
Gaussian function, we collect all distances located in the interval [µ − σ, µ + σ], represented by the colored areas under the curves.
(a) Distances between minima (b) Distribution of the distances
Figure 10: (a)All the distances between the local minima are represented, and(b), distribution of the inter-gaps distances, along with three Gaussian Mixture Model fits, and highlighted area at +/- σ
All the image pixels belonging to the highlighted areas in Figure 10 have been colored and are shown in Fig. 11. On Figure11, the portions of the image segmented in red represents the smallest inter-teeth distance, whereas the portion of the image displayed in green represents the bigger inter-teeth distances. In these images, we have colored in blue the high intensity portions of the image, using a simple thresholding. Depending on their area, these blue regions may represent a dental filling, a crown, or a bridge (in ascending order of their area).
We can observe that the spine artifacts do not influence much the segmentation, and both the top and bottom teeth appear to be correctly detected. As expected, the incisors and canines mostly belong to the first GMM (on Figure10), whereas the premolars and molars mostly belong to the second GMM. We deliberately decided to split the distances distribution into three different clusters (GMMs), knowing that the third cluster (highest inter-minima distances) might contain mostly some false positives detections. We can notice the sparsity of the data being fitted by the blue curve on Figure10(b), but the rationale behind this was to group the false positives within one separate cluster while optimizing the fit for the two other clusters. Although we can observe that the proposed method is able to distinguish small gaps between the teeth despite a non uniform background, and despite different average luminance images, some further processes are necessary to better clean up the false positives.
Figure11 shows the outputs we obtain for 5 images out of the 34 radiographs we have at our disposal. We can observe that no matter what kind of artifacts we encounter, such as the cerebral vertebrae in Figs11(e)and
11(i), a low contrast image in Fig. 11(g), or even the radiopaque material wire in11(c), the segmentation based on local minimas seem to properly detect the teeth. Obviously, some false detection occur on these images. These may be removed with a post-processing step that could detect the location of each segmented area, and discard every area exhibiting a discrepancy with the remaining (different average gray level, different (x,y) positions,...).
(a) (b)
(c) (d)
(e) (f)
(g) (h)
(i) (j)
Figure 11: Most teeth are detected by either the first or second GMM, incisors/canines and premolars/molars can be predominantly detected by a particular GMM (Figs. 11(a)and11(b))
4. CONCLUSION
In this work, we show some preliminary results that suggest it is possible to generate the dental scheme based on panoramic radiographs. Our initial experiments showed that the watershed segmentation and the Level Set method seemed unable to efficiently detect the teeth in the panoramic radiograph. The spine, which is running in the back of the radiograph, causes a sudden increase in the image Grey levels, this tube-like distortion makes the segmentation quite difficult with common image processing techniques. Moreover, depending on the acquisition device, and the parameters used on the radiography machine, the average image luminance can significantly vary from one image to another. Such luminance differences are quite difficult to cope with for most State Of the Art methods. However, we showed here that local minima/maxima can be used for the teeth area detection, and the spine artifacts problem seems to be avoided. The Euclidean distances between the local minima/maxima (horizontal/vertical distances) are collected and grouped in several clusters using Gaussian Mixture Models.
REFERENCES
[1] Said, E., Nassar, D., Fahmy, G., and Ammar, H., “Teeth segmentation in digitized dental x-ray films using mathematical morphology,” IEEE Tran. on Information Forensics and Security 1, 178–189 (2006).
[2] Olsen, G. F., Brilliant, S. S., Primeaux, D., and Najarian, K., “An image-processing enabled dental caries detection system,” in [2009 ICME International Conference on Complex Medical Engineering, CME 2009 ], 1–8 (2009).
[3] Koutsouri, G., Berdouses, E., Tripoliti, E. E., Oulis, C., and Fotiadis, D. I., “Detection of occlusal caries based on digital image processing,” in [13th IEEE International Conference on Bioinformatics and Bioengi-neering (BIBE) ], (2013).
[4] Lakhani, K., Minocha, B., and Gugnani, N., “Analyzing edge detection techniques for feature extraction in dental radiographs,” Elsevier, Perspectives in Science 8, 395398 (2016).
[5] Galib, S., Islam, F., Abir, M., and Lee, H., “Computer aided detection of oral lesions on ct images,” IOP Publishing Ltd and Sissa Medialab srl, Journal of Instrumentation 10 (2015).
[6] Galib, S. M., Computer aided detection of oral lesions on CT images, Master’s thesis, Missouri University iof Science and Technology, USA (2015).
[7] Li, S., Fevens, T., Krzyzak, A., Jin, C., and Li, S., “Semi-automatic computer aided lesion detection in dental x-rays using variational level set,” Elsevier, Pattern Recognition 40, 2861–2873 (2007).
[8] Lin, P. L., Huang, P. Y., Huang, P. W., Hsu, H. C., and Chen, C. C., “Teeth segmentation of dental periapical radiographs based on local singularity analysis,” Computer Methods and Programs in Biomedicine 113(2), 433–445 (2014).
[9] Gao, H. and Chae, O., “Individual tooth segmentation from CT images using level set method with shape and intensity prior,” Pattern Recognition 43(7), 2406–2417 (2010).
[10] Amer, Y. Y. and Aqel, M. J., “An Efficient Segmentation Algorithm for Panoramic Dental Images,” Procedia Computer Science 65(Iccmit), 718–725 (2015).
[11] Sethian, J. A., [Level Set Methods and Fast Marching Methods : Evolving Interfaces in Computational Geometry, Fluid Mechanics, Computer Vision, and Materials Science ], Cambridge University Press. (1999). [12] Vincent, L. and Soille, P., “Watersheds in digital spaces: an efficient algorithm based on immersion
simu-lations,” IEEE Trans. on Pattern Analysis and Machine Intelligence 13(6) (1991).
[13] Najman, L. and Schmitt, M., “Geodesic saliency of watershed contours and hierarchical segmentation,” IEEE Transactions on Pattern Analysis and Machine Intelligence 18(12) (1996).
[14] Chan, T. F. and Vese, L. a., “Active contours without edges,” IEEE Transactions on Image Processing 10(2), 266–277 (2001).
[15] Getreuer, P., “Chan-Vese Segmentation,” Image Processing On Line 2, 214–224 (2012).
[16] Duda, R. O. and Hart, P. E., “Use of the hough transformation to detect lines and curves in pictures,” Comm. ACM 15, 11–15 (1972).