ORIGINAL RESEARCH
Hemodynamic and affective correlates assessed
during performance on the Columbia Card Task (CCT)
Lisa Holper&Ryan O. MurphyPublished online: 17 November 2013
# Springer Science+Business Media New York 2013
Abstract The study aimed to test the potential of functional near-infrared spectroscopy (fNIRS) in combination with elec-trodermal activity (EDA) in a decision paradigm by means of the Columbia Card Task (CCT). The CCT is a dynamic decision task characterized by assessing subjects’ risk-taking via eliciting voluntary stopping points in a series of incremen-tally increasingly risky choices. Using the combined fNIRS-EDA approach, we aim to examine the hemodynamic and affective correlates of both decision and outcome responses during performance on the CCT. Twenty healthy subjects completed the Cold and Hot CCT version while fNIRS over prefrontal cortex and EDA were recorded. Results showed that (1) in the decision phase fNIRS revealed larger total hemo-globin concentration changes [tHb] in the Cold as compared to the Hot CCT, whereas EDA revealed an opposite pattern with larger skin conductance responses (SCRs) to the Hot as compared to the Cold CCT. (2) No significant [tHb] signals or SCRs were found in the outcome phase. (3) Coherence cal-culations between fNIRS and EDA in the heart rate frequency showed a significant increase during the Hot as compared to the Cold CCT. Our findings designate fNIRS as suitable tool for monitoring decision-making processes. The combination of fNIRS and EDA demonstrates the potential of simulta-neously assessing the interaction between hemodynamic and affective responses which can provide additional information
concerning the relationship between these two physiological systems for various research areas.
Keywords Decision-making . Risk-taking . Affective system . Coherence analysis
Introduction
The present study aimed to assess the hemodynamic correlates underlying performance on the Columbia Card Task (CCT) using functional near-infrared spectroscopy (fNIRS). fNIRS is a non-invasive optical brain imaging technique based on neurovascular coupling, which exploits the relationship be-tween metabolic activity due to neural processing and hemo-globin oxygenation in blood flow. Utilizing this tight cou-pling, fNIRS measures regional hemodynamic changes asso-ciated with cortical activation (Villringer and Dirnagl1995). fNIRS has so far not been widely used in DM research. Two previous studies applied fNIRS monitoring performance on the BART (Cazzell et al.2012) and IGT (Suhr and Hammers
2010). Cazzell et al. (Cazzell et al. 2012) reported strong prefrontal cortex (PFC) activation in response to both wins and losses as well as greater bilateral activation in dorsal lateral prefrontal cortex (DLPFC) in females in response to losses as compared to males. Suhr and Hammers (Suhr and Hammers 2010) showed that subjects who failed the IGT elicited less bilateral PFC oxygenation, relative to those who passed. However, this study did not differentiate between the typical IGT parameters (i.e. rewards, punishments etc.), but reported cortical signals obtained over the whole task period. Previous research on the Columbia Card Task (CCT) The Columbia Card Task (CCT) is a relatively new dynamic risky decision-making (DM) task introduced by Figner et al. L. Holper (*)
Biomedical Optics Research Laboratory (BORL), Division of Neonatology, University Hospital Zurich, Frauenklinikstrasse 10, 8091 Zurich, Switzerland
e-mail: [email protected] L. Holper
:
R. O. MurphyChair of Decision Theory and Behavioral Game Theory, Department of Humanities, Social and Political Sciences, ETH Zurich, Clausiusstrasse 50, 8092 Zurich, Switzerland
(Figner et al.2009). The CCT is similar to both the Devil’s
Task (Slovic1966) and the Angling Risk Task (Pleskac2008) in its dynamic nature. In all three tasks, the dynamic nature is characterized by assessing subjects’ risk-taking in a multi-stage setting via eliciting voluntary stopping points in a series of incrementally increasingly risky choices. Compared to these dynamic and other non-dynamic risk-taking tasks, such as the Balloon Analogue Risk Task (Lejuez et al.2002), the Iowa Gambling Task (IGT) (Bechara et al. 1994), the Cambridge Gambling Task (CGT) (Rogers et al.1999), the Cups Task (Levin and Hart2003) or the Game of Dice Task (GDT) (Brand et al.2005) the CCT is diagnostically more distinguished in two important ways as summarized by Figner et al. (Figner et al.2009). First, in addition to assessing risk-taking level, the CCT assesses the complexity of the decision-maker’s information-use and determines which of three fac-tors that (optimally) should be affecting risk-taking have been taken into account, i.e. gain amount, loss amount and loss probability. Second, the options presented by the CCT are tapping into different processes, i.e. decision quality relies both on deliberative and affective processes. In particular, the task exists in two versions that differentially trigger DM processes, i.e. as stated by Figner et al. (Figner et al.2009) a relatively affect-charged‘Hot’ version, which triggers more affective DM with increased risk taking, and a more deliber-ative ‘Cold’ version, which triggers more deliberative DM with lower risk taking. In both versions, subjects turn over cards from a deck consisting of a known number of gain and loss cards. Gain and loss amounts and the probability to win or lose vary between trials and can influence subjects’ risk-taking. Previous behavioral studies have successfully assessed CCT performance in both adolescents and adults (Falk and Richardssonunpublished; Panno et al.2013; Penolazzi et al.
2012) and have shown that it is a favorable measure as risk-taking can be differentiated from information-seeking. In the first study on the CCT, Figner et al. (Figner et al. 2009) measured EDA and reported significant skin conductance response (SCRs) between the Hot and Cold CCT version, with the Hot CCT eliciting a significant increase from baseline as compared to the Cold CCT. These results supported the differential involvement of affective versus deliberative pro-cesses in the two versions of the CCT.
Aims of the present study
The present study aimed to extend previous findings by com-bining fNIRS with electrodermal activity (EDA), a well-established method in decision-making research, which pro-vides a physiological measure of affective reactivity (Figner and Murphy2010). In particular, by measuring fNIRS and EDA simultaneously we aimed to quantify both the hemody-namic and affective correlates during performance on the CCT. While fNIRS signals over prefrontal cortex (PFC)
would represent the more deliberative aspect of human deci-sion performance (Bechara et al.2000a; Fellows2007), EDA derived SCRs would represent the affective aspect of decision performance controlled through the sympathetic branch of the autonomic nervous system (ANS) (Boucsein1992). We hy-pothesized that fNIRS and EDA would show a differential pattern. Particularly, we hypothesized (1) that fNIRS would show smaller responses during the Hot as compared to the Cold CCT due to the experience of potential higher risk taking, and (2) that EDA would reveal larger responses during the Hot as compared to the Cold CCT due to the greater arousal state related to risk- and loss aversion. The underlying theories of our hypotheses are discussed in detail in “Discussion”.
To put this in a recently discussed context, we refer to Kahneman (Kahneman 2003) who used their dual-system theory to describe the distinction between intuition (system 1; i.e. the Hot CCT version) and reasoning (system 2; i.e. the Cold CCT version). While the operations of system 1 are fast, automatic, effortless, associative, and difficult to control or modify, the operations of system 2 are slower, serial, effortful, and deliberately controlled. With this frame, we hypothesized that the two complementary techniques for measuring system 1 (via EDA), and also measuring system 2 (via fNIRS), would allow us to reveal an additional layer of information concerning the relationship between the underlying two phys-iological systems.
Materials and methods Subjects
Twenty healthy subjects were included (eight females, mean age (± STD) 31.4±5.4). All subjects were right-handed (mean laterality quotient (LQ±STD)=77.5±16.4) according to the Edinburgh Handedness Inventory (Oldfield1971). Exclusion criteria were any history of visual, neurological or psychiatric disorder or any current medication. All subjects had normal or corrected-to-normal vision. All subjects gave written in-formed consent. All experiments had ethics approval and were reviewed by the Institutional Boards of the University. The study was in accordance with the latest version of the Declaration of Helsinki.
Experimental protocol
Each subject completed three conditions: the Hot CCT version; the Cold CCT version; and a baseline recording. The order of conditions was counter-balanced between subjects. We used a short version of the original CCT (Figner and Weber 2011) (Official CCT Webpage: http://columbiacardtask.org/columbia-card-task.php?h). Prior to the experiment, subjects were given
instructions on both versions of the CCT and were presented with a few practice trials to get familiar with screen instructions.
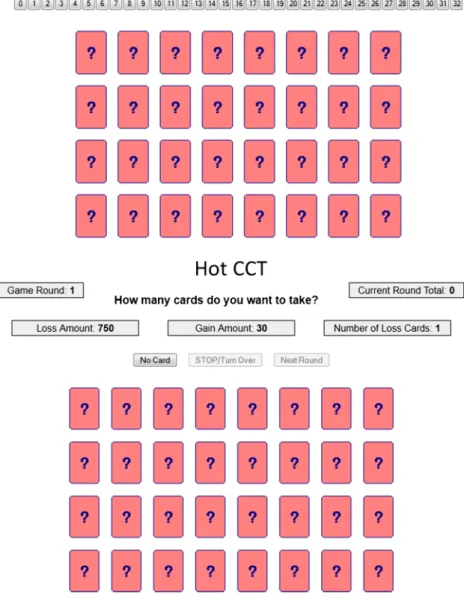
Hot CCT In the Hot version of the CCT (Fig.1) subjects were instructed to maximize a total score by deciding how many cards to select out of a total of 32 face-down cards. Each round (i.e. trial=24) contained gain cards and loss cards. Subjects could base their decisions on three factors that systematically changed across trials: the‘Gain Amount’ of the gain cards (i.e. 10 versus 30), the‘Loss Amount’ of the loss cards (i.e. 250 versus 750), and the‘Loss Probability’ (i.e. 1 versus 3 loss cards out of 32 cards). These factors were always visible for the subjects displayed on the top of the screen. As in the original
version, subjects were asked to make stepwise incremental decisions by turning over one card after another and received outcome feedback following each selection. When a gain card was chosen, the trial score increased, and subjects could con-tinue to turn over more cards. When a loss card was selected, the loss amount was subtracted from the trial score, and the trial automatically ended. At any point during each trial, subjects who had not yet turned over a loss card could stop card selection and receive the total trial payoff. After the end of each trial, subjects received feedback about the total round score (i.e. outcome) displayed on the top of the screen. In contrast to the original CCT version, the game was unrigged and used without deception, i.e. the cards were truly shuffled and thus loss cards could be turned over at any stage during a trial.
Fig. 1 Columbia Card Task (CCT). Screenshots of the Cold CCT and the Hot CCT at the start of the 24 trials. Shown are the 32 face-down cards and the task information regarding the‘Gain Amount’ of the gain cards (i.e. 10 versus 30), the‘Loss Amount’ of the loss cards (i.e. 250 versus 750), and the‘Loss Probability’ (i.e. 1 versus 3 loss cards out of 32 cards) according to the short version of the original CCT (Figner et al.
2009) (Official CCT
Webpage:.http://columbiacardtask. org/columbia-card-task.php?h)
One technical change from the original CCT was imple-mented in the Hot CCT to suit the fNIRS environment. The outcome phase was extended by introducing a delay of 7 s after the presentation of the total round score of each trial, during which subjects saw a blank screen. Thus the minimum outcome interval was 7 s, which was aimed to allow for extracting the hemodynamic and affective responses. If subjects tried to move to the next trial during the outcome interval, the computer would not respond, and no record was generated. The decision phase however, i.e. the interval during card selection, was not fixed, but subjects were free to select without time constraint. This paradigm allowed us to keep the same number of trials, without making the whole task duration tiresome.
Cold CCT In the Cold version of the CCT (trial n = 24) (Fig.1), subjects had to make a single choice by deciding about the number of cards they wanted to turn over, without receiving outcome feedback. The choice was made by clicking on the corresponding number button shown on the screen. Likewise in the Hot CCT, all three factors were always visible for the subjects displayed on the top of the screen and the minimum outcome duration was again set to 7 s. Baseline (B) During the baseline recording (120 s) subjects were asked to fixate their eyes on a fixation cross on screen and to remain motionless.
Questionnaire Following Figner et al. (Figner et al. 2009), after each version of the CCT, subjects were asked to complete a short questionnaire. In particular, they were asked to judge whether they had tried to solve the task instinctively (affect-based decision strategy) or mathematically (deliberative deci-sion strategy) and whether they felt any excitement during the decision phase.
fNIRS instrumentation & hemodynamic response modeling We used a wireless fNIRS instrument (Biocomp Research Institute, nIR system). The sensor components are mounted onto a flexible printed circuit board which, in combination with a highly flexible casing, enables the sensor to be aligned to curved body surfaces such as the head. The optical system is a single-distance continuous-wave spectroscopy comprising a light source consisting of closely spaced emitting light-emitting diodes at two different wavelengths (660 nm and 850 nm) and a light detector. The distance between the source and receiver is 3 cm. The size of the device is 90×40 mm. The light intensity is sampled at 100 Hz and the resulting data are transmitted wirelessly to a host computer within an operating range of about 10 m. For fNIRS recording, the sensor was placed over the right hemisphere, covering the
center between Fp2-F4 according to the international 10–20 system (Jaspers1958).
The resulting [O2Hb] and [HHb] signals were then filtered using NIRS-SPM, a toolbox for the neuroimaging suite SPM5 (Jang et al.2009; Tak et al.2010,2011; Ye et al.2009). We used the discrete cosine transform based detrending algorithm to remove systemic confounds and the precoloring method to remove temporal correlations using a low-pass filter with the HRF shape (Worsley and Friston1995).
For statistical analysis we calculated the total hemoglobin [tHb] concentration, derived as the sum of the averaged [O2Hb] and [HHb] time series. [tHb] was chosen as primary parameter as it represent changes in blood volume correlated with changes in blood flow (Grubb et al.1974) and is thought to be far less sensitive to vein contamination therefore provid-ing higher spatial specificity for mappprovid-ing cerebral activity compared to Δ[O2Hb] or Δ[HHb] (Gagnon et al. 2012). Finally, [tHb] was calculated for the two task phases, i.e. the decision phase and the outcome phase (see“fNIRS, EDA and coherence data” for details on task phase definition).
EDA instrumentation & decomposition procedure
A wired EDA system (Mind-Reflection, VERIM® AudioStrobe® Molinis, 16 Bit resolution, range from 10 kΩ to 4.5 MΩ) was used for recording of skin conductance responses (SCRs). The system allows for the acquisition of completely raw, unfiltered EDA data sampled at 100 Hz. EDA was measured using two grounded flat electrodes attached to the distal phalange of the index and middle fingers of the left, non-dominant hand. A custom-made MATLAB® interface was used to display and event-mark the psychophysiological data. Electrodes were attached tight enough to the skin to prevent movement artifacts but still allow blood to circulate freely, and were placed prior to recording, in order to allow EDA levels to stabilize (Fowles et al.1981).
Skin conductance (SC) data derived from EDA measures are usually characterized by a sequence of overlapping phasic SCRs overlying a tonic component. For full decomposition of SC data into tonic and phasic components, we used the analysis software Ledalab (V3.x) (Benedek and Kaernbach2010a,b). In particu-lar, we applied the continuous decomposition analysis (CDA), i.e. the extraction of the continuous phasic and tonic activity. The continuous decomposition procedure involves four steps: estimation of the tonic component, nonnegative deconvolution of phasic SC data, segmentation of driver and remainder, and reconstruction of SC data. Finally, SCR activity was specified for the two task phases, i.e. the decision phase and the outcome phase (see“fNIRS, EDA and coherence data” for details on task
phase definition).
For statistical analysis, we focused on the phasic SCR (average phasic driver (CDA.SCR [μu/s])); this score is thought to represent phasic activity within response window
most accurately, but does not fall back on classic SCR ampli-tudes. A minimum amplitude criterion of 0.05μS were used (Levinson and Edelberg 1985). We do not report results obtained of the tonic activity as it did not reveal additional relevant information.
Coherence between fNIRS and EDA
To evaluate the relationship between the fNIRS and EDA parameters, i.e. [tHb] and SCRs, the coherence of the two signals was computed. The coherence was calculated based on the Generalized Cross S-transform (GCST) (Pinnegar and Mansinha2003) which allows a precise determination of the amplitude, phase and coherence associations between two signals. The coherence parameter incorporates information about the phase and amplitude correlations between two sig-nals. The GCST is related to the well-known wavelet trans-formation techniques (Grinsted et al. 2004; Torrence and Compo1998) but has the advantage of having a better time-frequency resolution, a linear time-frequency scale and an abso-lutely referenced phase information The implementation allowed one to select frequency ranges for study. The coher-ence between two given time series was calculated using a custom-made MATLAB® package. The calculation steps were: (I) calculation of the GCST, (ii) calculation of the cross wavelet power and coherence.
STC analysis on the two time series generated color-coded 2-D coherence maps as illustrated for an example subject in Fig.4. From the coherogram obtained, the frequency band 0.4–3 Hz (period length 0.3–2.5 s) was then selected for further analysis, which corresponds to the subjects’ heart rate (HR). Within this frequency band, values for significant coherence increase were then calculated based on the two task phases, i.e. the decision phase and the outcome phase (see“fNIRS, EDA and coherence data” for details on task phase definition).
Statistical analysis Behavioral data
Questionnaire Differences in the questions asked after task performance on the Hot and the Cold CCT were assessed using paired sample t -test (confidence interval 95 %) with the factors‘affect-based decision strategy’ (instinctively) ver-sus‘deliberative decision strategy’ (mathematically) and ‘ex-citement during decision phase’.
Information-use and risk-taking analysis Analysis was per-formed separately for the Hot and the Cold CCT. In accordance with Figner et al. (Figner et al.2009), we used the average number of cards chosen per trial as the dependent variable for ANOVA and the three fixed factors‘Gain Amount’ (10 vs. 30 points), ‘Loss Amount’ (250 vs. 750 points) and ‘Loss
Probability’ (1 vs. 3 cards). The interesting parameter in the information-use analysis was how the levels of each of the three informational factors,‘Gain Amount’, ‘Loss Amount’ and ‘Loss Probability’, influenced the number of cards chosen, irrespective of the overall number of cards chosen. The focal parameter in the risk-taking analysis was the overall number of cards chosen, irrespective of the influence of the different factor levels. Because both the gain and the likelihood of experiencing a loss increases with each card that is turned over, turning over more cards is associated with greater outcome variability and therefore is a riskier strategy than turning over fewer cards. Thus, the average number of cards turned over across trials was used as indicator of subjects’ level of risk-taking.
fNIRS, EDA and coherence data
After pre-processing, for statistical analysis using MATLAB® (Version 2007b) and SPSS® (Version 17.0), the three signal parameters, i.e. [tHb], SCRs and HR coherence values, were calculated per subject, condition and trial. The two phases con-sidered for analysis were defined as follows: (1) The decision phase was defined for signals generated during card selection; repeated-measures ANOVA within the decision phase was per-formed using the fixed factors‘Condition’ (BASELINE vs. HOT CCT vs. COLD CCT),‘Gain Amount’ (10 vs. 30 points), ‘Loss Amount’ (250 vs. 750 points) and ‘Loss Probability’ (1 vs. 3 cards). (2) The outcome phase was defined for signals generated after card selection, i.e. after the presentation of the outcome score; repeated-measures ANOVAwithin the outcome phase was performed using the fixed factor‘Score’ (BASELINE vs. GAIN vs. LOSS) with gain (score >0) and loss (score <0) defined. The outcome phase was analyzed only for the Hot CCT, since no score was reported to the decision maker in the Cold CCT. Post-hoc comparisons of means were performed using the Bonferroni correction.
Results Behavioral data
Response latency Response latency was defined as the time span between the start of a new round (i.e. trial) until the subject stopped the round (or turned over a loss card). As expected, the average response latency in the decision phase of the Hot CCT (34.1±1.88 s (standard error of the mean, SEM)) were larger as compared to those of the Cold CCT (14.1±2.58 s); average response latency in the outcome phase of the Hot CCT was 8.3±1.31 s.
Questionnaire T-test revealed that the usage of an affect-based decision strategy (t19=-2.536, p =0.020) as well as the excitement felt during the decision phase (t19=-5.140, p≤
0.001) was reported to be higher in the Hot as compared to the Cold CCT. There was no significant difference between the two CCT versions concerning a mathematical-based strategy (t19=0.352, p =0.729).
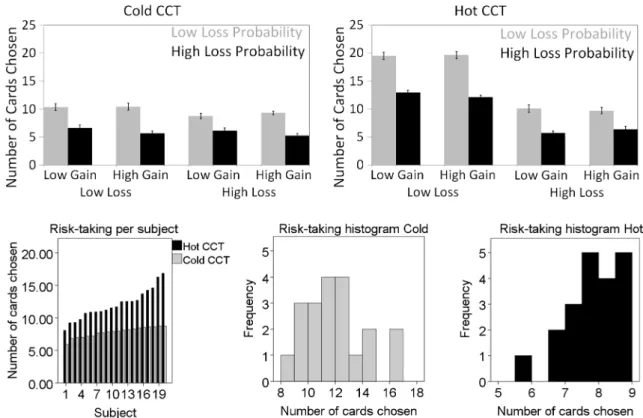
Information-use and risk-taking analysis ANOVA of task performance on the Hot and Cold CCT revealed significant main effects for‘Loss amount’ and ‘Loss Probability’ (Fig.2, Table1). In the Cold CCT, additionally the two-way interaction‘Loss Amount’ and ‘Loss Probability’ was significant. To determine the effect size of the factors the partial eta squared (η2
p) was calculated.η2pvalues indicated that in the Cold CCT ‘Loss Amount’ was more predictive as compared to ‘Loss Probability’, whereas in the Hot CCT ‘Loss Probability’ had a greater effect as compared to‘Loss Amount’. ANOVA further revealed a significant difference between the two versions concerning the number of cards chosen, indicating that risk-taking was overall higher in the Hot as compared to the Cold CCT (Fig.2).
fNIRS and EDA responses
In the decision phase, ANOVA for both the fNIRS and EDA signal parameters revealed main effects for the factor‘Condition’ (BASELINE vs. HOT CCT vs. COLD CCT) (Fig.3, Table2).
Post-hoc comparison for [tHb] responses showed that the Cold CCT elicited significantly larger signals as compared to the Hot CCT, which were both significantly different from baseline. In contrast, post-hoc comparison for SCRs revealed significant larger signals in the Hot as compared to the Cold CCT, again both significantly different from baseline. Comparison of the partial eta squared (η2
p) between fNIRS and EDA signals indicated a stronger effect on fNIRS. No effects of the fixed factors ‘Gain Amount’ (10 vs. 30 points), ‘Loss Amount’ (250 vs. 750 points) and‘Loss Probability’ (1 vs. 3 cards) were found. In the outcome phase, no effects of the fixed factor‘Score’ (BASELINE vs. GAIN vs. LOSS) were found on [tHb] or SCRs.
Coherence between fNIRS and EDA
Significant coherence values were identified in the fre-quency band of the heart rate (0.4–3 Hz; period length 0.3–2.5 s). Figure 4 illustrates a sample of the color-coded 2-D coherence map generated using STC between the [tHb] and SCR time series of an example subject. Figure 4 (Top) shows the time course of the Hot CCT demonstrating task-related increases in coherence during the decision phases. Figure 4 (Bottom) illustrates the same measurement of the Cold CCT, with significant less
task-Fig. 2 Information-use analysis. (Top) Shown is the mean number of chosen cards as a function of the three task factors‘Gain Amount’, ‘Loss Amount’ and ‘Loss Probability’ in the Hot CCT (Top) and Cold CCT (Bottom). Error bars indicate standard error of the mean (SEM).
Risk-Taking analysis. (Bottom ) Illustration of individual risk-taking as represented by the number of cards chosen (subjects are ordered according to the number of cards chosen). Histogram of the number of cards chosen
related increases in coherence, and the baseline, with no task-related increases in coherence.
Analogue to the separate fNIRS and EDA data analyses, ANOVA for the coherence values (Fig.3, Table2) revealed a main effect of the factor ‘Condition’ (BASELINE vs. HOT CCT vs. COLD CCT), indicating higher coherence in the decision phase during performance on the Hot CCT as compared to the Cold CCT. No effect was found for the fixed factor‘Score’ (BASELINE vs. GAIN vs. LOSS).
Discussion
Our results showed that (1) fNIRS was able to quantify the hemodynamic correlates underlying decision processes by means of the CCT. (2) EDA data obtained confirmed previous findings concerning the affective correlates of the CCT. (3) The calculation of the coherence between the hemodynamic and affective correlates suggests that loss aversion, i.e. peo-ple’s tendency to strongly prefer avoiding losses to acquiring Table 1 Information-use and risk-taking analysis. ANOVA was
per-formed for the Hot CCT (Left) and the Cold CCT (Right) using the average number of cards chosen per trial as the dependent variable and the fixed factors‘Gain Amount’ (10 versus 30 points), ‘Loss Amount’
(250 versus 750 points) and‘Loss Probability’ (1 versus 3 cards). Listed are F-statistics (F) with degree of freedom (df) and partial eta squared (η2
p); significant values (p≤0.05) are highlighted (*)
Hot CCT Cold CCT
Hot vs. Cold CCT df F p-value η2p df F p-value η2p
F1=141.558, p≤0.001*
Gain Amount (GA) 1 0.817 0.367 0.002 1 0.084 0.771 0.001
Loss Amount (LA) 1 7.484 0.006* 0.016 1 434.587 ≤0.001* 0.479
Loss Probability (LP) 1 127.737 ≤0.001* 0.213 1 197.260 ≤0.001* 0.295
GA×LA 1 0.167 0.683 0.000 1 0.350 0.554 0.001
GA×LP 1 3.494 0.062 0.007 1 0.000 0.991 0.000
LA×LP 1 1.821 0.178 0.004 1 16.814 ≤0.001* 0.034
GA×LA×LP 1 0.129 0.720 0.000 1 1.696 0.193 0.004
Fig. 3 Mean amplitudes of fNIRS, EDA and coherence signals. Shown are [tHb] responses, SCRs and heart rate (HR) coherence values (Top) in the decision phase for the factor‘Condition’ (BASELINE vs. HOT CCT
vs. COLD CCT) and (Bottom) the outcome phase for the factor‘Score’ (BASELINE vs. GAIN vs. LOSS). Error bars indicate standard error of the mean (SEM)
gains, might be a potential underlying stimulus leading to an increased neural-affective synchronization. The combination of the simultaneous recorded fNIRS and EDA thus provided an additional layer of information concerning the relationship between these two correlates, specifically the interaction of affective and cognitive aspects contributing to loss aversion. We first discuss our findings in relation to current literature on functional magnetic resonance imaging (fMRI), fNIRS, and EDA concerning behavioral, hemodynamic and affective cor-relates of the CCT. We then suggest how the coherence results can be interpreted as a physiological relationship between the fNIRS and EDA responses. This can give us insight into the integration of the two modes of intuition (system 1; i.e. the Hot CCT version) and reasoning (system 2; i.e. the Cold CCT version) in decision-making under risk as described by Kahneman (Kahneman2003).
Behavioral data
Analysis of the information-use showed that our subjects focused on the loss factors. During the decision phase of both the Hot and the Cold CCT, subjects took primarily the loss factors into account, i.e. loss amount and loss probability (Fig.2, Table1). Only the magnitude of the effects of these two factors (as expressed byη2p) was different, with the loss amount being more predictive in the Cold CCT (η2
p=0.479), whereas loss probability had a greater effect in the Hot CCT
(η2
p=0.213). Neither in the Hot nor in the Cold CCT the gain amount was found to be a significant factor for information-use, indicating that it did not influence the number of cards that were turned over. Analysis of risk-taking revealed that subjects were more risk-seeking in the Hot as compared to the Cold CCT, as assessed by the number of cards chosen. Figure2illustrates that the interaction of these factors resem-bles the patterns of the main effects, i.e. high risk-taking behavior (i.e. more cards chosen) was associated with low loss amount and low loss probability, whereas levels of gain amount were associated with low risk-taking behavior.
Our results are partially consistent with previous data. Figner et al. (Figner et al.2009) reported that adult subjects took all three card game factors into account in both the Hot and the Cold CCT, with effect sizes ranging fromη2p=0.35– 0.59. Penolazzi et al. (Penolazzi et al. 2012) reported that subjects considered both loss amount and its probability more than the gain amount in the Hot CCT, whereas all factors were considered in the Cold CCT. On the one hand, the additional significance for gain amount reported in the two previous studies might be due to the difference in sample size as compared to our study (N =76 by Figner et al. and N =150 by Penolazzi et al.). Alternatively, we could argue that indi-vidual differences in risk behavior contributed to the results, i.e. in that our sample subjects were rather loss-averse and were therefore focussing primarily on the loss parameters. This aspect would match with what Table 2 Mean amplitudes of fNIRS, EDA and coherence signals.
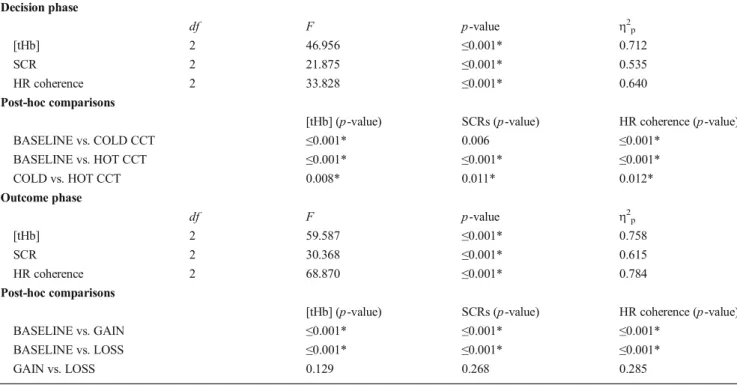
Re-peated-measures ANOVA was performed with the [tHb] responses, SCRs and heart rate (HR) coherence values as the dependent variables (Top) for the decision phase with the fixed factor‘Condition’ (BASELINE vs.
HOT CCT vs. COLD CCT) and (Bottom) for the outcome phase with the fixed factor‘Score’ (BASELINE vs. GAIN vs. LOSS). Listed are F-statistics (F) with degree of freedom (df) and partial eta squared (ηp2);
significant values (p≤0.05) are highlighted (*) Decision phase df F p-value η2p [tHb] 2 46.956 ≤0.001* 0.712 SCR 2 21.875 ≤0.001* 0.535 HR coherence 2 33.828 ≤0.001* 0.640 Post-hoc comparisons
[tHb] (p-value) SCRs (p-value) HR coherence (p-value)
BASELINE vs. COLD CCT ≤0.001* 0.006 ≤0.001* BASELINE vs. HOT CCT ≤0.001* ≤0.001* ≤0.001* COLD vs. HOT CCT 0.008* 0.011* 0.012* Outcome phase df F p-value η2p [tHb] 2 59.587 ≤0.001* 0.758 SCR 2 30.368 ≤0.001* 0.615 HR coherence 2 68.870 ≤0.001* 0.784 Post-hoc comparisons
[tHb] (p-value) SCRs (p-value) HR coherence (p-value)
BASELINE vs. GAIN ≤0.001* ≤0.001* ≤0.001*
BASELINE vs. LOSS ≤0.001* ≤0.001* ≤0.001*
we discuss in the “fNIRS responses” concerning fNIRS
responses.
Considerations on decision versus outcome phase
The present study investigated two task phases, i.e. the deci-sion phase (both in the Cold and the Hot CCT) defined as the time interval during card selection, and the outcome phase (only in the Hot CCT) defined as the time interval after card selection at the end of a trial.
Regarding the decision phase, separate studies have shown that the hemodynamic correlates of the two factors gain/loss amount and loss probability can be reflected in human pre-frontal areas. Increasing activation has been shown to encodes gain amount with respect to outcome magnitude, probability, and their combination (Knutson et al.2005; Preuschoff et al.
2006; Tobler et al.2007) and loss probability with respect to outcome uncertainty, variance, or volatility (Huettel et al.
2005, 2006; Knutson et al. 2005; Preuschoff et al. 2006; Tobler et al.2007). However, in the present study using the CCT we did not find significant differences for none of the factors. Reasons for the non-significant findings are mostly due to the experimental nature of the CCT. In particular, the
card selection in the CCT is without replacement, which means the factor loss probability does not stay the same throughout a trial, but changes from card to card chosen. In addition, the trial score that is fed back to the subject throughout the trial is changing as well with each gain card chosen. This in turn may bias the response to the factor gain amount. Together, although the CCT is a good well-defined risky decision task, it has the disadvantage that it can therefore not properly assess related individual risk preference parameters. We have recently tested two other decision paradigms that assess risk-taking in a very similar fashion as the CCT but overcome the above de-scribed disadvantages. In these recent studies (Holper et al.
2013a,b), which will shortly be available, we have shown that if all of these factors stay constant over the time course of a trial, significant fNIRS and EDA responses emerge. In the following discussion, we will focus only comparing the factor ‘Condition’ (BASELINE vs. HOT CCT vs. COLD CCT) in the decision phase.
Regarding the outcome phase, as compared to the original CCT, the time interval of the outcome phase had been exper-imentally extended. The aim of the extended outcome phase was to investigate whether fNIRS and EDA were able to
Hot CCT: HR Coherence Frequency (Hz) Time (sec) 0 100 200 300 400 500 600 700 0.5 1 1.5 2 2.5 0.2 0.4 0.6 0.8 Baseline: HR Coherence Time (sec) 0 50 100 0.5 1 1.5 2 2.5 Cold CCT: HR Coherence Time (sec) Frequency (Hz) 0 100 200 300 0.5 1 1.5 2 2.5 0 0.2 0.4 0.6 0.8 Fig. 4 Coherence in Heart Rate
(HR) Frequency between [tHb] and SCRs. Shown is a sample of the color-coded 2-D coherence map in the frequency band of the heart rate (0.4–3 Hz; period length 0.3–2.5 s) between the [tHb] and SCR time series of an example subject over the time course the Hot CCT (Top), Cold CCT (Bottom Left) and baseline (Bottom Right). Significant higher task-related coherence values (indicated in red colors) during the decision phases are illustrated in the Hot as compared to the Cold CCT. Vertical lines indicate the onsets of the decision phases. Interpretation of the phase arrows with care: pointing to the right=in-phase, to the left=anti-phase, down=X leading Y by 90°, up=Y leading X by 90° (Grinsted et al.2004)
reflect the behavioral responses to gains versus losses as represented by the total round score. In other studies on DM tasks, such as the BART (Cazzell et al.2012; Rao et al.2008) or the IGT (Bechara et al.2000b; Lawrence et al.2009; Li et al.2010), responses to gains versus losses have been ob-served using fMRI, fNIRS and EDA. However, the present study did not detect significant hemodynamic nor affective responses related to the outcome phase. Reasons for the non-significant findings might be due to the structure of the CCT. The outcome score in the CCT is updated after each trial (i.e. each single round) and then set back to zero for the next trial without presentation of the total game score (total of all rounds). In contrast, in the IGT or the BART, which are however measures of decision-making under uncertainty (not simply risk), the trial outcome score (single round) is added to the total game score (total of all rounds) that is always visible for the subject. Gains and losses might there-fore not be such salient visual and attentional factors in the CCT as compared to the IGT or the BART. Additionally, the sample size of the present study might have been too small to reach significance level. Future studies may investigate whether effects of gains and losses will become significant when including a larger sample size.
fNIRS responses
The CCT has so far not been investigated using neuroimaging methods, which could serve as reference for our data. However, the broader DM literature has widely accepted the specific role of PFC in human decision performance (Bechara et al.2000a; Fellows2007). In particular, neuroimaging data from related tasks such as the IGT suggest that a neural circuitry is involved in the representation of both the deliber-ative and affective processes. As recently summarized (Li et al. 2010), this neural circuitry includes the DLPFC for working memory, the insula and posterior cingulate cortex (PCC) for representations of emotional states, the mesial orbitofrontal cortex (OFC) and the ventromedial PFC for coupling the two previous processes, and finally the ventral striatum and anterior cingulate/supplementary motor area (SMA) for implementing behavioral decisions (Lawrence et al.2009; Li et al.2010).
In accordance with the consideration that the decisions presented by the CCT rely on both deliberative and affective decision processes, the present study showed that hemody-namic changes measured over PFC were larger in response to the Cold CCT, i.e. representing more deliberative decisions, as compared to the Hot CCT, i.e. representing affect-based deci-sion performance (Fig.3, Table2). The primary question that arises when looking at these results is which effects led to the lower underlying neural activation during performance on the Hot CCT as compared to the Cold CCT. We suggest three aspects that might have contributed to these results: (1)
deliberative processes reflected in PFC, (2) loss aversion reflected in PFC and/or (2) negative affective arousal reflected in subcortical areas.
First, the most plausible interpretation is that the delibera-tive processes used during performance on the Cold CCT rely more on PFC; for this reason we find stronger signals in the Cold than the Hot CCT. This interpretation is in line with various findings reporting the relevance of prefrontal areas in decision-making and the cognitive control to regulate affec-tive stimuli (Bechara and Damasio 2005; Bechara et al.
2000b; Frank et al.2009; Krawczyk2002).
Alternatively, using fMRI Tom et al. (Tom et al. 2007) reported that neural signals in the PFC are associated with behavioral loss aversion. Loss aversion refers to the human tendency to experience equally sized losses as more unpleas-ant than compliable gains are pleasurable (i.e. losses loom larger than gains) (Kahneman and Tversky1984). In particu-lar, the slope of decreasing activity for an increase in losses has been described to be greater in amplitude than the slope of increasing activity for an increase in gains. This finding sug-gests a negative correlation between PFC activation and be-havioral loss aversion. Considering that during the Hot CCT the risk of substantial losses increases with each subsequent choice, one might suggest that loss aversion could become more powerful over the time course of a trial as compared to potential gains. Following this argumentation, our results might demonstrate that, in the context of the Hot CCT, poten-tial increasing losses resulted in‘dynamically’ increasing loss aversion which in turn was reflected by a reduced activity in PFC. This interpretation would also match with the behavioral data on information-use described in “Behavioral data”.
Analysis of the information-use showed that the participants in the present focused mainly on the loss factors. A limitation of the current study is that we did not directly assess individual loss aversion, i.e. using self-report measures. However, taking this limitation into account, our behavioral findings together could be taken as indicator of loss-averse behavior, which in turn might be reflected by the reduced activity in PFC.
Last, other fMRI studies showed that anticipated or expe-rienced losses give rise to activation in regions that have been associated with negative affective arousal, such as the amyg-dala or anterior insula (Breiter et al.2001; Kahn et al.2002; Kuhnen and Knutson2005). In the present study, we recorded from prefrontal cortices and can therefore only make assump-tions on this area. A general limitation of fNIRS is its lack of sensitivity to deeper brain areas (approximately 1–3 cm of depth of the cortex). Due to this limited depth penetration fNIRS is not able to capture activations in subcortical areas, such as the amygdala or insula (Quaresima et al. 2012). However, it is most likely that, simultaneous to the prefrontal activation, activations in these other affect-related subcortical regions occurred in our subjects. This could have led to a kind of blood‘steal’ effect by which blood is diverted to active sites
(i.e. amygdala or insula) from neighboring brain regions (i.e. prefrontal cortices) (Harel et al.2002). A steal effect could thus explain the lower hemodynamic response during the affect-based condition, i.e. the Hot CCT, as compared to the deliberative condition, i.e. the Cold CCT.
Taken together, from the current data we cannot determine which of these explanations or whether a combination of all three (or others) actually contributed to our results. Another notable limitation is the single-channel approach applied in the current study. Multi-channel systems could provide multi-regional information regarding the cerebral blood oxygenation and hemodynamics and display the results in the form of a map or image over a specific cortical area (Ferrari and Quaresima2012). However, we suggest that the current find-ings provide first evidence of how fNIRS encodes the hemo-dynamic correlates underlying decision processing during performance on the CCT.
EDA responses
In contrast to the [tHb] responses, EDA results revealed significant larger SCRs in the Hot as compared to the Cold CCT (Fig.3, Table2). These results are consistent with the findings by Figner et al. (Figner et al.2009), thus confirming the differential involvement of affective versus deliberative processes during performance on the two CCT versions.
However, two differences in the experimental design be-tween the study by Figner et al. and ours should be considered. First, there was a difference in the condition under which the baseline was conducted. Figner et al. conducted baseline recording during the completion of the questionnaire that followed the CCT (on average 2 min); in contrast, in the present study baseline recording was done while subjects fixated their eyes on a fixation cross on screen and rested motionless (2 min). We suggest that the‘questionnaire’ base-line by Figner et al. most likely elicited larger SCRs due to the additional cognitive load as compared to our‘rest’ baseline. Consistent with this argumentation, SCRs amplitudes during the‘questionnaire’ baseline by Figner et al. were only signif-icant different (smaller) from the Hot but not from the Cold CCT, whereas our analysis revealed that SCRs levels were significant smaller during‘rest’ baseline than both the Hot and the Cold CCT.
Second, in the study by Figner et al. (Figner et al.2009), SCRs levels were calculated based on performance over the whole task duration (from first to last trial); in addition, the authors analyzed only the very first decision before feedback on that first card was obtained (in the hot CCT, this was the time from starting the first trial to either clicking on the first card or taking no card at all; in the cold CCT it was the time from starting the first trial to choosing the number of cards in this trial). In contrast, in our study the decision and the outcome phase were investigated separately. However, since
the current study cannot make conclusions concerning the outcome phase, the potential influence of this experimental difference remains unanswered. Future studies may further examine these physiological findings on the CCT, and in particular, the differentiation between the decision and the outcome phase.
Coherence between fNIRS and EDA
Last, we aimed to illustrate a relationship between the hemo-dynamic and affective responses observed during perfor-mance on the CCT. This was done by investigating the coher-ence between the [tHb] and SCRs time series. Results of the STC analysis showed consistent findings with our data pre-sented so far. Coherence in the heart rate frequency band revealed significant increases in both the Hot and the Cold CCT. As discussed above, fNIRS and EDA signals showed opposite activity patterns in the Hot CCT (low [tHb], large SCRs) as compared to the Cold (large [tHb], low SCRs). Consequently, it could have been expected that these opposite pattern led to a decrease in coherence. However, STC calcu-lations clearly indicated a significant change in the coherence status when subjects entered the decision phase, with the Hot CCT eliciting a larger coherence change as compared to the Cold CCT (Fig.3, Table2).
From the fMRI literature it is known that a significant component of physiological noise in the blood oxygenation level dependent (BOLD) signal is caused by variations in heart rate fluctuations (Chang et al. 2009; Jezzard et al.
1993). Heart rate plays a considerable role in that it modulates the BOLD signal by inducing changes in neuronal activity and blood vessels linked with changes in levels of arousal (Chang et al.2009). Similar findings have been reported for fNIRS data (Lu et al.2010; Zhang et al.2010). Further, variations in heart rate in response to affective stimuli have been reported to follow two main patterns. First, there is an initial bradycardia, i.e. heart rate deceleration, thought to express attentional orienting to motivationally-salient events through parasympa-thetic activity (Bradley2009). Second, there is a later rise in heart rate, signifying affective arousal through sympathetic activation (Bradley and Lang 2007). In the DM literature, these two patterns have been shown to also exist during decisions under risk and uncertainty (Jones et al. 2011; Studer and Clark 2011). In particular, heart rate responses have been shown to be especially sensitive to potential losses, i.e. greater decision-related initial heart rate decelerations are observed under conditions where the chances of winning decrease over the time course of a gamble. Here, we refer back to“Behavioral data” and “fNIRS responses”, where we
discussed the behavioral data and the hemodynamic responses in relation to loss aversion. In particular, although we did not directly measure our subjects’ heart rate in the present study, it could be assumed that during the decision phase subjects’
heart rate decreased due to loss aversion. This interpretation is supported by our findings discussed above: first, subjects’ focus on the loss factors (loss amount and loss probability, “Behavioral data”) that was most likely based on the typically
increasingly risky choices required over the time course of a CCT trial and second, the decreased hemodynamic responses that were most likely induced by a correlation between PFC activation and behavioral loss aversion (“fNIRS responses”).
Consequently, considering again the coherence in the heart rate frequency, we suggest that loss aversion was the potential synchronizing stimulus on the underlying neural and affective decision processes. Loss aversion elicited first changes in the heart rate, i.e. a stronger deceleration in the Hot as compared to the Cold CCT, followed by changes in coherence, i.e. a larger increase in coherence in the Hot as compared to the Cold CCT. In other words, loss aversion may have induced the decrease in heart rate which resulted in the increase in coherence.
As an alternative interpretation, one could argue that in the Hot CCT, both affective and deliberative decision processes are involved. Hence, it would be plausible to find a tighter coupling, i.e. a higher coherence, between the more affective and more deliberative signals represent-ed by EDA and fNIRS, respectively. In contrast, in the Cold CCT there is a relative absence of affective process-es, and hence, it would be plausible to find no increase in coherence. In any case, using either of these interpreta-tions, the coherence measure may provide an indicator of functional synchronization between the hemodynamic and the affective signals.
Future studies including direct heart rate measures are required to confirm these findings and our interpretations. Assessing functional synchronization between hemodynamic and affective parameters may also be attractive for other applications involving DM paradigms seeking to provide insight into behavioral performance and associated physiolog-ical changes.
Conclusion
Our results showed that fNIRS is able to quantify the hemodynamic correlates underlying risky decision process-es by means of the CCT. The combination with EDA assessing affective decision provided an additional layer of information concerning the relationship between these two physiological correlates, with loss aversion potentially playing a significant role as synchronizing stimulus during decision processes. Our findings demonstrate the potential of simultaneously assessing fNIRS and EDA for various experimental DM paradigms and research areas where interactions between the two underlying physiological sys-tems are involved.
Acknowledgments The authors thank Bernd Figner for providing the software of the Columbia Card Task (CCT). The authors thank the Swiss Foundation for Grants in Biology and Medicine (SFGBM) and the Swiss National Science Foundation (SNSF) (Grant PASMP3_136987) for fi-nancial support.
Disclosure statement The authors have no conflict of interest.
References
Bechara, A., & Damasio, A. (2005). The somatic marker hypothesis: A neural theory of economic decision. Games and Economic Behavior, 52, 336–372.
Bechara, A., Damasio, A., Damasio, H., & Anderson, S. (1994). Insensitivity to future consequences following damage to human prefrontal cortex. Cognition, 50(1–3), 7–15.
Bechara, A., Tranel, D., & Damasio, H. (2000a). Characterization of the decision-making deficit of patients with ventromedial prefrontal cortex lesions. Brain, 123(11), 2189–2202.
Bechara, A., Damasio, H., & Damasio, A. R. (2000b). Emotion, decision making and the orbitofrontal cortex. Cerebral Cortex, 10(3), 295– 307. doi:10.1093/cercor/10.3.295.
Benedek, M., & Kaernbach, C. (2010a). Decomposition of skin conductance data by means of nonnegative deconvolution. Psychophysiology, 47(4), 647–658.
Benedek, M., & Kaernbach, C. (2010b). A continuous measure of phasic electrodermal activity. Journal of Neuroscience Methods, 190(1), 80–91.
Boucsein, W. (1992). Electrodermal activity. New York, NY: Plenum Press.
Bradley, M. M. (2009). Natural selective attention: orienting and emotion. Psychophysiology, 46(1), 1–11.
Bradley, M. M., & Lang, P. (2007) Emotion and motivation. In: Handbook of psychophysiology. Cambridge, MA: Cambridge University Press.
Brand, M., Fujiwara, E., Borsutzky, S., Kalbe, E., Kessler, J., & Markovitsch, H. (2005). Decision-making deficits of Korsakoff patients in a new gambling task with explicit rules: Associations with executive functions. Neuropsychology, 19(3), 267–277. Breiter, H., Aharon, I., Kahneman, D., Dale, A., & Shizgai, P. (2001).
Functional imaging of neural responses to expectancy and experi-ence of monetary gains and losses. Neuron, 30(2), 619–639. Cazzell, M., Li, L., Lin, Z., Patel, S., & Liu, H. (2012). Comparison of
neural correlates of risk decision making between genders: An exploratory fNIRS study of the Balloon Analogue Risk Task (BART). NeuroImage, 62, 1896–1911.
Chang, C., Cunningham, J. P., & Glover, G. (2009). Influence of heart rate on the BOLD signal: The cardiac response function. NeuroImage, 44, 857–869.
Falk, L., & Richardsson, A. (unpublished) Executive functions and adolescent risk taking—a dual system approach. Umeå University, Department of Psychology.
Fellows, L. (2007). Advances in understanding ventromedial prefrontal function: the accountant joins the executive. Neurology, 68(3), 991– 995.
Ferrari, M., & Quaresima, V. (2012). A brief review on the history of human functional near-infrared spectroscopy (fNIRS) development and fields of application. NeuroImage, 63(2), 921–935.
Figner, B., & Murphy, R. O. (2010). Using skin conductance in judgment and decision making research. In M. Schulte-Mecklenbeck, A. Kuehberger, & R. Ranyard (Eds.). A handbook of process tracing methods for decision research (pp. 163–184). New York, NY: Psychology Press.
Figner, B., & Weber, E. (2011). Who takes risks when and why? Determinants of risk taking. Current Directions in Psychological Science, 20(4), 211–216.
Figner, B., Mackinlay, R., Wilkening, F., & Weber, E. (2009). Affective and deliberative processes in risky choice: Age differences in risk taking in the Columbia Card Task. Journal of Experimental Psychology: Learning, Memory, and Cognition, 35(3), 709–730.
Fowles, D. C., Christie, M. J., Edelberg, R., Grings, W. W., Lykken, D. T., & Venables, P. H. (1981). Publication recommendations for electro-dermal measurements. Psychophysiology, 18(3), 232–239. doi:10. 1111/j.1469-8986.1981.tb03024.x.
Frank, M., Cohen, M., & Sanfey, A. (2009). Multiple systems in decision making. Current Directions in Psychological Science, 18(2), 73–77. Gagnon, L., Yücel, M. A., Dehaes, M., Cooper, R. J., Perdue, K. L., Selb, J., Huppert, T. J., et al. (2012). Quantification of the cortical contri-bution to the NIRS signal over the motor cortex using concurrent NIRS-fMRI measurements. NeuroImage, 59(4), 3933–3940. Grinsted, A., Moore, J., & Jevrejeva, S. (2004). Application of the cross
wavelet transform and wavelet coherence to geophysical time series. Nonlinear Processes in Geophysics, 11, 561–566.
Grubb, R., Raichle, M., Eichling, J., & Ter-Pogossian, M. (1974). The effects of changes in PaCO2 cerebral blood volume, blood flow, and vascular mean transit time. Stroke, 5(5), 630–639.
Harel, N., Lee, S., Nagaoka, T., Kim, D., & Kim, S. (2002). Origin of negative blood oxygenation level-dependent fMRI signals. Journal of Cerebral Blood Flow & Metabolism, 22(8), 908–917.
Holper, L., ten Brincke, R., Wolf, M., & Murphy, R. (2013) Hemodynamic and affective correlates of the Sequential Draw Task (SDT). (under review).
Holper, L., Wolf, M., & Tobler, P. (2013) Comparison of functional near-infrared spectroscopy and electrodermal activity in assessing objec-tive versus subjecobjec-tive risk during risky financial decisions. (under review).
Huettel, S., Song, A., & McCarthy, G. (2005). Decisions under uncertainty: Probabilistic context influences activation of pre-frontal and parietal cortices. The Journal of Neuroscience, 25 (13), 3304–3311.
Huettel, S., Stowe, C., Gordon, E., Warner, B., & Platt, M. (2006). Neural signatures of economic preferences for risk and ambiguity. Neuron, 49(5), 765–775.
Jang, K., Tak, S., Jung, J., Jang, J., Jeong, Y., & Ye, J. (2009). Wavelet minimum description length detrending for near-infrared spectros-copy. Journal of Biomedical Optics, 14, 034004.
Jaspers, H. (1958). The ten-twenty electrode system of the International Federation. Electroencephalography and Clinical Neurophysiology, 10, 371–375.
Jezzard, P., LeBihan, D., Cuenod, D., Pannier, L., Prinster, A., & Turner, R. (1993) An investigation of the contribution of physiological noise in human functional MRI studies at 1.5 tesla and 4 tesla. Proc SMRM, 12th Annual Meeting, 1392. New York, NY.
Jones, C., Minati, L., Harrison, N. A., Ward, J., & Critchley, H. (2011). Under pressure: Response urgency modulates striatal and insula activity during decision-making under risk. PLoS ONE, 6 (6), e20942.
Kahn, I., Yeshurun, Y., Rotshtein, P., Fried, I., Ben-Bashat, D., & Hendler, T. (2002). The role of the amygdala in signaling prospective out-come of choice. Neuron, 33(6), 983–994.
Kahneman, D. (2003). Maps of bounded rationality: Psychology for behavioral economics. The American Economic Review, 93 (5), 1449–1475.
Kahneman, D., & Tversky, A. (1984). Choices, values, and frames. American Psychologist, 39(4), 341–350.
Knutson, B., Taylor, J., Kaufmann, M., Peterson, R., & Glover, G. (2005). Distributed neural representation of expected value. The Journal of Neuroscience, 25(19), 4806–4812.
Krawczyk, D. (2002). Contributions of the prefrontal cortex to the neural basis of human decision making. Neuroscience & Biobehavioral Reviews, 26(6), 631–664.
Kuhnen, C., & Knutson, B. (2005). The neural basis of financial risk taking. Neuron, 47(5), 763–770.
Lawrence, N., Jollant, F., O’Daly, Q., Zaleya, F., & Phillips, M. (2009). Distinct roles of prefrontal cortical subregions in the Iowa Gambling Task. Cerebral Cortex, 19(5), 1134–1143.
Lejuez, C., Read, J., Kahler, C., Richards, J., Ramsey, S., Stuart, G., Strong, D., et al. (2002). Evaluation of a behavioral measure of risk taking: The Balloon Analogue Risk Task (BART). Journal of Experimental Psychology: Applied, 8(2), 75–84.
Levin, I., & Hart, S. (2003). Risk preferences in young children: Early evidence of individual differences in reaction to potential gains and losses. Journal of Behavioral Decision Making, 16(5), 397–413. Levinson, D. F., & Edelberg, R. (1985). Scoring criteria for response
latency and habituation in electrodermal research: A critique. Psychophysiology, 22(4), 417–426. doi:10.1111/j.1469-8986.1985. tb01626.x.
Li, X., Lu, Z., D’Argembeau, A., Ng, M., & Bechara, A. (2010). The Iowa Gambling Task in fMRI images. Human Brain Mapping, 31, 410–423.
Lu, C.-M., Zhang, Y.-J., Biswal, B. B., Zang, Y.-F., Peng, D.-L., & Zhu, C.-Z. (2010). Use of fNIRS to assess resting state functional con-nectivity. Journal of Neuroscience Methods, 186(2), 242–249. Oldfield, R. (1971). The assessment and analysis of handedness: the
Edinburgh inventory. Neuropsychologia, 9(1), 97–113.
Panno, A., Lauriola, M., & Figner, B. (2013). Emotion regulation and risk taking: Predicting risky choice in deliberative decision making. Cognition & Emotion, 27(2), 326–334.
Penolazzi, B., Gremigni, P., & Russo, P. (2012). Impulsivity and reward sensitivity differentially influence affective and deliberative risky deci-sion making. Personality and Individual Differences, 53, 655–659. Pinnegar, C., & Mansinha, L. (2003). The S-transform with windows of
arbitrary and varying shape. Geophysics, 68(1), 381–385. Pleskac, T. (2008). Decision making and learning while taking sequential
risks. Journal of Experimental Psychology: Learning, Memory, and Cognition, 34(1), 167–185.
Preuschoff, K., Bossaerts, P., & Quartz, S. (2006). Neural differentiation of expected reward and risk in human subcortical structures. Neuron, 51(3), 381–390.
Quaresima, V., Bisconti, S., & Ferrari, M. (2012). A brief review on the use of functional near-infrared spectroscopy (fNIRS) for language imaging studies in human newborns and adults. Brain and Language, 121(2), 79–89.
Rao, H., Korcykowski, M., Pluta, J., Hoang, A., & Detre, J. (2008). Neural correlates of voluntary and involuntary risk taking in the human brain: An fMRI study of the Balloon Analog Risk Task (BART). NeuroImage, 42(2), 902–910.
Rogers, R., Owen, A., Middleton, H., Williams, E., Pickard, J., Sahakian, B., & Robbins, T. (1999). Choosing between small, likely rewards and large, unlikely rewards activates inferior and orbital prefrontal cortex. Journal of Neuroscience, 19(20), 9029–9038.
Slovic, P. (1966). Risk-taking in children: Age and sex differences. Child Development, 37(1), 169–176.
Studer, B., & Clark, L. (2011). Place your bets: Psychophysiological correlates of decision-making under risk. Cognitive, Affective, & Behavioral Neuroscience, 11(2), 144–158.
Suhr, J., & Hammers, D. (2010). Who Fails the Iowa Gambling Test (IGT)? Personality, neuropsychological, and near-infrared spectros-copy findings in healthy young controls. Archives of Clinical Neuropsychology, 25(4), 293–302. doi:10.1093/arclin/acq017. Tak, S., Jang, J., Lee, K., & Ye, J. (2010). Quantification of CMRO(2)
without hypercapnia using simultaneous near-infrared spectroscopy and fMRI measurements. Physics in Medicine and Biology, 55(1), 3249–3269.
Tak, S., Yoon, S., Jang, J., Yoo, K., Jeong, Y., & Ye, J. (2011). Quantitative analysis of hemodynamic and metabolic changes in subcortical vas-cular dementia using simultaneous near-infrared spectroscopy and fMRI measurements. NeuroImage, 55(1), 176–184.
Tobler, P. N., O’Doherty, J. P., Dolan, R. J., & Schultz, W. (2007). Reward value coding distinct from risk attitude-related uncertainty coding in human reward systems. Journal of Neurophysiology, 97(2), 1621– 1632.
Tom, S. M., Fox, C. R., Trepel, C., & Poldrack, R. A. (2007). The neural basis of loss aversion in decision-making under risk. Science, 315(5811), 515–518.
Torrence, C., & Compo, G. (1998). A practical guide to wavelet analysis. Bulletin of the American Meteorological Society, 79, 61–78.
Villringer, A., & Dirnagl, U. (1995). Coupling of brain activity and cerebral blood flow: Basis of functional neuroimaging. Cerebrovascular and Brain Metabolism Reviews, 7 , 240– 276.
Worsley, K. J., & Friston, K. (1995). Analysis of fMRI time-series revisited—again. NeuroImage, 2(3), 173–181.
Ye, J. C., Tak, S., Jang, K. E., Jung, J., & Jang, J. (2009). NIRS-SPM: Statistical parametric mapping for near-infrared spectroscopy. NeuroImage, 44(2), 428–447.
Zhang, H., Zhang, Y.-J., Lu, C.-M., Ma, S.-Y., Zang, Y.-F., & Zhu, C.-Z. (2010). Functional connectivity as revealed by independent compo-nent analysis of resting-state fNIRS measurements. NeuroImage, 51(3), 1150–1161.
![Fig. 3 Mean amplitudes of fNIRS, EDA and coherence signals. Shown are [tHb] responses, SCRs and heart rate (HR) coherence values (Top) in the decision phase for the factor ‘ Condition ’ (BASELINE vs](https://thumb-eu.123doks.com/thumbv2/123doknet/14811063.611309/7.892.79.817.153.372/amplitudes-coherence-signals-responses-coherence-decision-condition-baseline.webp)