The Ecosystem of Renewable Energy Shift and its Future Dynamics
byMasahiro Yamada
M.S., Advanced Energy, University of Tokyo, 2011 B.E., Electrical Engineering, University of Tokyo, 2009
SUBMITTED TO THE DEPARTMENT OF SYSTEM DESIGN AND MANAGEMENT IN PARTIAL FULFILLMENT OF THE REQUIREMENTS OF THE DEGREE OF
MASTER OF SCIENCE IN ENGINEERING AND MANAGEMENT AT THE
MASSACHUSETTS INSTITUTE OF TECHNOLOGY
JUNE 2018
&2018 Masahiro Yamada. All rights reserved.
The author hereby grants to MIT permission to reproduce and to distribute publicly paper and electronic copies of this thesis document in whole or in part in any medium now known or hereafter created.
Signature of Author:
Signature redacted
\w
Masahiro Yamada,System Design and Management Program May 8, 2018 Certified by: Accepted by: MASSACHUSETTS INSTITUTE MASSACHUSETTS INSTITUTE OF TECHNOLOGY
JUN 20 2018
LIBRARIES
___Signature redacted
Henry Birdseye Weil, Thesis Supervisor, Senior Lecturer, MIT School of Management.
Signature redacted
I
Joan S. Rubin,Executive Director, System Design and Management Program
(This page intentionally left blank)
The Ecosystem of Renewable Energy Shift and its Future Dynamics
by Masahiro Yamada
Submitted to the System Design and Management Program on May 8, 2018 in Partial Fulfillment of the Requirements for the Degree of Master of Science in
Engineering and Management
ABSTRACT
Substituting non-renewable energy for renewable energy plays an important role for our sustainability, which is the common goal for human beings. However, several strategies by governments and companies exist to make this shift, because the priority of each strategy mainly depends on the relative costs and their regulations, which makes this shift complicated. This paper describes a model of the common causal loop diagram and applies it to three cases. Additionally, by building stock and flow model, the future dynamics are simulated by System Dynamics.
Based on the casual loop diagram analysis, the renewable shift makes three phases. The first phase is making an ecosystem of renewables initiated by political support or guideline such establishing a low generation cost and making the power grid system flexible enough to accept renewables. The second phase is pushing the energy mix by private investment to capture the economic benefit including reducing electric bills with low-cost renewable energy, the merit of reputation and sustainability of business. The third phase aims at meeting the political target of the energy mix by political strategies, such as tax
exemptions, subsidies and obligations for companies.
Stock and flow model of System Dynamics is applied for the future of the Japanese renewable shift cases to illustrate which compositions of the casual loop are the key causes for dynamics. At first, the relative cost triggers the renewable shift not only for companies but also for utilities. After that, the difference of the energy mix of a company and its target decides how much the energy mix increases each year. These two factors decide the intensiveness of investment of a company, even though the relative cost is not an internal factor. Also, the capacity mix of a utility deals with the speed of the renewable shift.
Thesis Supervisor: Henry Birdseye Weil
(This page intentionally left blank)
ACKNOWLEDGEMENTS
Two years ago, when I started my MIT life, I was really overwhelmed by the intensiveness of the SDM Boot camp and SDM core course. Additionally, the other classes required many assignments. There is no doubt that the August and September in 2016 was the toughest time in my life. However, Lecturers, TAs, SDM friends, Japanese friends and my family truly supported me. I would like to thank all of the people who encouraged me in my MIT and
Cambridge life.
First of all, I would like to express deepest gratitude to my thesis adviser, Henry Birdseye Weil. Our weekly meeting was truly an important milestone for me to deepen my study. Since you had the enthusiastic and insightful passion to discuss, I was able to broaden my knowledge and breakthrough in my studies.
Additionally, I would like to express my gratitude to Central Japan Railway Company (CJR). You gave me the greatest chance in the world to expand my perspectives. I am looking forward to working at CJR after my graduation.
Finally, I would like to say thanks to my family. My dearest wife, Yuna, and most precious daughter, Kaho, always encouraged me in the hard work at MIT. Kiyoshi and Chizuko, my parents, and Estuko, my mother-in-law for supported our life in Cambridge from Japan, visiting us a few times and playing with Kaho during your visit. I love you all and truly appreciated.
Masahiro Yamada Cambridge, Massachusetts May 2018
(This page intentionally left blank)
TABLE OF CONTENTS
LIST O F TA BLES ... 9
LIST OF FIG URES ... 10
LIST OF A CRON Y M S AN D A BBREVIATION S... 12
Chapter 1 Introduction... 13 1.1 M otivation...13 1.2 Research Objectives... 15 1.3 Research Questions... 16 1.4 A pproach...17 1.5 Thesis O utline ... 17
Chapter 2 Strategies of Renew able Shift and K ey Factors... 18
2.1 Political A pproach... 18
2.1.1 Paris A greem ent ... 18
2.1.2 Political Target for Each Sector ... 19
2.1.3 Feed-in Tariff (FIT)... 20
2.2 Private A pproach... 23
2.2.1 REIOO ... 23
2.3 K ey Factors to Energy Shift to Renew ables ... 24
2.3.1 LCO E ... 24
2.3.2 Infrastructure Flexibility ... 28
2.3.3 Pow er Purchase A greem ent (PPA) ... 31
2.3.4 Traceable G reen Certificate (TG C) ... 31
2.3.5 Carbon O ffset and Cap & Trade ... 32
Chapter 3 Causal Loop D iagram A nalysis ... 33
3.1 D escription of the CLD m odel... 33
3.1.1 Com pany Internal Loops... 34
3.1.2 Relationship Loops of Com pany and U tility ... 37
3.1.3 Relationship Loops of Com pany and Political Parts ... 40
3.1.4 Relationship Loops of Company and Infrastructure... 43
3.2 A pplication for Casual Loop Diagram ... 45
3.2.1 Case 1: N S and Eneco... 45
3.2.2 Case 2 (Google) ... 50
3.2.3 Case 3 (RICO H)... 52
3.3 Conclusion ... 59
Chapter 4 Stock and Flow A nalysis... 63
4.2 Base Case Analysis ... 66
4.3 Sensitivity Analysis... 70
4.4 Results and Future W ork... 71
4.5 Conclusion ... 76
Chapter 5 Conclusion, Findings ... 79
Appendix A : Source Code of Stock and Flow M odel... 81
Reference ... 87
LIST OF TABLES
Table 2.1: Intended Nationally Determined Contributions (INDC) in Paris Agreement as of
2 0 15 ... 18
Table 2.2: Target of C02 Emission in 2030 in Japan ... 19
Table 2.3: Breakdown of RE100 Members in 2017 ... 23
Table 2.4: G oal of RE100 M em bers... 23
Table 2.5: Cost Comparison of Solar Power and Wind Power in 2016 ... 27
Table 2.6: Electric Chief Engineer in Japan... 27
T able 2.7: Characteristics of T G C ... 32
Table 2.8: Purpose and Means of PPA, TGC, Cap & Trade and Carbon Offset ... 32
Table 3.1: Key Factors and the Responsibility for Each Phase ... 60
LIST OF FIGURES
Figure 1.1: Transition of Population and Energy Consumption ... 13
Figure 1.2: Historical Energy Consumption ... 14
Figure 1.3: Comparison of the Renewable Energy Ratio in the Generated Electric Power A m ou n t...16
Figure 2.1: Energy Mix of Japan (FY2013 is result and FY2030 is target) ... 20
Figure 2.2: Renewable Growth in Japan after FIT Started ... 22
Figure 2.3: Comparison of FIT Price and General Electricity Price,... 22
Figure 2.4: Sim ple Concept of LCO E ... 25
Figure 2.5: Generation Cost of Japan in 2014 (Results) and in 2030 (Forecast) ... 26
Figure 2.6: L T S in Japan ... 29
Figure 2.7: Existing MTS and future investment in EU ... 30
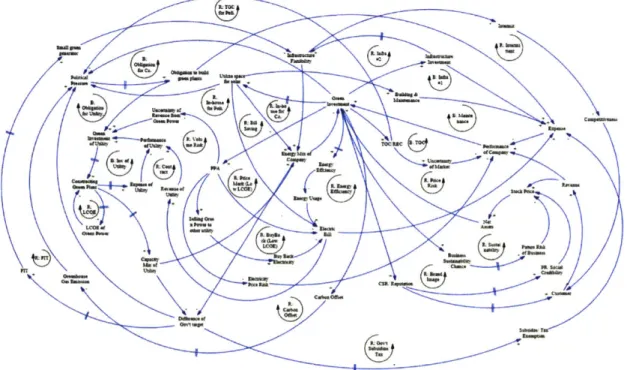
Figure 3.1: Causal Loop Diagram of Energy Shift to Renewables ... 33
Figure 3.2: Causal Loop Diagram of the Company Internal Subpart ... 34
Figure 3.3: Causal Loop Diagram of the Relationship Loops of Company and Utility ... 37
Figure 3.4: Causal Loop Diagram of the Relationship Loops of Company and Political Parts ... 4 0 Figure 3.5: Causal Loop Diagram of the Relationship Loops of Company and Infrastructure ... 4 3 Figure 3.6: Transition of Electricity Generation in the Netherlands... 46
Figure 3.7: Energy Portfolio of the Netherlands in 2015... 46
Figure 3.8: Export and Import of Electricity in Netherland... 47
Figure 3.9: Causal Loop Diagram of Case 1 (NS and Eneco)... 48
Figure 3.10: Fig 3.9 Causal Loop Diagram of Case 2 (Google)... 51
Figure 3.11: Transition of Electricity Generation in Japan... 52
Figure 3.12: Energy Portfolio of Japan in 2015 ... 53
Figure 3.13: Projection of the Network Development Plan up to F.Y.2025...54
Figure 3.14: Causal Loop Diagram of Case 3 (RICOH) as of 2018... 56
Figure 3.15: Causal Loop Diagram of Case 3 (RICOH) in step 2 ... 58
Figure 3.16: Causal Loop Diagram of Case 3 (RICOH) in step 3 ... 59
Figure 3.17: Key loops of each phase... 61
Figure 4.1: Stock and Flow M odel ... 63
Figure 4.2: Transition of Energy Mix in Japan and its Target for 2030... 69
Figure 4.3: Cost of Non-Renewables and Renewables for Sensitivity Analysis ... 70
F igure 4.4 : R elative C ost... 7 1 Figure 4.5: Potential Renewable Capa. Increase... 72
Figure 4.6: Results of Non-Renewable Consumption: Unable to Substitute, and Able to S u b stitu te ... 7 2
Figure 4.7: Shift to Renew ables ... 73
Figure 4.8: G ap Fraction of Energy M ix ... 73
Figure 4.9: Energy Mix of Management Target of Company ... 74
Figure 4.10: Miscellaneous Results of Sensitivity Analysis ... 75
Figure 4.11: Enlarged Relative Cost and Potential Renewable Capa. Increase ... 76
Figure 4.12: Relationships of Late Renewable Shift Starts and the Intensiveness of Dynamics ... 7 7 Figure 4.13: Comparison of Energy Mix (Nominal) and Gap Fraction of Energy Mix ... 78
LIST OF ACRONYMS AND ABBREVIATIONS
ANRE Agency for Natural Resources and Energy
CLD Casual Loop Diagram
EU Europe Union
FEPC Federation of Electric Power Companies
FIT Feed-in Tariff
GCWG Generation Cost Working Group
GHG Greenhouse Gas
IEA International Energy Agency
INDC Intended Nationally Determined Contributions
LCOE Levelized Cost of Electricity,
LTS Longitudinal Transmission System
METI Ministry of Economy, Trade and Industry
MTS Mesh Transmission System
NS Nederlandse Spoorwegen
OCCTO Organization for Cross-regional Coordination of Transmission Operators,
O&M Operation and Maintenance
PPA Power Purchase Agreement
REC Renewable Energy Credit
TGC Traceable Green Certificate
Chapter 1
Introduction
1.1 Motivation
Increase of the Energy Consumption
Throughout history, population growth has increased the demand of energy consumption. Starting to use coal triggered the acceleration of energy consumption after the Industrial Revolution. Also, expanding the usage of oil accelerated in 1960s. Figure 1.1 [1] indicates that this accelerating trend will last for the future.
Energy Consumption and Population
500 450 6.800 400 5.800 350 300 4.800 250 200 ; 150 2.800 100 -1.800 50
0
0.800 1800 1850 1900 1950 2000 YearFigure 1.1: Transition of Population and Energy Consumption
(Source: Earth 104)
Limitation of Traditional Energy
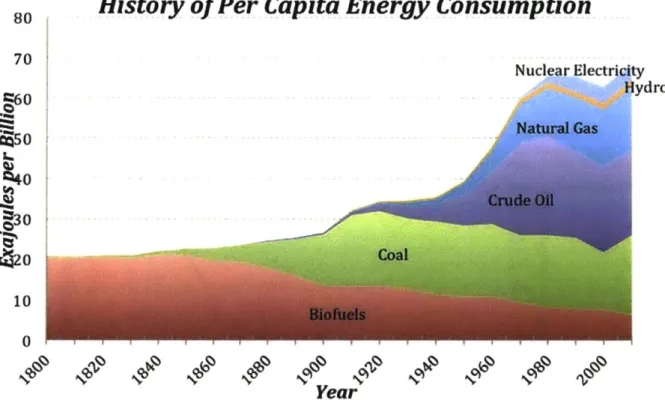
Most electricity is generated by fossil fuels such as coal, natural gas and oil (Figure 1.2 [1]), but these sources have negative effects on the environment, including global warming--one of the biggest challenges facing human beings-and the increase of greenhouse gas emissions caused by the burning of fossil fuels. Additionally, even though new oil fields
and new a type of fossil fuel (shale gas) have been identified, these resources are limited. As a result, using fossil fuels creates two problems: pollution of the environment and a draining of the existing fuel supply. These limitations indicate that the traditional energy cannot sustain human activities in the same way for the future.
History
of
Per Capita Energy Consumption
80 70 Nuclear Electricity Hydro 60 85 Natural Gas
?40
Crude Oil 130 420 Coal 10 0Year
Figure 1.2: Historical Energy Consumption
(Source: Earth 104)
Shift to Renewable Energy
Several methods exist for preventing the negative impact for the Earth, such as saving energy or using carbon offsets. However, consuming renewable energy instead of traditional energy (hereafter, the renewable shift) is the most effective strategy when considering the sustainability of human activity and the environment of the Earth. One strategy is a power purchase agreement, which is the collaboration project between a company and a utility, and
this strategy requires the flexibility of the grid system. Another strategy is purchasing a Traceable Green Certificate (TGC), which does not require the grid system conditions, but
TGC contains market risk. Thus, each strategy has a sweet spot based on the circumstances of
electricity industry and the policy climate.
1.2 Research Objectives
In this paper, the energy mix of a company is the main criterion of the renewable shift (i.e., how a company can increase its renewable energy instead of using traditional energy). Organizing the characteristics of several renewable shift strategies and showing their dynamics are the objects of this paper. This is because, in terms of the strategies of renewable energy shift, political sectors and public organizations introduce a variety of strategies, but there are no strategies which are effective all the time.
In the sensitivity analysis part, this study focused on the renewable shift in Japan. According to the publication by the Agency for Natural Resources and Energy (ANRE) [2], the energy mix of Japan was lower than that of the EU in 2016, which is described in Figure
1-3 [3]. However, Japan has already achieved a higher energy efficiency than US, England,
French and Germany. This fact weights the importance of the renewable shift because no other strategies than renewable shift are already relatively mature. Additionally, Japan is now reorganizing the utility industry for 2020, separating the generation part and the power grid system, which brings more dynamics to the renewable shift. This reorganizing aims at increasing the flexibility of the infrastructure (i.e., increasing the capacity and opportunities of interconnection for the next power grid system). For these reasons, the dynamics of the renewable shift are Japan is appropriate for applying this model and analyzing it for future recommendations.
100%
-
so%-40%
20%
Germany Spain UK France Italy USA Canada
ftenwebi ROW Prnwable ReroeWae RomIs f biw ae Renwftale
Enery Rtio Eingy Rego EMerg R" Ergy Ra1i Energ Roo Energ Rami Enery Rat
(2015) (2015) (2015) (2015) (2015) (2015) (2015)
30.6% 35.3% 25.9% 16.3% 39.8% 13.6% 63.8%
Sam&ne tO. *an Japin Daf ftmin 9011k FA nergy Odmof OEOD Caw" 1a2017 eto
Figure 1.3: Comparison of the Renewable Energy Ratio in the Generated Electric Power Amount
(Source: ANRE)
1.3 Research Questions
The followings are the key questions of this thesis.
- What are the common features and differences in the renewable shift projects?
- Who leads and invests for the renewable shift?
- What factors accelerate the renewable shift?
1.4 Approach
The approach to the renewable shift in this paper is divided into three steps. The first step is to present the common procedures of the renewable shift by breaking it down into three phases based on the literature review, illustrated in the Causal Loop Diagram (CLD). The second step is to identify the differences of the three cases of renewable shift based on the strategies of each case, which are also presented in the CLD. The third step is to show the dynamics of the shift by stock and flow model of System Dynamics.
1.5 Thesis Outline
This thesis is organized as follows. Chapter 2 introduces both political and private methods to increase the usage of renewable energy, and the key factors. Chapter 3 analyzes the case and results of the renewable shift by Casual Loop Diagram, and also shows some phases for the renewable shift and the different key feedback loops of dynamics by applying
CLD for some cases. Chapter 4 shows the stock and flow model of the renewable shift to
consider the dynamics and interaction of company, utility and the related factors. The results of the renewable shift are analyzed to evaluate results and make forecast to prevent the future
risk. Chapter 5 summarizes the key findings of this research and makes some
Chapter 2
Strategies of Renewable Shift and Key Factors
2.1 Political Approach2.1.1 Paris Agreement
The Paris Agreement is the first framework agreed by representatives of 196 parties of the United Nations Framework Convention on Climate Change (UNFCCC) on December 12,
2015. The purpose of the Paris Agreement is to mitigate global warming by settling the
long-term temperature goal. The Paris Agreement also mentioned the global peaking shift, reaching global peaking of greenhouse gas emissions (GHGs).
For these goals, each country decided their own contributions, which were described as the Intended Nationally Determined Contributions (INDC). countries will submit their
INDC every five years; the next submission will be 2020. The targets of all the countries
submitted in 2015 are summarized in Table 2.1 [4].
Table 2.1: Intended Nationally Determined Contributions (INDC) in Paris Agreement as of 2015
Country Reducing Target
USA Reducing GGE by 26-28% based on 2005 by 2030
*EU Reducing GGE by 40% based on 1990 by 2030
China Setting GGE peak to approx. 2030 (Effort to shift peak earlier)
Reducing GGE/GDP by 60-65% based on the 2005 by 2030
Japan Reducing GGE by 26% based on 2013 by 2030, and 25.4% based on 2005 by 2030
India Reducing GGE/GDP by 33-35% based on the 2005 by 2030
(Source: UNFCCC)
*EU and its Member States: Belgium, Bulgaria, Croatia, Czech Republic, Denmark, Germany, Estonia,
Ireland, Greece, Spain, France, Italy, Cyprus, Latvia, Lithuania, Luxembourg, Hungary, Malta, Netherlands, Austria, Poland, Portugal, Romania, Slovenia, Slovakia, Finland, Sweden, United Kingdom
2.1.2 Political Target for Each Sector
Based on the Paris Agreement, some countries settled the breakdown target for each sector. In case of the Japanese government, the Ministry of Environment indicated the targets
of GGE for each industrial sector. Table 2-2 [5] shows the C02 emission target of each sector.
Additionally, since using more renewable energy and thoroughly saving energy is one of the important strategies for reducing GGE, the energy mix was also set as the target for the Paris Agreement by Japanese government. Figure 2.1 [6] presents the detail targets of energy mix and energy saving. However, there is no obligation of failing to reach to these targets as of
2017.
Table 2.2: Target of C02 Emission in 2030 in Japan
Target of 2030 Result in FY2013 Result in FY2005
[Mton] [Mton] [Mton]
Industrial Sector 401 429 457
Non Industrial Sector 122 201 180
Transportation Sector 163 225 240
Utility 73 101 104
Electric power demand
Thorough energy efiiency (O PO- a and conervation 196.1 Won kWh 1. huNunhui 17% bwe whan b rt
r
-conserv "lowre 17% acc W rSY 1 17U I1% 88ccWPwv ,-- -MuA Mmuu cos n%Power source mix
(auipmmrgeerilue G, 1,rS~nwim m0w2wi " fa % Da~ V% 7 O .2
FY20-13 FY2=3 FY20M0
(ActWaW velue) 'Valus - wapumw.
Figure 2.1: Energy Mix of Japan (FY2013 is result and FY2030 is target)
(Source: ANRE)
2.1.3 Feed-in Tariff (FIT)
Feed-in Tariff (FIT) is the policy mechanism to accelerate the usage of renewables and provide inexpensive cost for consumers. The generators can sell as much as of their renewable energy as they produce at the fixed price for a long time, because producers are applied to the long-term contract guaranteed by government. Also, the government can adjust the selling price to the technology progress or climate of each renewable. The difference cost of fixed price and actual generating price are compensated for by all electricity consumers based on their consumption volume [7]. This framework reduces the uncertainty of the investors of renewables.
The benefit of FIT is not only accelerating the investment for renewables and increasing the usage of renewables, but also reducing the traditional energy. Due to the FIT,
the price of electricity from renewables can be cheaper than that from the existing non-renewables such as thermal power.
In contrast, the negative point of FIT is that it may trigger a dramatic increase of renewables over the grid capacity. Since the output of renewables fluctuates, producers sometimes generate more than demand and sometimes cannot generate more than expected. This point is discussed in Section 2.3.2 as the Japanese case in this thesis.
FIT in Japan
The Japanese government decided to introduce FIT for solar power in 2009 and
spread it to all renewable energy in 2012. Figure 2.2 [8] shows the effects of FIT in Japan.
Before FIT started, two schemes to increase renewable energy were available in Japan, Renewable Portfolio Standard System and Excess Electricity Purchasing Scheme. These schemes brought the 5%-9% growth rate of renewable energy, but FIT accelerated the growth rate more [8]. Figure 2.3 [8] illustrates the decreasing of the FIT price which is forecasted to be equal to the household electricity price in 2019. These two figures present the turning point of FIT in Japan. In fact, Japanese government revised the existing FIT in 2017, but FIT still plays an important role to push forward the energy mix in Japan.
Renewable Ene (10.000 M 5"0 4500 4000 3500 3000 2500 2000 1500 1000 S00 0
rgy Facilities in Operation
*Sotar PV
*Wind
powerBiomass
* Geothermal power Small and medium-scale hydro power
6
1
Averageannual grwth rawe Average annual growth rate
5N
LL~i
I
.
Excess Electrkity Purchasing Scheme Feed-in Tariff Scheme
Renewables Portfobo Standard RPS1sucuSY
Figure 2.2: Renewable Growth in Japan after FIT Started
(Source; METI)
-*-Fixed Selling Price in FIT
-e- General Electricity Price
20 -
-2012 2013 2014 2015 2016 2017 2018 2019
FY
Figure 2.3: Comparison of FIT Price and General Electricity Price
(Source; METI) 45 40 35 30 25
701, 101, -to 10
10
101,
2.2 Private Approach 2.2.1 RE100
RE100 was established in 2014 by The Climate Group (an NGO) as the global initiative for consuming only renewable energy. The goal of The Climate Group is "A world of under 2*C of global warming and greater prosperity for all, without delay" [9].
According to the annual report of RE 100 in 2017, 87 companies joined RE 100. The companies of RE100 have the diversity of industry, which is shown in Table 2.3 [10]. RE100 shares the knowledge and business information of renewables for the REI00 members such as strategies of dealing with energy costs. The members of RE 100 decided their goals on their own. Table 2-4 [11] presents the examples of the targets of RE100 members.
Table 2.3: Breakdown of RE100 Members in 2017
Sector Number of Members
Financials 23 Consumer Discretionary 17 Information Technology 15 Industrials 11 Consumer Staples 8 Materials 6 Health Care 4 Telecommunication Services 3 Total 87 (Source: RE100)
Table 2.4: Goal of RE100 Members
Company Nationality Industry Target Notes
Google US IT 2017 Achieved 100% renewable energy in
2017
UBS Switzerland Bank 2020 100% powered by renewable energy by 2020
Anheuser-Busch Belgium Brewer 2025 100% of the company's purchased
InBev electricity from renewable sources by
2025.
ASKL Japan Logistics 2030 Long-term goal; 100% renewable
electricity by 2030. Interim goal; 80% by 2025.
Unilever British, Dutch Consumer 2030 100% of electricity purchased from the products grid from renewables by 2020. Sourcing 100% of its energy from renewables by 2030.
Adobe US IT 2035 Entirely renewable electricity by 2035
DAIWA HOUSE Japan Housebuilde 2040 100% renewable electricity by 2040. rs
RICOH Japan multinational 2050 Long-term goal; 100% renewable
electronics electricity by 2050. Interim goal; at least 30% by 2030.
(Source: RE 100)
2.3 Key Factors to Energy Shift to Renewables
2.3.1 LCOE
Levelized Cost of Electricity (LCOE) can measure the lifetime costs of all generators and calculate the present value of the total cost including building and operating a power plant thorough their lifetimes. Because of these features, LCOE widely spread to evaluate the cost of several electricity sources. The calculation method of LCOE is defined as the difference cost of the total revenue and lifecycle expense divided by its total generating volume; thus, the unit of LCOE is $/kWh. This calculation reflects the idea of present value
and discount rate. Figure 2.4 [12] describes the simple concept of LCOE, and LCOE is calculated as below. [12] E t+Mt+Ft LCE t=1 (1+r)t LCOE = En T t t=1 (1+r)t
It = Investment expenditures in year t (including financing)
M= Operations and maintenance expenditures in year t
Ft = Fuel expenditures in year t Et = Electricity generation in year t
r = Discount rate
n = Life of the system
(Source DOE)
Energy System
x $$$ Annual
Initial Costs Expenses
Including Financing ($25)
($100)
L
Annual Cost Per Year($125)
$
LCOE
($/MWh)
Figure 2.4: Simple Concept of LCO
Site Characteristics/ Resources Annual Energy Production (1000 kWh) E (Source DOE)
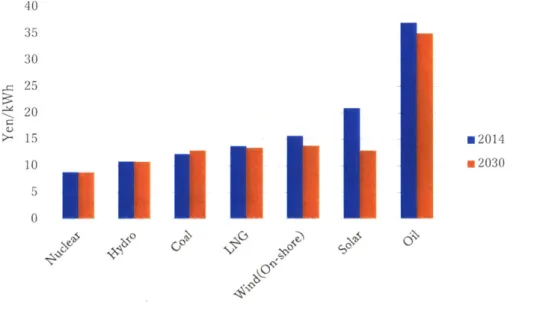
High generation cost of renewables in Japan rather than non-renewables
Generation Cost Working Group, subcommittee of the ANRE organized, published the examinations of the generation cost of Japan based on LCOE. This examination includes
the results in 2014 and the forecast of 2030, which is summarized in Figure 2.5 [13]. The result is that the generation cost of renewables in Japan in 2014 was expensive than the traditional non-renewable. However, the renewables in Japan will decrease in 2030; generation cost of solar power will be approximately that of coal, and that of wind power will be approximately that of LNG. 40 35 30 .e 25 -~20 15 m2014 10 m2030 5 0
Figure 2.5: Generation Cost of Japan in 2014 (Results) and in 2030 (Forecast)
(Source: GCWG)
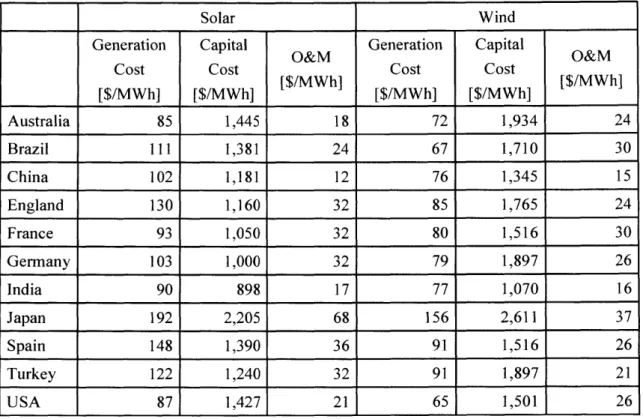
High Generation Cost of Renewables in Japan compared to other Countries
Table 2.5 [14] [15] presents the comparison of renewable generation cost in other countries and shows the cost of renewables in Japan is more expensive than in other countries. Especially, the capital cost and Operation and Maintenance (O&M) cost are the main factors of high generation cost in Japan. For example, the O&M cost of solar in Japan is double that of Germany, for two reasons: undeveloped O&M restriction in Japan, and maintenance labor cost. Several O&M companies exist in Japan, which is the result of no convergence of O&M service and price standard. Also, the safe regulation in Japan requires a utility to have an
Electric Chief Engineer, as prescribed by Electric Industry Law. The Electric Chief Engineer must obtain a license from METI based on the utility's voltage, as described in Table 2.6 [16]. This certificate system of Electric Chief Engineer is unique in Japan and pushes the O&M labor cost.
Table 2.5: Cost Comparison of Solar Power and Wind Power in 2016
Solar Wind
Generation Capital O&M Generation Capital O&M
Cost Cost Cost Cost
[$/MWh] [$/MWh] [$/MWh] [$/MWh] [$/MWh] [$/MWh] Australia 85 1,445 18 72 1,934 24 Brazil 111 1,381 24 67 1,710 30 China 102 1,181 12 76 1,345 15 England 130 1,160 32 85 1,765 24 France 93 1,050 32 80 1,516 30 Germany 103 1,000 32 79 1,897 26 India 90 898 17 77 1,070 16 Japan 192 2,205 68 156 2,611 37 Spain 148 1,390 36 91 1,516 26 Turkey 122 1,240 32 91 1,897 21 USA 87 1,427 21 65 1,501 26 (Source: METI)
Table 2.6: Electric Chief Engineer in Japan
Class Permission to construct, maintenance and
operation
First class Chief Electric Engineer's License All voltage
Second class Chief Electric Engineer's License Less than 170kV
Third class Chief Electric Engineer's License Less than 50kV
(except for plant which generates more than 5000kW)
2.3.2 Infrastructure Flexibility
The term infrastructure is used here to refer to the overall power sending system including the transmission wire and grid operation system. The manager of infrastructure has an obligation to maintain the voltage and frequency, which are usually regulated or standardized by the electricity power law of each company. Thus, just connecting to the transmission is not enough to increase the amount of transmission capacity.
Infrastructure has two types of systems; Mesh Transmission System (MTS), and Longitudinal Transmission System (LTS). Figure 2-6 [17] illustrates that the infrastructure of the EU is the appropriate example of MTS and that of Japan of LTS. Each system has both advantages and disadvantages. As Figure 2-7 shows, since the MTS has more path than LTS, connecting to other grid systems by MTS is relatively unchallenging compared to LTS under the circumstance of a sophisticated control system. However, once an accident happens, LTS can recover from an outage relatively faster than MTS because the electricity flow of LTS is simpler than MTS, taking less time to find the point of accident and the way to recover. As of
2018, the infrastructure of Europe still has the plan to grow by 2040 to increase their
flexibility. [18]
Especially for Japanese infrastructure, not only LTS, but the difference of frequency also increases the difficulty of connecting to the next grid. The frequency of the east part of Japan is 50Hz, and that of the west part is 60Hz. This is because the electricity company of east part of Japan that started their business in Tokyo and referred to Germany's standard, 50Hz. On the other hand, that of west side launched their business in Osaka and referred to the US standard, 60Hz. Since then, the Japanese economy has developed, sprawling from the larger cities, Tokyo and Osaka, and the infrastructure of electricity was developed as well. Thus, Japan still has the two types of frequency, which ss the unique point in Japan to prevent
it from connecting to the next grid. N4 ora Ti ak L 1k : 1ranwi5sonUne6OvI - TrunsnussionUne0s4kv-27k0 - DC Transntuion tie * Svwt#dng Stwton at Substatbn * hrequencyCotwerter FadityF.C
a AC-DC Converte Fadlilty
FL
F.C F4
Figure 2.6: LTS in Japan
(Source: FEPC)
I EE BEE LUT
\\
DI/
*
HUw aso ESK ( ur :eso ) 3ME2.3.3 Power Purchase Agreement (PPA)
Power Purchase Agreement (hereafter, this is called 'PPA') is used in a broadly meaning in this thesis and defined as the contract between utility and electricity consumer. PPA is one of the contract of financial arrangement and usually lasts for a long term. Not only purchasing electricity from utility, but the companies can select the source of electricity including renewables. In this thesis, PPA of renewables plays an important role because this contract has benefit for each other especially reducing uncertainty.
The contract conditions depend on the purpose or power balance of company and utility. For electricity consumers, PPA usually guarantees the electricity price and volume from renewables during its validation, which reduces the price and volume risk. For utility, since the demand of renewable guaranteed by the contract, the uncertainty of investment reduces.
2.3.4 Traceable Green Certificate (TGC)
Traceable Green Certificates (TGC) is the method by which the added value of renewable energy can be securitized, and TGC can trace the rights of the contribution to environmental protection. TGC is sometimes described as Renewable Energy Certificate (REC). The basic idea of TCG and REC is that the electricity from renewable energy has two values: electricity and less environmental damage, and the latter environmental value can be securitized and tradable. As the consumers purchase the TGC when they use the electricity from a non-renewable source, their electricity usage from the non-renewable can change to that from renewables with a premium. The premium reduces the generation cost of renewables for the utility. In Japan, the price was 3-4 yen/kWh in 2016 [19]. The
Table 2.7: Characteristics of TGC
Positive Points Negative Points
- No need to construct the power plant of - Market Risk
renewables. - Need distribution cost of security (i.e.
- Easy entry/withdrawal reducing the subsidize for renewables)
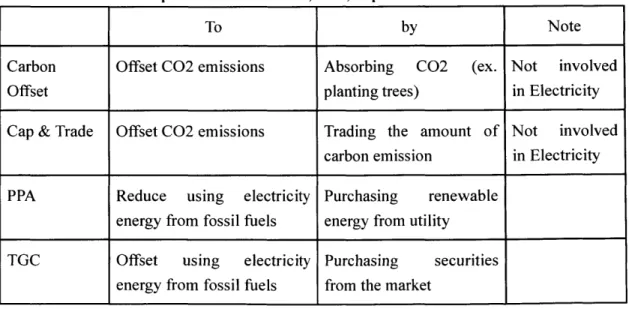
2.3.5 Carbon Offset and Cap & Trade
The main idea of Carbon Offset is that absorbing greenhouse gas anywhere can offset the GGE from human activity. Planting trees or replacing inefficient machines with high energy efficient machines are the examples of carbon offset.
Cap & Trade enables a utility to emit GGE more than the assigned amount by buying carbon credit. In this thesis, since the basic idea of Carbon Offset and Cap & Trade is focused on reducing GGE directly and not involved in electricity, Cap & Trade is dealt with as Carbon Offset.
Table 2.8: Purpose and Means of PPA, TGC, Cap & Trade and Carbon Offset
To by Note
Carbon Offset CO2 emissions Absorbing CO2 (ex. Not involved
Offset planting trees) in Electricity
Cap & Trade Offset C02 emissions Trading the amount of Not involved
carbon emission in Electricity
PPA Reduce using electricity Purchasing renewable
energy from fossil fuels energy from utility
TGC Offset using electricity Purchasing securities
Chapter 3
Causal Loop Diagram Analysis
3.1 Description of the CLD modelThe purpose of this chapter is to use the renewable shift causal loop diagram of System Dynamics to illustrate the difference of some cases of the renewable shift. As discussed in Chapter 2, public sectors and private organizations launched several targets. Also, the priorities of strategies for these targets depend on the political power balance and economic climate of each company. However, the goal of the energy shift is quite simple, which can be evaluated by the energy mix. Thus, dealing with all factors by causal loop diagram and showing the status of the energy shift are effective to compare renewable shift cases. Causal Loop Diagram analysis helps the discussion of companies eager to use more renewable energy. The overall CLD is shown in Figure 3-1 below.
3.1.1 Company Internal Loops
The Company Internal Loops are the subpart of CLD of Energy shift which is illustrated in Figure 3-1. This subpart is completed only inside companies, and is not related to utility, government, or infrastructure restriction. The main idea of this part is the motivation for the renewable shift of companies.
+Expnse-Building & Maintenance__:_Moan + Eeur Mix t le + of Com-any B: In-hous
e for Co. B: TOW
Utiliz space GrC IIe
o
for solar + TOC/REC Uncertainty Revenue
of Market
R Bill
Saving Net Assets +
EfciencyStock Price
R: Sustain
Elentric Business Sustai ability
Bill + ff ic, nability/ Chance Ess
Future Risk - of Business Energy Usage + CSR/ Reputation R: Brand P Si image + Credibility +Custier
Figure 3.2: Causal Loop Diagram of the Company Internal Subpart
Reinforcing Loop: Sustainability
Green investment increases the business sustainability, which is a positive effect for the stock of companies. Additionally, the investment can bring to the new business opportunities. (e.g. some companies with the motivation for sustainability tend to corroborate
with companies which also have the sustainability strategies if the other conditions are similar.), which increases the management sustainability because it can increase the revenue of the companies. Although there is a delay time for establishing this investment, the stock price and net assets can result in growth.
Reinforcing Loop: Brand Image
This loop describes the simplest motivation of a company for a renewable shift. Green investment is well known to improve the reputation of companies and increase social credibility, which are the trigger for increasing of customers with delay. As a result, the revenue and stock price are stimulated to increase.
Reinforcing Loop: Energy Efficiency
Saving energy is one of the famous ways to reduce the amount of energy bought. Replacing old equipment, mitigating the usage of air conditioners, or changing to daylight saving time are the examples of this loop. However, since the investment of energy efficiency usually requires R&D, some delay exists. Also, since the limit of energy efficiency exist, this loop is not effective until the break though of related technology occurs if companies achieved some extent of energy saving.
Balancing Loop: TGC
The unique advantage of Tradable Green Certificates (TGC) for the renewable shift is a simple framework; the only thing companies need to do is make a judgement about whether the price of TGCs is reasonable for the green investment of the company. This feature means that there is no need to consider the infrastructure or political subsidies; thus,
companies can decide by themselves. However, since TGC is traded in the market, the price fluctuation risk exists, which is illustrated as "Uncertainty of Market" and makes the "Performance of Company" weaker.
Balancing Loop: In-house for Co Reinforcing Loop: Bill Saving Balancing Loop: Maintenance,
These loops apply to the following situations: laying solar panels on roofs or idle space, and building wind power generators by themselves. As these renewables usually are consumed at the office under the solar roof or next to the wind power, this improves the energy mix of the company regardless of the infrastructure. Also, the amount of electricity purchased from the utility decreases. As the construction time is required for this loop before starting its operation, a delay exists in this loop. Under these types of investments, companies have an obligation to maintain the renewables, which usually use outside professional sources and increase the expense of the companies
3.1.2 Relationship Loops of Company and Utility
The Relationship Loops of Company and Utility are also the subparts of the CLD which is illustrated in Figure 3-1. This subpart is focused on how to contact Power Purchase Agreement, PPA, and how to deal with the PPA to increase the energy mix.
QgEmu h o of r
of Urllizy+ CWVA :'c
o. Eips
of
-.+ G"MhVI"2= uaco
oftm) ofE MvMai ofucMky
O- + - PPA : ee Ren
or n
opC
OEn - *A ®R&IFOW R:.i* akta Ekwk tr B:- htai +f OConstructing green power plants stimulates the investments in related materials and
devices for green energy, which decreases the supply cost. Also, as the number of projects for
building green power plants increases, the cost of construction decreases, and the duration of
LCOE incites the investment for constructing green power plants.
Reinforcing Loop: Price Merit (Low LCOE)
Some green power purchase agreements decide the price and amount of electricity beforehand; thus, the results of negotiation of electricity price can change this loop to reinforcing under the circumstance of low LCOE. If this price is cheaper than other sources of electricity, this loop is a reinforcing loop.
Reinforcing Loop: Contract
The merit for a utility when the electricity price is fixed in a green power purchase agreement is that it guarantees future income. This reduces the uncertainty of utility management and can increase stock price in the market. As a result, net assets increase, and the utility can invest more for green power. As this investment accumulates, the capacity mix of the utility increases with the delay of construction duration; then it increases the energy mix of the companies.
Reinforcing Loop: Price Risk
If a company fixes the electricity price in agreen power purchase, the future electric
price risk (i.e., price fluctuation) decreases. This means companies can change the variable costs to the fixed costs, which makes management easier and improves the performance of the companies.
Reinforcing Loop: Volume Risk
PPA provides the company and utility with the benefit of ensuring the energy volume.
After signing the contract, the volume of renewable energy is secured as long as the contract is valid. This makes the investment of renewable energy reasonable due to reducing the risk of uncertainty. A delay exists for two reasons: deciding the investment because the duration for building the team for green investment team is needed, and starting the construction because a few years are needed to start the operation of a green power plant.
Balancing Loop: Inv. of Utility
As a utility invests in green power, the expense of the utility increases, which results in a negative effect for performance of the utility.
Reinforcing Loop: Buy Back (Low LCOE)
A company can sell the green power that it purchased based on a green power
purchase agreement, then consume the same amount of nonrenewable energy. This strategy can offset the C02 emissions of a company. Even though strong regulation exists for new entry to green power generator, or the grid system is not mature, companies can offset their emissions. This strategy is effective where the LOCE is lower than traditional energy, because the difference of selling renewables and purchasing non-renewables can be a loss for the companies.
3.1.3 Relationship Loops of Company and Political Parts
The Relationship Loops of Company and Political Parts illustrates the interaction of the company and political influence including subsidizing and political pressure. (i.e. How government influences a private company by growing the ecosystem of renewables and pushing the energy mix to the political target.)
Obligation to build green plants
Green +
Investment
of Utility B: Obigati
Political on for Co.
Pressure R: TGC + - + for poli.
B: TGC/REC
Obligation R: Performance
for Utility. Greenhouse carbon of Company
+Gas
Constracting Green Plant
R: In- +Expense
use for Carbon Offset'--- Green Investment Utilize space + poli,
for solar
R: Gov't
Capacity Mix * Mix of Subsidize
of Utility + company + Tax
Infraistructure
Flexibility R:F
Small green-generator
Difference of FIT Subsidze/ Tax
GoVt target Exemption
Figure 3.4: Causal Loop Diagram of the Relationship Loops of Company and Political Parts
Reinforcing Loop: FIT
When the energy mix is different from the target decided by the government, FIT, Feed-in Tariff, is one of the effective ways to increase the renewable supply, which usually
has a delay due to the decision-making of the government. Based on the characteristic of FIT, FIT pushes the small green generator such as the private house, which sets the solar panel on the roof with the delay of setting the solar panel. Then, the increase from the small renewable generator makes the grid system more flexible, which enables a company to acquire the wide range of renewables.
Reinforcing Loop: Gov't Subsidy/Tax
When the energy mix is different from the target decided by the government, subsidies and tax exemptions with huge delay for decision-making are also effective ways to push the energy mix forward. These strategies reduce the expense of a company, so this is a reinforcing loop. However, subsidization and tax exemption can prevent economic competition and make the political power unbalanced. Thus, deciding the subsidization and tax exemption should be carefully considered; thus, this delay is huge.
Reinforcing Loop: In-house for poli.
Starting to consume in-house renewables increases the energy mix for a company, which reduces the political pressure.
Reinforcing Loop: TGC for poli.
Purchasing TGC/REC reduces the political pressure for a company and obligation for renewables, which reduces the risk factor to increase the future expense.
Reinforcing Loop: Carbon Offset
carbon gas emissions with a delay due to the growth of trees. After reducing CGE, the political pressure also decreases.
Balancing Loop: Obligation for Utility Balancing Loop: Obligation for Co.
If the capacity mix of the utility is lower than the target of the government, the
government may force the utility and company to invest the green power plant to increase the capacity mix, which increases the expense of them.
3.1.4 Relationship Loops of Company and Infrastructure
The Relationship Loops of Company and Infrastructure illustrate the interaction of the company and infrastructure including the flexibility of the grid system.
Intermit
-Competitiveness Inbasructtrt Flexibility Im-esiment + \+ CustomerB: Infra s2 B: Infral R: Intermittent
Energy Mix of Company -Performance --of Company Net Assets + Stock Price
Figure 3.5: Causal Loop Diagram of the Relationship Loops of Company and Infrastructure
Balancing Loop: Infra #1
Green Investment of a company increases Infrastructure Investment, but it also increases the expense of a company. As a result, it affects Performance of company negatively.
Balancing Loop: Infra #2
Infrastructure Investment increases the flexibility usage of the grid system and makes power exchange easy. This increases the Energy Mix of company because a company
can get a wide range of renewable sources. As the Energy Mix grows, the green investment decreases.
Reinforcing Loop: Intermittent
In general, the negative factor of using renewable energy is the intermittency of the electric supply, especially for companies with an immature grid system. Intermittency can prevent normal service for customers. As a result, the competitors of the companies are getting power for markets, and the revenue of the companies will decrease.
3.2 Application for Casual Loop Diagram
The purpose of application for Casual Loop Diagram is to illustrate the difference of some renewable shift cases based on their strategies and related circumstances of that renewable shift.
3.2.1 Case 1: NS and Eneco
Background of Case 1
Nederlandse Spoorwegen (NS) is the railway company of the Netherlands, and Eneco is a utility in the Netherlands. NS only provides railway transportation services for passengers. The maintenance of rail infrastructure and freight service operations are not within the scope of NS. The revenue of NS is 5.1 billion Euro in 2017. Also, NS operates international rail services from the Netherlands to nearby countries. [20]
Although an electric railway system already has advantages compared with other transportations in terms of environment, reducing greenhouse gas is still an important challenge for all industrial sectors including a railway company. NS achieved all their trains being operated by 100% renewable sources as of January 1, 2017 by the contracts with Eneco, which was the first and is still only case of a railway company operating its trains by completely green energy. As Eneco built the new wind power farm for the renewable shift of
NS, NS can operate all their trains by green energy [21]. Furthermore, since the plan of the
wind power construction by Eneco proceeded earlier than planned, the NS completed the energy shift in January 1, 2017 instead of 2018 [22] .
Energy Mix of the Netherlands
which aimed at energy liberalization. Then, the law of electricity was revised in 2004 and the Netherlands achieved the complete energy liberalization. [23] Figure 3.5 shows the transition of generating volume in the Netherlands after 2005. Figure 3.6 [24] shows the detail energy portfolio in the Netherlands in 2015. Only 1.2% of Energy is generated from renewables. As Figure 3.6 and Figure 3.7 [25] illustrate, analyzing the achievement of NS and Eneco provide several insights for companies that try to make a renewable shift, because renewable sources are not a main source in the electricity portfolio in the Netherlands.
140000 m Other 120000 m Wind 100000 M Solar PV 80000 m Hydro E Nuclear 60000 m Waste 40 Biofuels s Gas 20000 Oil 0 ECoal 2005 2006 2007 2008 2009 2010 2011 2012 2013 2014 2015 Figure 3.6: Transition of Electricity Generation in the Netherlands
(Source: IEA) Nuclear 1.5% BIofUels/waste 4.9% /Geothermal/soar/wInd 1.2% 15.0%
Figure 3.7: Energy Portfolio of the Netherlands in 2015
(Source: IEA)
Infrastructure (Grid System) of the Netherlands
The grid system in the Netherlands is connected to those of other countries. Figure 3.8 [24] shows that approximately 15%-30% of electricity is imported and the export of
electricity grew from 5% to 20% in the last decade.
140000 35% 120000 30% 100000 25% Total Generation 80000 20% Imports 60000 15% Exports -Import Rate 40000 10% -Export Rate 20000 5% 0 0% 2005 2006 2007 2008 2009 2010 2011 2012 2013 2014 2015
Figure 3.8: Export and Import of Electricity in Netherland
(Source: lEA)
Contract of NS and Eneco
NS signed a contract amounting to 6194 million to Eneco for ten years (2015-2024) [26]. Although the energy mix of NS was relatively higher as early as 2015, which was
approximately 50%, the purpose of the contract is to aim at operating all trains by green power.
[22]
The contract mainly covers the following three points in the scope of this thesis. The first point is electricity price. The contract provides the almost fixed price without fluctuations by market uncertainty for 10 years. The next point is energy volume. The electricity volume of the previous year is referred to as the volume forecast of the next year.
The last point is an option. NS has an option to review or discard the contact in 2019 to avoid the risk of uncertainty or unexpected events.
The source of green power in the contract was new wind power plants in the Netherlands, Sweden and Belgium. Half of them are from the Netherlands, and the other half generate from abroad. This dispersed production outside of the Netherlands aims at not
limiting the existing other renewable projects. The flexibility of infrastructure, which Figure
3.7 presents, (i.e., electricity export and import of the Netherlands) enables this strategy.
Applying the Causal Loop Diagram
Applying the circumstances stated above, Figure 3.9 shows the matured loop and ley loop for the contract of NS and Eneco.
Grnn: Matuned Loop JLTW
Red: Key Loop of Case 1
Figure 3.9: Causal Loop Diagram
of
Case1
(NSand
Eneco) Green Loop: Matured for case 2, Red Loop: Key Loops for case 2Key loops; B: Inv. of Utility
The energy mix of a utility is almost the same as that a utility can provide, because
the volume of in-house generation is relatively or quite small rather than that of purchasing electricity from utility; thus, how a utility can follow the cycle of Inv. of Utility loop faster plays an important role for increasing the Capacity Mix of the Utility. In fact, the first plan of
NS and Eneco targeted to complete renewable shift in 2018, but it actually completed in 2017.
Thus, investment of the utility was the key factor of the project schedule management.
Key loops; R: Contract Key loops; R: Volume Risk
Key loops; R: Price Risk
The detailed contents of the contract between NS and Eneco are the most important factors, and they can show in the three loops: Contract loop, Volume Risk loop, and Price Risk loop.
Matured loops; R: LCOE
Matured loops; R: Price Merit (Low LCOE)
The renewable LCOE of the Netherlands is cheaper than that of traditional energies, which is the price merit of this contract.
Matured loops; R: Infra #2 Matured loops; R: Intermittent
The maximum amount of energy Eneco provides is 1.4TWh, which is equivalent to only I % of energy volume of the energy consumption of the overall Netherlands [27], and
half of it is generated outside of the Netherlands, in Finland and Belgium. NS made the most use of flexible infrastructure.
Reference loops; R: Energy Saving
NS has set the energy saving target as 35% less energy by 2020 when compared to
consumption in 2005. To achieve this target, NS plans to be 50% more efficient in running its trains than in 2005 by 2020. Although this strategy reduces the total amount of energy consumption, it was not very effective for the renewable shift.
3.2.2 Case 2 (Google)
Background of Case 2
Google achieved the shift to having all of the energy consumption required for is business coming from completely renewable sources in 2017. The most unique point of the energy shift at Google was the strategy. The main concept of Google is to offset their energy usage by purchasing renewable energy (i.e., Google purchased the same amount of green energy as it consumed, and Google resold the renewable energy to the local utility) [28]. Since Google does business all over the world, the difference of regulation or standard makes it difficult to consume completely renewable energy. Even if Google could achieve this in some countries, it must have a huge delay time. Thus, focusing on specific regional data such as energy portfolio or infrastructure flexibility is not appropriate, and so we only focus on the renewable shift model Google made. Google finalized their achievement as promoting the renewable energy consumption by building the new type of power purchase model, which can apply to other companies [29].
Applying the Causal Loop Diagram
Figure 3.10 shows the matured loop and key loop for the Google power purchase model.
Figure 3.10: Fig 3.9 Causal Loop Diagram
of
Case 2 (Google) Green Loop: Matured for case 2, Red Loop: Key Loops for case 2Key loops; R: Buy Back (Low LCOE) Matured loops; R: LCOE
Matured loops; R: Price Merit (Low LCOE)
As stated above, the low LCOE is one of the important factors in this case because it
can be a loss for a company if the LCOE of renewables is relatively higher than the
traditional energy. Under the circumstances of low LCOE, the Price Merit loop is also
3.2.3 Case 3 (RICOH) Background of Case 3
RICOH is the first company in Japan which joined RE100, and has the target that RICOH
will consume only renewable energy in their factories and offices by 2050.
Energy Mix of Japan
Figure 3.11 [24] illustrates the transition of generating volume in Japan after 2005. Figure 3.12 [30] presents the detail energy portfolio in Japan in 2015. Because of the great Japan earthquake in 2011, which triggered the Fukushima nuclear power accident, the share of nuclear decreased dramatically after 2011, and thermal power is the main source of Japanese electricity. Only 3.2% of Energy is generated from renewables.
1400000 1200000 Others Wind 1000000 a Solar 800000
m
Geothermal 0 600000 m Hydro &. Nuclear 400000 * Gas 200000 Oil 0 *Coal 2005 2006 2007 2008 2009 2010 2011 2012 2013 2014 2015 Figure 3.11: Transition of Electricity Generation in JapanNuclear 0.6% Hydro 17% Biofuels/waste 2.7% Naturalgat-,- Geothermal/solar/wind 23,3% 1.5% 27.3%
Figure 3.12: Energy Portfolio of Japan in 2015
(Source: IEA) Generation Cost of Japan
As discussed in Section 2.3.1 LCOE, the generation cost of renewable energy is more expensive than that of traditional energy in Japan. Based on the forecast of ANRE, the generation cost of solar power will be approximately that of coal, and that of wind power will be approximately that of LNG.
Infrastructure (Grid System) of Japan
The infrastructure of Japan is now remodeling. Due to the Fukushima nuclear power accident, many plants suffered and did not supply the electricity to customers. In fact, Tokyo Electric Power Company was short of its supply which was approximately 10 GWh, one fourth of demand forecast. Since the utility of Japan were divided into the area, the west part of Japan could consume electricity as usual just after the earthquake; on the other side, the east part of Japan had to stop transmission of electricity, which required the rolling outage in Tokyo in the following ten days after the earthquake. Therefore, OCCTO, Organization for Cross-regional Coordination of Transmission Operators, were established. According to the
OCCTO website, OCCTO has three steps to achieve the three goals; "Securing Stable