Volcano-induced regime shifts in millennial tree-ring
chronologies from northeastern North America
Fabio Gennarettia,1, Dominique Arseneaulta, Antoine Nicaultb, Luc Perreaultc, and Yves Bégind
aDépartement de Biologie, Chimie et Géographie, Centre d’Études Nordiques, Université du Québec à Rimouski, Rimouski, QC, Canada G5L 3A1; bAix-Marseille Université, Fédération de recherche (CNRS-3098) Ecosystèmes Continentaux et Risques Environnementaux, F-13545 Aix-en-Provence, France;cExpertise Mécanique, Métallurgie et Hydro-Éolien, Institut de Recherche d’Hydro-Québec, Varennes, QC, Canada J3X 1S1; anddCentre Eau Terre Environnement, Institut National de la Recherche Scientifique, Québec, QC, Canada G1K 9A9
Edited by Ellen S. Mosley-Thompson, The Ohio State University, Columbus, OH, and approved May 29, 2014 (received for review January 21, 2014) Dated records of ice-cap growth from Arctic Canada recently
suggested that a succession of strong volcanic eruptions forced an abrupt onset of the Little Ice Age between A.D. 1275 and 1300 [Miller GH, et al. (2012)Geophys Res Lett 39(2):L02708, 10.1029/ 2011GL050168]. Although this idea is supported by simulation experiments with general circulation models, additional support from field data are limited. In particular, the Northern Hemisphere network of temperature-sensitive millennial tree-ring chronolo-gies, which principally comprises Eurasian sites, suggests that the strongest eruptions only caused cooling episodes lasting less than about 10 y. Here we present a new network of millennial tree-ring chronologies from the taiga of northeastern North Amer-ica, which fills a wide gap in the network of the Northern Hemi-sphere’s chronologies suitable for temperature reconstructions and supports the hypothesis that volcanoes triggered both the onset and the coldest episode of the Little Ice Age. Following the well-expressed Medieval Climate Anomaly (approximately A.D. 910–1257), which comprised the warmest decades of the last mil-lennium, our tree-ring-based temperature reconstruction displays an abrupt regime shift toward lower average summer tempera-tures precisely coinciding with a series of 13th century eruptions centered around the 1257 Samalas event and closely preceding ice-cap expansion in Arctic Canada. Furthermore, the successive 1809 (unknown volcano) and 1815 (Tambora) eruptions triggered a subsequent shift to the coldest 40-y period of the last 1100 y. These results confirm that series of large eruptions may cause region-specific regime shifts in the climate system and that the climate of northeastern North America is especially sensitive to volcanic forcing.
black spruce
|
dendroclimatology|
lake subfossil trees|
Picea mariana|
temperature regime shiftsT
ree-ring chronologies are the type of proxy record most used to develop climate reconstructions covering the last millen-nium (1). These chronologies have been integrated into large-scale networks, often with additional proxies, to document the amplitude, duration, and forcing mechanisms of the Medieval Climate Anomaly, the Little Ice Age, and the recent warming trend. However, the spatial coverage of long tree-ring records must be improved to allow a better understanding of regional variations in past climate (1, 2). For example, in eastern North America, millennial climate reconstructions have been constructed from tree species and sites sensitive to drought and precipitation (3), whereas temperatures were inferred solely from low-resolution proxies, such as pollen data (4, 5). Furthermore, only tree-ring-based climate reconstructions shorter than a millennium or using chronologies poorly replicated before A.D. 1500 have been pub-lished for the entire North American boreal forest (6, 7), whereas several millennial, highly replicated, temperature-sensitive tree-ring records have been developed across the Eurasian boreal zone. This lack of data is an important issue that causes the poor rep-resentation of North America in long-term, large-scale tempera-ture reconstructions (1, 4).The feasibility of reconstructing volcanic forcing from tree-ring data has been debated, especially in regards to large and successive eruptions. Two of the largest eruptions of the last millennium, the A.D. 1257 Samalas and A.D. 1815 Tambora events, were both closely followed and preceded by additional large eruptions in 1227, 1275, 1284, 1809, and 1835 (8−11). Whereas general circulation model experiments suggest that the impacts of large and successive eruptions might have influenced climate systems for periods ranging from 20 y to several decades, or even centuries (12–16), Northern Hemisphere tree-ring-based temperature reconstructions only display negative temperature anomalies lasting between 2 and 10 y (17–20). Region-specific responses of the climate system to volcanic forcing may in part explain this discrepancy (17). For example, large and successive eruptions may have had stronger impacts on summer temper-atures in northeastern North America (hereafter NENA) than elsewhere. An extensive Northern Hemisphere network of tree-ring density chronologies supports this idea, showing that the coldest 1816 temperature anomalies occurred over the Quebec-Labrador Peninsula (21), where they may have persisted for several decades (7). The idea is also supported by the abrupt acceleration of ice-cap growth in the Eastern Canadian Arctic during A.D. 1275–1300, at the onset of the Little Ice Age, as a consequence of a series of eruptions (22). However, the lack of millennial, well-replicated, and temperature-sensitive tree-ring chronologies in the NENA sector precludes the examination of the volcano−temperature relationship in a long-term context with an annual resolution.
Significance
The cooling effect on the Earth’s climate system of sulfate aer-osols injected into the stratosphere by large volcanic eruptions remains a topic of debate. While some simulation and field data show that these effects are short-term (less than about 10 years), other evidence suggests that large and successive erup-tions can lead to the onset of cooling episodes that can persist over several decades when sustained by consequent sea ice/ ocean feedbacks. Here, we present a new network of millennial tree-ring chronologies suitable for temperature reconstructions from northeastern North America where no similar records are available, and we show that during the last millennium, per-sistent shifts toward lower average temperatures in this region coincide with series of large eruptions.
Author contributions: F.G., D.A., A.N., L.P., and Y.B. designed research; F.G., D.A., A.N., and L.P. performed research; F.G. analyzed data; and F.G. and D.A. wrote the paper. The authors declare no conflict of interest.
This article is a PNAS Direct Submission.
Data deposition: All tree-ring and temperature data can be found inDataset S1and have been deposited to the World Data Center for Paleoclimatology,http://www.ncdc.noaa. gov/paleo/paleo.html(study ID noaa-recon-16558).
1To whom correspondence should be addressed. E-mail: Fabio.Gennaretti@uqar.ca. This article contains supporting information online atwww.pnas.org/lookup/suppl/doi:10. 1073/pnas.1324220111/-/DCSupplemental. EAR TH, ATMOSPHERIC , AND PLA NETARY SCIENCES
In this study, we have built a network of six highly replicated millennial tree-ring chronologies from large stocks of black spruce [Picea mariana (Mill.) B.S.P.] subfossil trees preserved in lakes of the NENA taiga from which we developed a millennial reconstruction (A.D. 910–2011) of regional July−August tem-peratures. For this purpose, we selected homogeneous sites with infrequent and well-documented ecological disturbances (23), and sampled homogeneous subfossil and living samples to maxi-mize the robustness of our reconstruction. We then used a Bayes-ian mixture of probability distributions with dependence (also referred to as hidden Markov models or Markov switching models; see refs. 24 and 25) to detect possible regime shifts in summer temperatures triggered by series of large eruptions and to provide new insights concerning the climate history of NENA during the last 1,100 y.
Results and Discussion
Our summer temperature reconstruction for Eastern Canada (hereafter STREC) closely reproduces the warming trend of
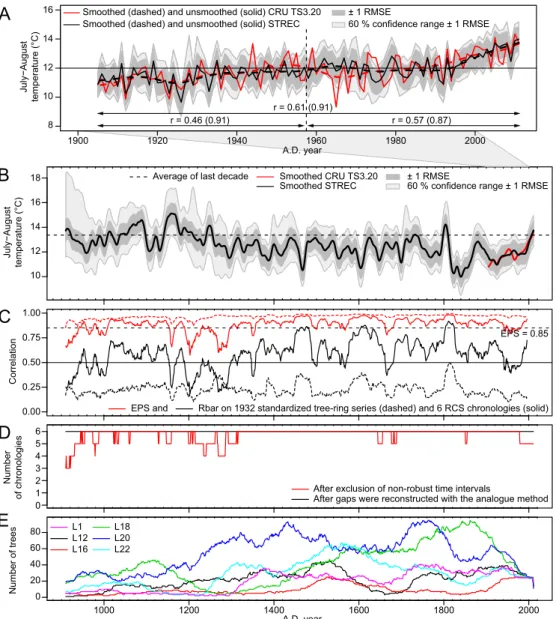
July−August temperatures over the study area during the last cen-tury (Fig. 1A), even when the region experienced one of the stron-gest increases in summer temperatures worldwide according to the gridded temperature dataset Climate Research Unit (CRU) TS3.20 (26). The correlation between STREC and the gridded July−August temperature data (1905−2011; CRU TS3.20) is highly significant (0.61,P < 0.001), even when the instrumental period is split into two subsets (1905−1957 and 1958–2011; Fig. 1A). The skill of the reconstruction in reproducing temperature data is indicated by the positive values of the reduction-of-error statistics computed with different calibration periods and on unsmoothed and smoothed datasets (Table S1). Cross-calibration verification confirms that STREC is robust and better predicts low frequencies than high frequencies (Table S1). In our study, the ring-width series of the subfossil and living tree samples were homogenized to remove the bias caused by varying sam-pling heights (seeMethods) and avoid divergence between tem-peratures and standardized tree growth (Figs. S1andS2). Spatial
1000 1200 1400 1600 1800 2000 A.D. year Number of trees L22 L20 L18 L16 L12 L1 0 20 40 60 80
E
After exclusion of non-robust time intervals
After gaps were reconstructed with the analogue method 0 1 2 3 4 5 6 Number of chronologies
D
0.00 0.25 0.50 0.75 1.00 CorrelationC
EPS = 0.85EPS and Rbar on 1932 standardized tree-ring series (dashed) and 6 RCS chronologies (solid)
B
10 12 14 16 18 Smoothed STREC Smoothed CRU TS3.20 Average of last decade60 % confidence range ± 1 RMSE ± 1 RMSE July−August temperature (°C) 1900 1920 1940 1960 1980 2000 A.D. year July−August temperature (°C)
60 % confidence range ± 1 RMSE ± 1 RMSE
Smoothed (dashed) and unsmoothed (solid) STREC Smoothed (dashed) and unsmoothed (solid) CRU TS3.20
8 10 12 14 16
A
r = 0.46 (0.91) r = 0.57 (0.87) r = 0.61 (0.91)Fig. 1. STREC reconstructed values and robustness. Observed (15 cells of the CRU TS3.20 dataset covering our sampling sites) and reconstructed (STREC) July−August temperatures in the taiga of Eastern Canada during the last century (A) and the last 1,100 y (B). Smoothed values are 20-y splines. In A, correlations between brackets refer to smoothed values. Expressed Population Signal (EPS) and Rbar statistics computed over 31-y moving windows are also shown (C), as well as replication among (D) and within (E) chronologies.
correlations show that STREC is mostly valid over the central Quebec-Labrador Peninsula within the NENA sector (Fig. 2).
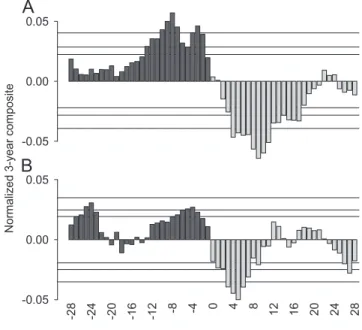
Volcanism has been the primary factor forcing changes in summer temperatures on the decadal time scale in Eastern Canada during the last millennium. Numerous cooling episodes in STREC are synchronous with episodes already reported in hemispheric temperature reconstructions and simulations in re-sponse to strong volcanic eruptions (Fig. S3). The agreement between peaks in the global stratospheric volcanic sulfate aerosol injections (9) and cold anomalies inferred by STREC is also striking (Fig. 3A). A Superimposed Epoch Analysis (SI Methods) demonstrates that the 10 strongest volcanic eruptions of the last millennium produced highly significant cooling episodes in Eastern Canada lasting for about two decades, while less intense volcanic eruptions had a shorter influence (Fig. 4). The 20 postevent summers were significantly colder than the preceding ones for 8 out of the 10 largest eruptions (P < 0.1;Table S2). For example, temperature anomalies ranged from−1.3 °C to −3.0 °C in response to the three strongest tropical eruptions of the last millennium (A.D. 1257, 1452/1453, and 1815). With about two cooling episodes per century lasting for 10–20 y with a conse-quent reduction in tree growth, the volcanic signature in the NENA taiga is comparable to the epidemic signal of the eastern spruce budworm (Choristoneura fumiferana), which is the most destructive insect in the commercial forest of Eastern Canada south of our study area (27). Therefore, volcanic forcing during the last millennium has clearly impacted net primary production and the carbon balance in the NENA forests, at least over the Quebec-Labrador taiga.
Volcanism also strongly influenced century-scale temperature variability in NENA, as shown by our Bayesian analysis of regime shifts in STREC (SI Methods). Two of the strongest eruptions of the last 1,100 y, the A.D. 1257 Samalas and A.D. 1815 Tambora events, which were followed and preceded by other eruptions, coincide exactly with the two most persistent regime shifts detected in STREC. According to the Schwarz criterion (28),
STREC is best modeled with a four-state normal Bayesian hid-den Markov model, with the two warmer and the two colder regimes largely dominating the A.D. 910–1257 and A.D. 1816– 2011 time periods, respectively (Fig. 3B and Fig. S4). Other studies based on tree-ring data have already reported tempera-ture reductions post-A.D. 1257 and post-A.D. 1815 in other regions of the world (see, for example, refs. 29 and 30), but with smaller amplitude and temporal extent than STREC. Indeed, the strong overall cooling trend obtained by fitting a linear regression model to STREC (−1.60 ± 0.11 °C per 1,000 y; estimate ± SE; P < 0.001) can be mostly attributed to the A.D. 1257 and A.D. 1815 shifts. Some proxy-based evidence has also shown that a long-term cooling trend due to orbital changes has character-ized the climate of the last 2,000 y in many regions of the world (4, 31, 32), including NENA (33). However, this cooling trend has been estimated at about−0.3 °C to −0.5 °C per 1,000 y (4, 32, 33) and is much weaker than the one of STREC. These facts, in addition to the absence of any negative trends in STREC over the A.D. 1257–1815 time period (Fig. S5), highlight the impor-tance of volcanic-induced temperature regime shifts in NENA. Along with volcanism and orbital forcing, additional factors may have contributed to the strong negative trend of STREC and the associated transition from warm to cold regimes (Fig. 3B and Figs. S4 and S5), including solar forcing (19), and the specific regional domain of STREC. Because STREC is based on several sites and because of our data management approach (see Methods), the A.D. 1257 and A.D. 1815 shifts do not seem to be influenced by local nonclimatic disturbances affecting our chro-nologies (Fig. S6).
A well-expressed Medieval Climate Anomaly (A.D. 910–1257) occurred in NENA before the A.D. 1257 Samalas event. The warmest decades reconstructed by STREC occurred between A.D. 1141 and 1170 (positive anomalies ranging from 0.89 °C to 1.80 °C with respect to the last decade) and between A.D. 1061 and 1095 (0.87–1.19 °C;Table S3). The confidence intervals of STREC for these two periods were almost all higher than the mean temperatures of the last decade (Fig. 1B). The amplitude and timing of the Medieval Climate Anomaly reconstructed by STREC also resemble the results of a pollen-based temperature reconstruction for the North American forest tundra (5), and closely correspond to a period of ice-cap melting in the Eastern Canadian Arctic (22) (Fig. 3A). Collectively, these complemen-tary data sources demonstrate that a major and prolonged climatic shift occurred over the NENA sector after a series of 13th century volcanic eruptions centered around the A.D. 1257 Samalas event. This shift marked the end of the Medieval Climate Anomaly and the beginning of the Little Ice Age in this sector.
Similarly, the series of eruptions centered around the A.D. 1815 Tambora event shifted summer temperatures to the coldest 40-y period of the last 1,100 y in NENA. The A.D. 1815–1857 episode was extremely cold in Eastern Canada, with decadal anomalies reconstructed by STREC ranging from −2.76 °C to −3.58 °C relative to the last decade (Table S3). Low solar activity during this period, that started during the Dalton Minimum, could have concurred to cause the cooling episode (34). How-ever, the regime shift observed in STREC coincides with the A.D. 1815 Tambora eruption (Fig. 3B andFig. S4). The same cli-mate shift has already been observed in a 263-y tree-ring-based summer temperature reconstruction whose sampling sites are 400 km eastward from our study sites (7), whereas a pollen-based temperature reconstruction suggests that this period was the coldest of the last 2,000 y in the North American boreal forest and forest−tundra (5). This climate shift was probably limited to the NENA sector as STREC diverges from the ensemble of Northern Hemisphere reconstructions and simulations after A.D. 1816 (Fig. S3C and D).
Although the last century reconstructed by STREC was warmer than the early 19th century, it was colder than the
-110 -100 -90 -80 -70 -60 -50 -40 30 40 50 60 70 -0.5 -0.4 -0.3 -0.2 -0.1 0 0.1 0.2 0.3 0.4 0.5 0.6 0.7 Study area • • • • • • • •
Fig. 2. STREC spatial domain. Spatial variation of the correlation between observed (CRU TS3.20) and reconstructed (STREC) July−August temperatures over the 1905–2011 period.
EAR TH, ATMOSPHERIC , AND PLA NETARY SCIENCES
Medieval Climate Anomaly (the difference between the average summer temperature of the 12th century and of the last 100 y is 1.66 °C,P < 0.001, according to the one-tailed Wilcoxon rank−sum test). In fact, STREC shows that the NENA sector experienced relatively cold conditions until late into the 20th century. This persistence of cold conditions over NENA is also suggested by the strong warming trend of the last 100 y denoting a colder starting point (Fig. 1A and B), as well as by permafrost growth during the mid-20th century on the southern shore of Hudson Strait (35) and by the lack of postfire forest recovery over the last 900 y at the northern Quebec treeline in contrast to what occurred during the Medieval Climate Anomaly (36, 37). The warming trend in our study area has accelerated over the last 30 y (+0.7 °C per decade according to the dataset CRU TS3.20). If this trend continues, then summer tem-peratures will be similar to the maximum of the last 750 y during the next decade and to the maximum of the last 1,100 y during the following one (based on STREC and the data ofTable S3).
Several hypotheses have been suggested to explain why post-eruption temperature anomalies reconstructed from tree-ring data generally express higher values than expected, including regional variations in response to volcanic events, autocorrela-tion in ring-width series (17, 18), failure of growth rings to form during volcano-induced cold summers (20), and increased tree growth caused by volcano-induced diffuse radiation (38). In this study, we observed a strong response of ring-width data to vol-canic activity, with the amplitudes and duration of negative anomalies (including persistent regime shifts) similar to model predictions. Diagnostic light rings are frequent in black spruce trees of our study area (39), thus allowing for a rigorous control
of ring dating and for identifying the occurrence of missing rings. In addition, although autocorrelation in ring-width chronologies of black spruce is high (Table 1), the results of a simple model show that its effects on the amplitude and duration of recon-structed negative temperature anomalies after volcanic events are low (Fig. S7). Instead, our results suggest that the climatic impacts of eruptions vary among regions of the Northern Hemi-sphere and that the NENA sector is especially sensitive to these impacts compared with Eurasia, where the majority of temperature-sensitive tree-ring chronologies have been previously developed. This idea is also supported by recent simulation experiments (12–16, 22), which show that large and successive eruptions may trigger cold episodes whose duration may be sustained by complex and variable sea−ice−ocean feedbacks in the North Atlantic and that the resultant northward heat transport would tend to be more severely attenuated in the NENA than in the Eurasian sectors.
Methods
Our sampling area is situated in the Eastern Canadian taiga between latitudes 53.8°N and 54.6°N and longitudes 70.2°W and 72.5°W (Table 1). According to the gridded temperature dataset CRU TS3.20 (26), this region has expe-rienced one of the fastest temperature increases on Earth during the last century. The mean July−August temperature, which is the object of our reconstruction, has increased by an average of 0.68± 0.15 °C and 0.19 ± 0.02 °C (estimate± SE) each 10 y during the last 30 and the last 110 y, respectively.
To implement our network of tree-ring chronologies, 1782 black spruce [Picea mariana (Mill.) B.S.P.] subfossil trees were sampled from six lakes of the study area and cross-dated to the calendar year. Particular care was taken in selecting and replicating sites and trees to construct a dataset
1000 1200 1400 1600 1800 2000 10 12 14 16 A.D. year July−August temperature (°C) Samalas Tambora 0 2 4 6 10 12 14 16 Posterior density -3 -2 -1 0 1 2 3
STREC (10−year spline) Volcanic sulfate aerosol Ice cap expansion dates
1000 1200 1400 1600 1800 2000 150 100 50 0 0.00 0.25 0.50 Sulfate aerosol (Tg) T emperature anomaly (°C) Calibrated 14 C PDF Ice melt
Ice melt & growth Continuous ice cover
A
C
B
Fig. 3. Volcano-induced regime shifts in STREC. Comparison (A) between STREC, a reconstruction of global stratospheric volcanic sulfate aerosol injections (9), and a reconstruction of ice-cap expansion dates from Arctic Canada (22). Detected regime shifts in STREC based on a four-component Bayesian hidden Markov model with normal probability distributions (SI Methods) are also shown (B), as well as the posterior probability density functions of the mean temperature of each regime (C). In B, each reconstructed value is assigned to the most likely regime (color dots) and the mean temperature of the last decade is shown (horizontal dashed lines), as well as the dates of the A.D. 1257 Samalas and A.D. 1815 Tambora eruptions (vertical dashed lines).
suitable for Regional Curve Standardization (RCS). The RCS method pre-serves long-term climate trends in tree-ring chronologies built with short-lived species, but requires high replication of trees belonging to a homoge-neous population not disturbed by external factors (40). The selected sites were all characterized by an old-growth riparian forest on the side of the lake protected from dominant winds, an abrupt forest−lake transition, large stocks of subfossil trees in the littoral zone, and a well-documented low fire recurrence (23, 41). This allowed the development of an exceptional net-work of climate-sensitive tree-ring data comprising six local chronologies in the same region (one per lake), each including from 75 to 586 subfossil trees and spanning from 1,238 to 1,440 y (Table 1). The living trees extending the chronologies to the present day (25 trees per site) were sampled at the same sites as the subfossil samples, and issues related to tree selection and sam-pling height were also considered (see below).
To produce the six local chronologies (Fig. S3), two radii were measured at a precision of 1/100 mm and then averaged for each tree. A spline with a 50% frequency cutoff and a time-varying response [starting at 10 y and increasing by one each year (42)] was used as a smoothing algorithm to generate the local growth curves needed for RCS standardization. All
specimens had well-preserved piths, and pith offset could easily be accounted for in the chronology development.
To guarantee homogeneity between subfossil and living samples, 25 living trees at each site were selected from among those growing near the lake-shore, as they would be the most likely to have generated subfossil stems (32). Furthermore, we considered that the growth trends of subfossil and living samples can diverge depending on the sampling height of the living trees (43), thus generating biases in the RCS chronologies. To reduce these biases, we sampled all living trees at four meters above the soil surface (i.e., the sampling height that minimized the differences between the growth trends of living and subfossil trees) and we corrected all ring-width series before standardization by subtracting the difference between the local growth curves of the living and subfossil trees (seeFigs. S1andS2).
All of the nonrobust time intervals of the local RCS chronologies were discarded, with the resulting gaps being reconstructed using the analog method (44). Most of these intervals were asynchronous among the lakes and were caused by wildfires that temporarily reduced the input of tree remains into the littoral zone (23, 41). We identified the nonrobust time intervals using the Rbar statistic (mean correlation between pairs of in-dividual series) over 31-y moving windows and discarded all intervals with negative or noncomputable Rbar values due to low replication. At lake L16, the 1978–2011 period was also discarded, as the construction of a road raised the lake water level and disturbed the riparian trees. Over the 1,102 y retained for STREC (see below), we discarded 114, 70, 52, 19, 0, and 31 y for lakes L1, L12, L16, L18, L20, and L22, respectively. The analog method used to reconstruct these gaps is commonly used in paleoclimatology to estimate missing values in proxy-climate matrices. For years where missing values are present, the procedure identifies the most similar years in the calibration period, i.e., all other years without missing values, which are then weighted according to their similarity and used to reconstruct the gaps (44). The measure of similarity is based on the Euclidian distance.
We used the CRU TS3.20 climate dataset (26) to calibrate our re-construction. The first four years (1901−1904) were excluded because of a poor fit with the tree-ring indexes due to the lack of operating weather stations at the beginning of the last century near the study area. The climate reconstruction method was based on a linear scaling procedure. Each local RCS chronology was rescaled so that its mean and SD matched those of the July−August mean temperature in the calibration period (1905−2011). The final STREC was then obtained by computing the median of the six local reconstructions. This approach attenuated the influence of local nonclimatic disturbances, as the median of the six reconstructions is not sensitive to outliers. It also obtained better cross-calibration verification results (1905−1957 vs. 1958– 2011) than a reconstruction based on a partial least squares regression, espe-cially when considering low frequencies (i.e., smoothed datasets;Table S1). Only reconstructed values subsequent to A.D. 910 were retained to limit the analyzed period to the statistically reliable interval (overall replication>53 individual se-ries and Expressed Population Signal>0.85; Fig. 1 C and E). Due to the fast temperature increase in the study area during the 20th century, the recon-structed values in the calibration encompassed a range of 4.3 °C (from 9.6 °C to 14.0 °C), and 86% of the total STREC reconstructed values are inside this range. We generated realistic time-varying confidence intervals considering two kinds of errors (Fig. 1 A and B). The first one depends on the nonperfect fit between observed and reconstructed values over the verification periods and was com-puted as the mean root-mean-square error between the two datasets. The sec-ond one is due to the variation over time of the strength of the common climate signal for each of the six local chronologies and was computed each year as the interval among the four central reconstructed values from the six chronologies. The consideration of this error produces a time-varying 60% confidence interval.
Table 1. Sampling sites and tree-ring chronologies used for STREC Site Latitude, degrees Longitude, degrees Number of trees, subfossil/living Length, A.D. MSL, years± SD
Mean ring width, 1/100 mm± SD Mean correlation, mean± SD Lag1 AC AR order L1 +53.86 −72.41 190/25 642–2011 106± 32 39± 24 0.43± 0.25 0.84 4 L12 +54.46 −70.39 220/25 572–2011 101± 32 42± 23 0.45± 0.23 0.78 9 L16 +54.10 −71.63 75/25 774–2011 112± 36 37± 20 0.46± 0.25 0.75 10 L18 +54.25 −72.38 419/25 596–2011 105± 38 38± 26 0.40± 0.27 0.76 4 L20 +54.56 −71.24 586/25 653–2011 102± 36 40± 24 0.41± 0.23 0.72 9 L22 +54.15 −70.29 292/25 650–2011 104± 38 39± 25 0.42± 0.25 0.73 6
Lag1 AC and AR order are computed over the time period retained for STREC (A.D. 910–2011). AR order, the order selected by the Akaike Information Criterion of the autoregressive model fitted to the RCS chronology; Lag1 AC, lag 1 autocorrelation of the RCS chronology; mean correlation, average correlation between standardized individual series and their respective local RCS chronology; MSL, mean segment length.
Normalized 3-year composite
-28 -24 -20 -16 -12 -8 -4 0 4 8 12 16 20 24 28
-0.05 0.00 0.05
3-year window from eruptions
B
-0.05 0.00 0.05
A
Fig. 4. STREC responses to volcanic eruptions. Dimensionless normalized 3-y composites, which are the result of the Superimposed Epoch Analysis showing summer temperature responses in Eastern Canada to the 10 strongest (A) and the 10 next strongest (B) volcanic eruptions of the last millennium deduced by ref. 9 (seeSI Methods). Each 3-y composite is labeled with the year nearest to the eruption year (e.g., 0 stands for the 3-y com-posite composed of years 0, 1, and 2 from eruption). Confidence ranges (90%, 95%, 99%) are indicated by horizontal lines. Black and gray columns mark preeruption and posteruption composites, respectively.
EAR TH, ATMOSPHERIC , AND PLA NETARY SCIENCES
The volcanic signature in STREC was analyzed using Superimposed Epoch Analysis (SEA) and Bayesian hidden Markov models. We used SEA to test the agreement between the strongest volcanic eruptions of the last millennium and corresponding cooling episodes in STREC. Our SEA was performed in the R environment as described inSI Methods. We used Bayesian hidden Markov models to identify sudden changes in the STREC time series. Such models provide an explicit mechanism to represent transitions between differ-ent states and allowed the data to be classified into distinct regimes. The Schwarz criterion is used to identify the number of states and the prob-ability distribution that best fits the data. This approach is briefly described inSI Methods.
All tree-ring and temperature data are included in theDataset S1and will also be available from the World Data Center for Paleoclimatology (http:// www.ncdc.noaa.gov/paleo/paleo.html).
ACKNOWLEDGMENTS. The authors wish to thank Julia Autin, Yves Bouthillier, Pierre-Paul Dion, Sébastien Dupuis, Benjamin Dy, and Joëlle Marion for field and laboratory assistance; Aurore Catalan for technical assistance; and Joel Guiot for its comments on the paper. This research is a contribution from the ARCHIVES project (http://archives.ete.inrs.ca/) and was financially supported by the Natural Sciences and Engineering Research Council of Canada, Hydro-Quebec, Ouranos, ArcticNet, the EnviroNorth training program, and the Centre for Northern Studies.
1. Jansen E, et al. (2007) Palaeoclimate. Climate Change 2007: The Physical Science Basis. Contribution of Working Group I to the Fourth Assessment Report of the In-tergovernmental Panel on Climate Change, eds Solomon S, et al. (Cambridge Univ Press, Cambridge, UK), pp 433–497.
2. Jones PD, et al. (2009) High-resolution palaeoclimatology of the last millennium: A review of current status and future prospects. Holocene 19(1):3–49.
3. Stahle DW, et al. (2012) Tree-ring analysis of ancient baldcypress trees and subfossil wood. Quat Sci Rev 34:1–15.
4. PAGES 2k Consortium (2013) Continental-scale temperature variability during the past two millennia. Nat Geosci 6:339–346.
5. Viau AE, Ladd M, Gajewski K (2012) The climate of North America during the past 2000 years reconstructed from pollen data. Global Planet Change 84-85:75–83. 6. D’Arrigo R, Wilson R, Jacoby G (2006) On the long-term context for late twentieth
century warming. J Geophys Res 111(D3):D03103, 10.1029/2005JD006352. 7. Jacoby GC, Ivanciu IS, Ulan LD (1988) A 263-year record of summer temperature for
northern Quebec reconstructed from tree-ring data and evidence of a major climatic shift in the early 1800’s. Palaeogeogr Palaeoclimatol Palaeoecol 64(1-2):69–78. 8. Lavigne F, et al. (2013) Source of the great A.D. 1257 mystery eruption unveiled,
Samalas volcano, Rinjani Volcanic Complex, Indonesia. Proc Natl Acad Sci USA 110(42): 16742–16747.
9. Gao C, Robock A, Ammann C (2008) Volcanic forcing of climate over the past 1500 years: An improved ice core-based index for climate models. J Geophys Res 113(23): D23111, 10.1029/2008JD010239.
10. Crowley TJ (2000) Causes of climate change over the past 1000 years. Science 289(5477):270–277.
11. Cole-Dai J, et al. (2009) Cold decade (AD 1810−1819) caused by Tambora (1815) and another (1809) stratospheric volcanic eruption. Geophys Res Lett 36(22):L22703, 10.1029/2009GL040882.
12. Schleussner CF, Feulner G (2013) A volcanically triggered regime shift in the subpolar North Atlantic Ocean as a possible origin of the Little Ice Age. Clim Past 9(3): 1321–1330.
13. Zhong Y, et al. (2011) Centennial-scale climate change from decadally-paced explo-sive volcanism: A coupled sea ice-ocean mechanism. Clim Dyn 37(11-12):2373–2387. 14. Zanchettin D, et al. (2012) Bi-decadal variability excited in the coupled ocean−
atmosphere system by strong tropical volcanic eruptions. Clim Dyn 39(1-2):419–444. 15. Stenchikov G, et al. (2009) Volcanic signals in oceans. J Geophys Res 114(D16):D16104,
10.1029/2008JD011673.
16. Otterå OH, Bentsen M, Drange H, Suo L (2010) External forcing as a metronome for Atlantic multidecadal variability. Nat Geosci 3(10):688–694.
17. D’Arrigo R, Wilson R, Anchukaitis KJ (2013) Volcanic cooling signal in tree ring tem-perature records for the past millennium. J Geophys Res 118(16):9000–9010. 18. Esper J, et al. (2013) European summer temperature response to annually dated
volcanic eruptions over the past nine centuries. Bull Volcanol 75(7):1–14. 19. Breitenmoser P, et al. (2012) Solar and volcanic fingerprints in tree-ring chronologies
over the past 2000 years. Palaeogeogr Palaeoclimatol Palaeoecol 313-314:127–139. 20. Mann ME, Fuentes JD, Rutherford S (2012) Underestimation of volcanic cooling in
tree-ring-based reconstructions of hemispheric temperatures. Nat Geosci 5(3):202–205. 21. Briffa KR, Jones PD, Schweingruber FH, Osborn TJ (1998) Influence of volcanic
erup-tions on Northern Hemisphere summer temperature over the past 600 years. Nature 393(6684):450–455.
22. Miller GH, et al. (2012) Abrupt onset of the Little Ice Age triggered by volcanism and sus-tained by sea-ice/ocean feedbacks. Geophys Res Lett 39(2):L02708, 10.1029/2011GL050168. 23. Gennaretti F, Arseneault D, Bégin Y (2014) Millennial stocks and fluxes of large
woody debris in lakes of the North American taiga. J Ecol 102(2):367–380.
24. Évin G, Merleau J, Perreault L (2011) Two-component mixtures of normal, gamma, and Gumbel distributions for hydrological applications. Water Resour Res 47(8): W08525, 10.1029/2010WR010266.
25. Perreault L, Garçon R, Gaudet J (2007) Analyse de séquences de variables aléatoires hydrologiques à l’aide de modèles de changement de régime exploitant des variables atmosphériques [Modelling hydrologic time series using regime switching models and measures of atmospheric circulation]. Houille Blanche 6:111–123. French. 26. Mitchell TD, Jones PD (2005) An improved method of constructing a database of
monthly climate observations and associated high-resolution grids. Int J Climatol 25(6):693–712.
27. Boulanger Y, et al. (2012) Dendrochronological reconstruction of spruce budworm (Choristoneura fumiferana) outbreaks in southern Quebec for the last 400 years. Can J Res 42(7):1264–1276.
28. Schwarz G (1978) Estimating the dimension of a model. Ann Stat 6(2):461–464. 29. Naurzbaev MM, Vaganov EA (2000) Variation of early summer and annual
temper-ature in east Taymir and Putoran (Siberia) over the last two millennia inferred from tree rings. J Geophys Res 105(D6):7317–7326.
30. Salzer MW, Bunn AG, Graham NE, Hughes MK (2014) Five millennia of paleo-temperature from tree-rings in the Great Basin, USA. Clim Dyn 42(5-6):1517–1526. 31. Kaufman DS, et al.; Arctic Lakes 2k Project Members (2009) Recent warming reverses
long-term arctic cooling. Science 325(5945):1236–1239.
32. Esper J, et al. (2012) Orbital forcing of tree-ring data. Nat Clim Change 2(12):862–866. 33. Miller GH, Lehman SJ, Refsnider KA, Southon JR, Zhong Y (2013) Unprecedented
recent summer warmth in Arctic Canada. Geophys Res Lett 40(21):5745–5751. 34. Wagner S, Zorita E (2005) The influence of volcanic, solar and CO2forcing on the
temperatures in the Dalton Minimum (1790−1830): A model study. Clim Dyn 25(2-3): 205–218.
35. Kasper JN, Allard M (2001) Late-Holocene climatic changes as detected by the growth and decay of ice wedges on the southern shore of Hudson Strait, northern Québec, Canada. Holocene 11(5):563–577.
36. Payette S, Morneau C (1993) Holocene relict woodlands at the Eastern Canadian treeline. Quat Res 39(1):84–89.
37. Payette S, Filion L, Delwaide A (2008) Spatially explicit fire-climate history of the boreal forest-tundra (Eastern Canada) over the last 2000 years. Philos Trans R Soc Lond B Biol Sci 363(1501):2301–2316.
38. Robock A (2005) Cooling following large volcanic eruptions corrected for the effect of diffuse radiation on tree rings. Geophys Res Lett 32(6):L06702, 10.1029/2004GL022116. 39. Filion L, Payette S, Gauthier L, Boutin Y (1986) Light rings in subarctic conifers as
a dendrochronological tool. Quat Res 26(2):272–279.
40. Esper J, Cook ER, Krusic PJ, Peters K, Schweingruber FH (2003) Tests of the RCS method for preserving low-frequency variability in long tree-ring chronologies. Tree-Ring Res 59(2):81–98.
41. Arseneault D, Dy B, Gennaretti F, Autin J, Bégin Y (2013) Developing millennial tree ring chronologies in the fire-prone North American boreal forest. J Quat Sci 28(3): 283–292.
42. Melvin TM, Brifffa KR, Nicolussi K, Grabner M (2007) Time-varying-response smoothing. Dendrochronologia 25(1):65–69.
43. Clyde MA, Titus SJ (1987) Radial and longitudinal variation in stem diameter in-crement of lodgepole pine, white spruce, and black spruce: Species and crown class differences. Can J Res 17(10):1223–1227.
44. Guiot J, et al. (2005) Last-millennium summer-temperature variations in western Europe based on proxy data. Holocene 15(4):489–500.