Tight Binding of the Antitumor Drug Ditercalinium to Quadruplex DNA
Carolina Carrasco,[a] Frédéric Rosu,[b] Valérie Gabelica,[c] Claude Houssier,[b] Edwin De Pauw,[c] ChristianeGarbay-Jaureguiberry,[d] Bernard Roques,[d] W. David Wilson,[e] Jonathan B. Chaires,[f] Michael J. Waring,[g] and
Christian Bailly[a]
[a] Dr. C. Bailly Dr. C. Carrasco,INSERM U-524 et Loborotoire de Phormocologie Antitumorole du Centre Oscar Lombret IRCL, Place de Verdun, 59045 Lille (France)
[b] F. Rosu, Prof. C. Houssier Biospectroscopy Laboratory,Department of Chemistry University of Liege (Belgium) [c] Dr. V. Gabelica, Prof. E. De Pauw Mass Spectrometry Laborator,Department of Chemistry University of Liege (Belgium) [d] Prof. C. Garbay-Jaureguiberry Prof. B. Roques Département de Pharmacochimie Moleculaire et Structurale, INSERM U266 CNRS UMR 8600, Faculté de Pharmacie, 4 Avenue de I'Observatoire, 75270 Paris (France)
[e] Prof. Dr. W. D. Wilson Department of Chemistry, Georgia State University Atlanta, GA 30303 (USA)
[f] Prof. J. B. Chaires Department of Biochemistry University of Mississippi Medical Center, 2500 N. State St., Jackson, MS 9216-4505 (USA)
[g] Prof. M. J. Waring, Department of Pharmacology, University of Cambridge, Tennis Court Road, Cambridge CB2 1QJ (UK)
Abstract
The structural selectivity of the DNA-binding antitumor drug ditercalinium was investigated by competition dialysis with a series of nineteen different DNA substrates. The 7H-pyridocarbazole dimer was found to bind to double-stranded DNA with a preference for GC-rich species but can in addition form stable complexes with triplex and quadruplex structures. The preferential interaction of the drug with four-stranded DNA structures was independently confirmed by electrospray mass spectrometry and a detailed analysis of the binding reaction was performed by surface plasmon resonance (SPR) spectroscopy. The BIAcore SPR study showed that the kinetic parameters for the interaction of ditercalinium with the human telomeric quadruplex sequence are comparable to those measured with a duplex sequence. Slow association and dissociation were observed with both the
quadruplex and duplex structures. The newly discovered preferential binding of ditercalinium to the antiparallel quadruplex sequence d(AG3[T2AG3]3) provides new perspectives for the design of drugs that can bind to human
telomeres.
Keywords: antitumor agents - DNA - equilibrium dialysis - mass spectrometry - surface plasmon resonance
Introduction
Ditercalinium (Scheme 1) is a dimeric antitumor agent that was designed to interact tightly with double-stranded DNA.[1,2] This 7H-pyridocarbazole dimer binds from the major groove side of the double helix to form
bis-intercalation complexes with the two pyridocarbazolium rings inserted between contiguous CpG steps.[3,4] The
bis intercalation places the positively charged, rigid bis(ethylpiperidinium) linker chain within the major groove of the helix and induces a significant bend in the helix axis of about 15° towards the minor groove.[5] Recently,
we showed that the drug binds to natural DNA preferentially at GC-rich sequences.[6] Although the 3D structures
of a few ditercalinium-oligonucleotide bis-intercalation complexes have been solved, NMR data also indicated that other types of complexes can be formed.
For example, upon binding to d(GCGC)2 one of the pyridocar-bazole rings intercalates at the CpG step while the
other lies stacked upon an external base pair.[7] It has also been suggested that ditercalinium can recognize and
stabilize the A-type DNA conformation adopted by d(GCGCGC)2.[8] Therefore, it may be that ditercalinium
should be considered a structure-selective rather than a sequence-selective DNA binding agent. This consideration prompted us to examine the structural specificity of the drug by using the competition dialysis method.[9] The simultaneous interaction of ditercalinium with nineteen different types of nucleic acids was
ditercalinium binding. Competition dialysis measurements with a variety of DNA substrates that ranged from single-stranded synthetic polymers to complex three- and four-stranded structures not only confirmed the GC selectivity of the drug, but most importantly revealed a novel and unexpected preference of ditercalinium for binding to quadruplex DNA. The preferential binding of ditercalinium to the antiparallel quadruplex sequence d(AG3[T2AG3]3) was independently confirmed by mass spectrometry, which led to a detailed analysis of the
binding affinity and kinetics by surface plasmon resonance spectroscopy.
Scheme 1. Structure of ditercalinium.
Results
Equilibrium dialysis
Figure 1 illustrates results obtained from the competition dialysis procedure. Data are presented in the form of a bar graph, in which the amount of ditercalinium bound to each nucleic acid sample (Table 1) is plotted. All nucleic acids are at identical concentrations relative to the monomeric units (nucleotide, base pair, triplet, tetrad) that comprise the polymer. The free ligand concentration is 1 µM. The nucleic acids can be grouped into three categories according to the observed extent of binding of the drug to the different DNA species. Firstly,
ditercalinium binds relatively weakly to the synthetic double-stranded polymers that contain only AT, AU or GC base pairs and it binds poorly to Z-DNA and i-motif-containing DNA. Binding to the single-stranded polymers is almost negligible. Secondly, the binding of ditercalinium to the three natural DNA species is directly
proportional to the GC content of the DNA. Duplex DNA from Micrococcus lysodeikticus (72% GC) represents the most preferred form, followed by calf thymus DNA (42% GC) and DNA from Clostridium perfringens (31 % GC). This is entirely in accordance with recent footprinting data,[6] which shows that the drug binds best to
GC-rich sequences. Finally, a striking result that emerges is the strong preference of ditercalinium for all triplex and quadruplex DNA samples included in the assay. Ditercalinium binds to tetraplex 1, which is a parallel four-stranded structure, and to tetraplex 3, which appears to form a "G-wire" (Figure 2) under the conditions of this assay[10-13] Interestingly, the drug exhibits a clear preference for tetraplex 2, which is a folded, antiparallel
structure derived from the human telomere sequence. Under the ionic conditions of this assay, the amount of ditercalinium that binds to tetraplex 2 d(AG3[T2AG3]3) is about twice as great as that to M. lysodeikticus duplex
DNA and three times greater than the amount that binds poly(dG-dC). Binding to triplex DNA and RNA structures can only be a structure preference, since only TAT (or UAU) triplets are represented in our assay and binding to the duplex forms that contain these bases is poor.
The unexpected finding that ditercalinium binds preferentially to tetraplex DNA prompted us to investigate further the interaction of the drug with quadruplex-forming oligonucleotides by using two other techniques.
Mass spectrometry
The binding of ditercalinium to a panel of two- and four-stranded DNA sequences (three of each) was analyzed by electrospray ionization mass spectrometry (ESI MS), which is a highly sensitive method for the investigation of the stoichiom-etry and extent of drug-nucleic-acid interaction. The duplexes all have 12 base pairs and differ in their respective GC content. The 3 tetraplexes include the sequences d(TG4T)4 and d(G4T4G4)2, reminiscent of
tetraplexes 1 and 3 used in the equilibrium dialysis experiments, and the human telomeric sequence [G3(T2AG3)3], as in tetraplex 2. Typical mass spectra obtained with the Dickerson - Drew dodecamer duplex
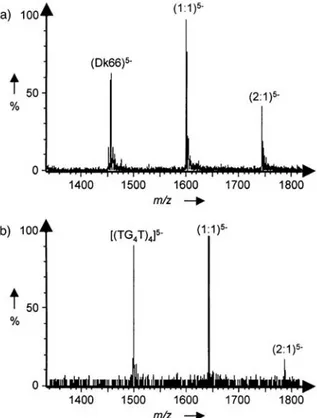
d(CGCGA2T2CGCG)2 and the d(TG4T)4 quadruplex are presented in Figure 3. In both cases, as with all the other
sequences, a mixture of 1:1 and 2:1 drug-DNA complexes were identified. The amount of drug bound to the nucleic acid was calculated for each sequence and the results were expressed in terms of the molecular binding unit (base pair or tetrad) to facilitate comparison, as in the equilibrium dialysis experiments. The results
presented in Figure 4 indicate that the drug binds better to all three of the tetraplex structures than to the
duplexes. The amount of drug-DNA complex formed with the 12-mer oligonucleotide duplexes was more or less equivalent, though higher with the duplex that contained only GC base pairs compared to that with eight AT base pairs, as anticipated from the known GC preference of the drug. The interesting observation is the net preference of the drug for the three quadruplex-forming sequences. The tetrads bind twice as much drug as do the base pairs. The ESI MS results agree well with the equilibrium dialysis data, although the experimental conditions are quite distinct (different buffers, short oligonucleotides rather than long nucleic acid polymers). The two methods lead to the same overall conclusion: ditercalinium binds preferentially to the tetraplex-forming sequences.
Figure 1. Results of a competition dialysis experiment with ditercalinium. The amount of ditercalinium bound to
the various nucleic acid structures listed in Table 1 is shown as a bar graph. The free ligand concentration in the experiment was 1 µM and the total concentration of each nucleic acid was 75 µM (expressed in terms of
nucleotides, base pairs, triplets, or tetrads as appropriate). M lyso = Micrococcus lysodeikticus; CT= calf thymus; C perf = Clostridium perfringens.
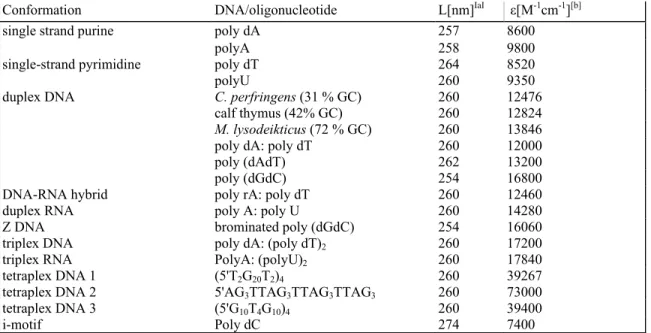
Table 1. Nucleic acid structures used in competition dialysis experiments.
Conformation DNA/oligonucleotide L[nm]IaI ε[M-1cm-1][b]
single strand purine poly dA 257 8600
polyA 258 9800
single-strand pyrimidine poly dT 264 8520
polyU 260 9350
duplex DNA C. perfringens (31 % GC) 260 12476
calf thymus (42% GC) 260 12824
M. lysodeikticus (72 % GC) 260 13846
poly dA: poly dT 260 12000
poly (dAdT) 262 13200
poly (dGdC) 254 16800
DNA-RNA hybrid poly rA: poly dT 260 12460
duplex RNA poly A: poly U 260 14280
Z DNA brominated poly (dGdC) 254 16060
triplex DNA poly dA: (poly dT)2 260 17200
triplex RNA PolyA: (polyU)2 260 17840
tetraplex DNA 1 (5'T2G20T2)4 260 39267
tetraplex DNA 2 5'AG3TTAG3TTAG3TTAG3 260 73000
tetraplex DNA 3 (5'G10T4G10)4 260 39400
i-motif Poly dC 274 7400
Figure 2. Schematic of quodruplex structures used in the competition dialysis assay: left, parallel-stranded
intermolecular quadruplex formed by the self-association of 5'T2G20T2; center, antiparallel intramolecular quadruplex formed by the folding of 5'AGGG(TTAGGG)3; right, "G-wire" formed by the indefinite association of 5'G10T4G10.
Figure 3. ESI MS spectra of complexes of ditercalinium with (a) the duplex d(CGCGAATTCGCG)2 and (b) the quadruplex (TGGGGT)4. The unbound oligonucleotide and the 1:1 and 2:1 drug-DNA complexes were identified. Spectra were recorded in 100 mM (a) or 150 mM (b) ammonium acetate, pH 7.0, with equimolar amounts of the drug and the oligonucleotide (5µM each).
Figure 4. Amount of ligand bound to each monomeric DNA structure (base pairs or tetrads) determined by ESI
MS.
Surface plasmon resonance measurements
SPR spectroscopy binding experiments were performed to enable an additional and quite different comparison of the interactions between ditercalinium and DNA. Three biotin-labeled hairpin oligonucleotide sequences, the duplexes [AATT] and [CG]4 and the human telomeric tetraplex G4, were used in these experiments. The SPR
experiments were performed at
20°C in HBS-EP buffer (see the Materials and Methods section) supplemented with 0.2 M KCI. Addition of a high concentration of KCI was found to be necessary to reach a stable steady-state plateau for the interaction between ditercalinium and the G4 sequence. These optimized experimental conditions allowed clear sensorgrams to be collected and the data were processed as described in the Materials and Methods section. A set of
sensorgrams (response units, RU, versus time) for the concentration-dependent binding of ditercalinium to the [CG]4 duplex and the G4 tetraplex is shown in Figure 5. We found that ditercalinium is difficult to work with at
concentrations above around 10-7
M and our binding plots stop when that concentration range is reached (Figure 6). Nonspecific binding of ditercalinium to the sensor chip surfaces may be excessive and is difficult to correct for exactly at higher concentrations. Methods to treat these difficult systems at higher concentrations are under development in our laboratories.
Figure 5. SPR sensorgrams for binding of ditercalinium to [CG]4 and G4 DNA in HBS-EP buffer supplemented with 0.2 M KCI, at 25 °C. The concentration of the unbound ligand in the flow solution varies from 1 nM for the
Figure 6. Binding plots used to determine the affinity constants for ditercalinium complexed with the duplexes
(●) [AATT] and (○) [CG]4 and with (◊) the tetraplex G4 sequence. These plots were constructed by conversion of the RU values from the steady-state region of the SPR sensorgrams presented in Figure 5 to r values (moles drug bound per mole DNA hairpin), which were plotted against the concentration of unbound ditercalinium.
Ditercalinium exhibits a high affinity for all three DNA sequences, with affinity constants near to or greater than 107M-1.The [CG]
4 and [AATT] duplex sequences have similar binding affinities and are best fit by a model with
two equivalent sites and microscopic equilibrium constants of around 107
M-1.The two binding sites on the [CG]4
and [AATT] oligomers are as would be expected for neighbor exclusion binding of a bis intercalator to a duplex of this length. The binding constants for these short duplexes are in good agreement with results obtained for AT and GC polymers by the competition dialysis method. Binding to the G4 tetraplex is stronger and of a different character compared to binding with the duplexes. The G4 tetraplex results require fitting with a nonequivalent two-site model. The higher binding constant,K1, is 3 x 10⁷M-1and is approximately ten times greater than the
second, lower binding constant, K2. The presence of two binding sites, one significantly stronger than the other,
agrees with results for a number of other G4 binding compounds.[14] It should be noted, however, that the error in
the second, lower K2 value is large because we cannot use concentrations of ditercalinium above about 10-7M in
this experiment.
The kinetics of the reactions were sufficiently slow for both the duplexes and the quadruplex to allow us to estimate the association (ka) and dissociation (kd) parameters (Table 2) as well as to calculate equilibrium binding
constants based on these values (ka/kd = Keq). These calculated binding constants are in qualitative agreement
with results from the steady-state anal ysis. More work is needed to determine whether mass transfer effects influence the kinetics constants but qualitative analysis of the kinetics profiles and ka/kd ratios is possible at this
point. Qualitative analysis of the on/off rates of the binding reaction reveals further differences between the binding of the duplex and that of the tetraplex in terms of kinetics. The association rate for the quadruplex is approximately one third to a half that for the duplexes. The drug dissociates from the duplexes about four to five times faster than from the quadruplex. Overall, the biosensor SPR analysis confirms that ditercalinium binds strongly to both duplexes and quadruplexes. This compound is a potent new G4 binder.
Table 2. Binding and kinetic constants determined by SPR.[a]
Sequence Keq[M-1] ka [M-1S-1] kd [S-1] ka/kd [M-1] n
AATT[b] 0.9 x 10⁷ 7.3 x 10⁴ 6.8 x 10⁻³ 1.1 x 10⁷ 2
[CG]4[c] 1.0 x 10⁷ 5.3 x 10⁴ 1.6 x 10⁻³ 3.5 x 10⁷ 2
G4[d] 3.0 x 10⁷ 2.4 x 10⁴ 1.9 x 10⁻³ 1.3 x 10⁷ 2
[a] Experiments were performed at 20°C in HBS-EP buffer that contained 0.2 M KCI. The 5'-biotin oligonucleotide sequences used are: [b] d(CGAATTCGTCTCCGAATTCG), [c] d(CGCGCGCGTTTTCGCGCGCG), and [d]d([AG3(TTAG3)3].
Discussion
This competition dialysis study reveals an unexpected ability of ditercalinium to bind to multistranded structures. Both DNA and RNA triplexes bind ditercalinium as well as does natural duplex DNA. Since both the triplex structures investigated contain only A and T (or U) bases, ditercalinum binding must reflect some kind of structural preference rather than a base or sequence preference. Moreover, Figure 1 shows that ditercalinium binds well to the three quadruplex structures included in the competition dialysis assay. Interestingly, its highest
affinity is for the folded antiparallel quadruplex structure (tetraplex 2) derived from the human telomere repeat sequence 5'-(dTTAGGG). Ditercalinium binds as tightly to parallel quadruplex and G-wire structures as it does to natural duplex DNA. Although the exact mode of binding to quadruplex structures is not presently known, it will be the subject of additional studies specifically designed to address that question.
The discovery that ditercalinium binds strongly to quadruplex DNA was fully confirmed by complementary mass spectrometry and surface plasmon resonance studies. Direct evidence for the formation of stable ditercalinium-G4-oligonucleotide complexes is furnished by the ESI MS results (Figure 3). This method has proved useful for the study of a large number of noncovalent complexes with intercalators and minor groove binders[15-19] and we here show that the method is also well-suited to the identification of a
quadruplex-interactive compound, as recently shown with other G4 binders.[20,21] Surface plasmon resonance spectroscopy
further attests that ditercalinium does effectively recognize the G4 human telomeric structure and these results provide additional information on the kinetics of the drug-DNA interaction. We cannot yet relate those kinetics to the mode of binding of ditercalinium to the G4 structure. However, the fact that the drug dissociates more slowly from the G4 structure than from the duplexes indicates that it forms very stable complexes, most likely by base stacking interactions and possibly through a bis-intercalation-like process, as is known to be the case with duplex DNA. On the basis of molecular modeling studies, Neidle and co-workers have identified a ligand binding site in the d[TAG3(TAG3)3] quadruplex between the diagonal T2A loop and the G-quartet segment.[22,23]
This binding cavity lies in the 5'-AG sequence, a dinucleotide step frequently encountered within ditercalinium binding sites on duplex DNA[6] as well as in the octanucleotide sequence d(CCTATAGG)
2 used for NMR
spectroscopy studies.[7] The 5'-AG step may perhaps be exploited by ditercalinium as its strongest binding site,
with the AG base pair sandwiched between the two tetracyclic units. It is also conceivable that the ditercalinium stacks onto an external G4 tetrad, as previously observed with an external GC base pair in a short duplex d(GCGC)2,[7] and this may account for the second, weaker ditercalinium binding site on the G4 DNA structure.
Specific structural studies at the atomic level, for example by high-resolution NMR spectroscopy, will be required to investigate further the geometry of the ditercalinium -telomere-sequence complex.
The discovery that the antitumor agent ditercalinium binds strongly to the telomeric quadruplex DNA sequence was very surprising at first sight. However, we have realized that the structure of this bis-pyridocarbazolium tetracation may actually be well adapted to the G4 structure. Several items of published information appear pertinent. Previous studies of structure-activity relationships in the amidoanthracene-9,10-dione (AQ) series have established the requirement of a cationic nitrogen atom (preferably a piperidine or pyrrolidine) at or near the end of the side chain for optimal binding to the telomere sequence. AQ compounds bearing an ethylpiperidinium chair-type ring interact favorably with the folded human telomere sequence.[24,25] The positively charged
bis(ethylpiperidinium) chain that connects the two pyridocarbazolium units in ditercalinium could play the same role. It is in any case likely that ionic interaction of the two protonated nitrogens with negatively charged DNA phosphate groups is an important component in the ability of ditercalinium to bind to the tetraplex structure. The presence of a cationic center within the aromatic moiety is also a common characteristic of
quadruplex-interactive agents. Molecular modeling of the 3,6-disubstituted acridine series has revealed that the protonated nitrogen atom is located over the center of the stacked G quartet.[25,26] By analogy, we can envisage that each of
the pyridinium rings of the two aromatic chromophores contributes similarly to the stabilization of the ditercalinium-G4 complex.
A structural analogy can also be drawn between the connecting linker of ditercalinium and the side chains of the perylene diimide compound PIPER, which binds strongly and specifically to the human telomeric G4
sequence.[27-30] PIPER has a large G4-stacking diimide planar chromophore substituted with two
N-ethylpiperidinium side chains, which bind into opposite grooves of the G4 structure. Here again, the identity between the PIPER side chains and the ditercalinium linker may be invoked to explain the G4-binding capacity of ditercalinium. There is also a clear analogy between the pyridocarbazolium units of ditercalinium and the tetracyclic planar chromophores found in other G4-interacting agents such as indoloquino-lines,[31,32]
hydroxyellipticine,[33] and fluoroquinophenoxazine.[34]
It is interesting to compare the structure of ditercalinium with that of a macrocyclic bisacridine derivative that has been shown to bind strongly to quadruplex DNA and to inhibit telomer-ase.[35,36] Both cyclic (bisacridine)
and rigid but noncyclic (ditercalinium) dimeric drugs can be exploited for the design of G4-interacting anticancer agents.
Experimental Section
Drug: The synthesis and analytical characterization of ditercalinium
(1,1'-bis(2-(10-methoxy-7H-pyrido[4,3-c]carbazolium)ethyl-4,4'-bipi-peridine] dimethanesulfonate dihydromethane sulfonate) have been reported previously.[2] The drug was first dissolved in water at 5 m
M and then further diluted with water. The stock solution was kept at — 20°C and freshly diluted to the desired concentration immediately prior to use.
Competition dialysis assay: The structural selectivity of ditercalinium was studied by using the recently devised
competition dialysis method.[9,37,38] A buffer (pH 7.0) that consisted of Na
2HPO4 (6 mM),NaH2PO4 (2 mM),
Na2EDTA (1 mM;EDTA = ethylenediaminetetraacetate), and NaCI (185mM)was used for all experiments. For
each competition dialysis assay, a dialysate solution (200 mL) that contained ligand (1 µM) was placed into a beaker. Each of the DNA samples(0.5 mL, 75 µM monomeric unit) listed in Table 1 was pipeted into a separate 0.5-mL Spectro/Por DispoDialyzer unit (Spectrum, Laguna Hills, California). All 19 dialysis units were then placed in the beaker that contained the dialysate solution. The beaker was covered with parafilm, wrapped in foil, and allowed to equilibrate for 24 h with continuous stirring at room temperature (20 - 22 °C). At the end of the equilibration period, DNA samples were carefully transferred to microfuge tubes and brought to a final
concentration of 1 % (w/v) sodium dodecyl sulfate (SDS) by the addition of appropriate volumes of a 10% (w/v) stock SDS solution. The total concentration of ditercalinium (Ct) within each dialysis unit was determined
spectro-photometrically. An appropriate correction for the slight dilution of the sample that resulted from the addition of the stock SDS solution was made. The free ligand concentration (Cf) was determined
spectrophotometrically from an aliquot of the dialysate solution, although this concentration usually did not vary appreciably from the initial 1 µM concentration. The concentration of bound drug, Cb, was determined from the
difference, Cb = Ct - Cf. Data were plotted as a bar graph with the Origin software (v. 5.1, Microcal, Inc.,
Northampton, Massachusetts).
Mass spectrometry: Single-stranded oligodeoxyribonucleotides d(CGTAAATTTACG) (Mr = 3644.45),
d(CGCGAATTCGCG) (Mr = 3646.44 Da), d(CGCGGGCCCGCG) (Mr = 3678.40), d(TGGGGT) (Mr =
1863.26), d(GGGGTTTTGGGG) (Mr = 3788.50), and d((GGGTTA)3GGG) (/Mr = 6653.35) were purchased
from Eurogentec (Angleur, Belgium). Duplex and quadruplex solutions were prepared in 100 mM and 150 mM ammonium acetate (pH 7.0), respectively. Oligonucleotide solutions were heated to 85 °C for 5 min and then slowly cooled to 20 °C overnight to form the desired duplex or quadruplex structures. The extinction coefficients of the duplexes were derived from a thermal denaturation curve. The extinction coefficients for the single strands were given by the supplier. Experiments were performed on a Q-TOF2 spectrometer (Micromass, Manchester, UK) operated in the negative-ion mode. Spectra of equimolar mixtures (C0 = 5 µmolL-1) of DNA and
ditercalinium were recorded. Methanol (15%) was added to the samples just before injection in order to obtain a stable electrospray signal. The experimental conditions for the Z-spray source were optimized to avoid
denaturation of the duplex1151 or quadruplex species;[21] a source block temperature of 80°C and a cone voltage
of 15 V were used. The rate of sample infusion into the mass spectrometer was 4µLmin-1. We assumed that the
relative intensities of the free and bound DNA in the mass spectra are proportional to the relative abundance of these species in solution. This assumption was confirmed correct by comparison of the ESI MS and fluorescence titration data.[19] As the initial concentrations are known, the concentrations of all individual species at
equilibrium (free DNA, 1:1 complex, 2:1 complex, and, by difference, the free drug) can be determined from the relative intensities of the signals of the free DNA and the complexes. The concentration of bound ligand per DNA structure is obtained from Equation (1):
(1)
where C0 is the initial DNA concentration and lDNA, /(1:1), and /(2:1) are the relative intensities of the free DNA, the
(1:1) complex, and the (2:1) complex, respectively. The relative intensities were obtained from a sum of 50 spectra. The amount of bound ligand expressed as the number of molecular binding units (bp or tetrad) is determined by division of the total amount of bound ligand by the number of base pairs/tetrads in the DNA target (12 for the double helix, 3 or 4 for the quadruplex structure).
Surface plasmon resonance spectroscopy: HBS-EP buffer (10mM HEPES, pH 7.4, 150 mM NaCI, 3 mM EDTA, 0.0005% Surfactant P20), sterile filtered and degassed, was obtained from BIAcore and supplemented with 0.2M KCI. Three different 5'-biotin-labeled hairpins (Eurogentec, PAGE purified) were used in surface plasmon resonance studies (hairpin loop underlined): CGAATTCGTCTCCGAATTCG), d(biotin-CGCGCGCGTTTTCGCGCGCG), and d(biotin-[AG3(TTAG3)3), referred to as the [AATT] duplex, [CG]4
duplex, and G4 quadruplex sequences, respectively. SPR measurements were performed with a four-channel BIAcore 3000 optical biosensor system (Biacore Inc.) and streptavidin-coated sensor chips (SA). The sensor chips were first conditioned with three consecutive 1-min injections of NaCI (1 M)in NaOH (50 mM)followed by extensive washing with buffer. Samples of DNA oligomers in HBS-EP buffer at 25 nM concentration were applied to the flow cells on the sensor chips by direct flow. Nearly the same amount of each oligomer was immobilized on the surface by noncovalent capture. One of the flow cells was left blank as a control. Manual injection of the DNA was used with a flow rate of 2 µLmin-1 to achieve long contact times with the surface and
to control the amount of DNA bound to the surface. All procedures for binding studies were automated, with repeated cycles of sample injection and regeneration. Steady-state binding analysis was performed with multiple injections of different compound concentrations over the immobilized DNA and reference surfaces for a 30-min period at a flow rate of 10 µLmin-1 and 25 °C. Solutions of the drug at known concentrations were prepared in
filtered and degassed HBS-EP-KCI buffer by serial dilution from a stock solution and were injected from 7-mm plastic vials with pierceable plastic crimp caps (Biacore Inc.).
The instrument response (RU) in the steady-state region is proportional to the amount of bound drug and was determined by linear averaging over an 80-s time span. The predicted maximum response per bound drug molecule in the steady-state region (RUmax) is determined from the DNA molecular weight, the amount of DNA
on the flow cell, the drug molecular weight, and the refractive index gradient ratio of the compound and DNA, as previously described.[39,40] In most cases, the observed RU values at high concentrations are greater than RU
max,
which points to more than one binding site in these DNA sequences. The number of binding sites was estimated from Scatchard plots derived from RU/concentration versus RU plots by using a linear regression analysis and by fitting direct plots of RU versus free ditercalinium concentration (see below). The RUmax value is required to
convert the observed response (RU) to the standard binding parameter r (moles drug bound per mole DNA hairpin), as shown in Equation (2). The results from the steady-state region were fitted with a
multiple-equivalent-site model by using the Kaleidagraph software for nonlinear least squares optimization of the binding parameters with Equation (2) in order to obtain the affinity constants.
(2)
The lvalue is the microscopic binding constant for the sites and is a variable to fit, r represents the moles of bound compound per mole of DNA hairpin duplex, Cfree is the concentration of the compound in equilibrium
with the complex and is fixed by the concentration in the flow solution, and n is one or two and is the number of compound binding sites on the DNA duplex. Note that the K1 and K2 values, the macroscopic binding constants,
are related to K in this model as follows: K1= 2 x K and K2 = 0.5K. The r values are calculated as the ratio
RU/RUmax, where RU is the steady-state response at each concentration. Note that this equation can also be
expressed in RU to allow RUmax to be included as an additional variable to fit. This approach allows a direct
comparison with the calculated RUmax value and provides additional information about binding stoichiometry.
Results were also fit to a nonequivalent two-site binding model:
(3)
In this model, the K1 and K2 values are the macroscopic binding constants, as above, and are the variables to fit.
RUmax can again be included as an additional fit variable for a check on the calculated value and on the
stoichiometry. Global kinetic fits to the sensorgrams to estimate association and dissociation kinetic constants were made by using the BIAevaluation software and an equivalent-site interaction model.
Acknowledgements
This work was supported by grants to M.J.W. from the Cancer Research Campaign, to J.B.C. from the National Cancer Institute, to W.D.W from the National Institutes of Health, to C.H. from the Actions de Recherches Concertées (Grant no. 95/00-93), and to C.B. from the Association pour la Recherche sur Ie Cancer. W.D.W. was the recipient of an INSERM "Poste Orange" fellowship. V.G. was the recipient of a research fellowship from the Fonds National de la Recherche Scientifique (Belgium). This research has been supported by a Marie
Curie Fellowship of the European Community Program "Improving Human Research Potential and the Socio-economic Knowledge Base" under contract number HPMFCT-2000 - 00701 (to C.C.). We thank the IMPRT for access to the BIAcore 3000 instrumentation and Dr. Jinsong Ren for collecting the competition dialysis data.
References
[1] B. P. Roques, D. Pelaprat, I. LeGuen, G. Porcher, C. Gosse, J.B. Le Pecq, Biochem. Pharmacol. 1979, 28, 1811-1815. [2] D. Pelaprat, A. Delbarre, I. LeGuen, B. P. Roques, J.B. Le Pecq, J. Med.Chem. 1980, 23, 1336-1343.
[3] A. Delbarre, M. Delepierre, C. Garbay, J. Igolen, J. B. Le Pecq, B. P. Roques, Proc. Natl. Acad. Sci. USA 1987, 84, 2155-2159. [4] Q. Gao, L. D. Williams, M. Egli, D. Rabinovich, S. L. Chen, G.J. Quigley, A. Rich, Proc. Natl. Acad. Sci. USA 1991, 88, 2422-2426. [5] L. D. Williams, Q. Gao, Biochemistry 1992, 31, 4315-4324.
[6] S. D. G. Crow, C. Bailly, C. Garbay-Jaureguiberry, B. P. Roques, B. Ramsay Shaw, M.J. Waring, Biochemistry 2002, 41, 8672-8682. [7] M. Delepierre, C. Milhe, A. Namane, T. H. Dinh, B. P. Roques, Biopolymers 1991, 37,331-353.
[8] B. de Pascual-Teresa, J. Gallego, A. R. Ortiz, F. Gago, J. Med. Chem. 1996,39, 4810-4824. [9] J. Ren, J. B. Chaires, Biochemistry 1999, 38, 16067-16075.
[10] T.C. Marsh, E. Henderson, Biochemistry 1994, 33, 10718-10724. [11] T. Y. Dai, S. P. Marotta, R. D. Sheardy, Biochemistry 1995, 34, 3655-3662. [12] E. Protozanova, R. B. Macgregor, Jr., Biochemistry 1996, 35, 16638-16645. [13] E. Protozanova, R. B. Macgregor, Jr., Biophys J. 1998, 75, 982-989.
[14] M. Read, R.J. Harrison, B. Romagnoli, F. A. Tanious, S. H. Gowan, A. P. Reszka, W. D. Wilson, L. R. Kelland, S. Neidle, Proc. Natl.
Acad. Sci. USA 2001, 98, 4844-4849.
[15] V. Gabelica, E. De Pauw, F. Rosu, J. Mass Spectrom. 1999, 32, 1328-1337. [16] S. A. Hofstadler, R. H. Griffey, Chem. Rev. 2001, 101, 377-390.
[17] J. Beck, M. L. Colgrave, S. F. Ralph, M. M. Sheil, Mass Spectrom. Rev. 2001, 20,61-87. [18] M. L. Reyzer, J. S. Brodbelt, S. M. Kerwin, D. Kumar, Nucleic Acids Res. 2001, 29, E103-103. [19] F. Rosu, V. Gabelica, C. Houssier, E. De Pauw, Nucleic Acids Res. 2002, 30,E82.
[20] W. M. David, J. Brodbelt, S. M. Kerwin, P. W. Thomas, Anal. Chem. 2002, 74,2029-2033. [21 ] F. Rosu, V. Gabelica, P. Colson, E. De Pauw, Rapid Commun. Mass Spectrom,2002, 16, 1729-1736. [22] S. Neidle, R. J. Harrison, A. P. Reszka, M. A. Read, Pharmacol. Ther. 2000,85,133-139.
[23] G. N. Parkinson, M. P. H. Lee, S. Neidle, Nature 2002, 417, 876-880.
[24] P. J. Perry, M. A. Read, R. T. Davies, S. M. Gowan, A. P. Reszka, A. A. Wood, L. R. Kelland, S. Neidle, J. Med. Chem. 1999, 42, 2679-2684.
[25] M.A. Read, A. A. Wood, J.R. Harrison, S. M. Gowan, L. R. Kelland, H.S. Dosanjh, S. Neidle, J. Med. Chem. 1999, 42, 4538-4546. [26] R. J. Harrison, S. M. Gowan, L. R. Kelland, S. Neidle, Bioorg. Med. Chem. Lett.1999, 9, 2463-2468.
[27] O. Y. Fedoroff, M. Salazar, H. Han, V. V. Chemeris, S. M. Kerwin, L. H. Hurley, Biochemistry 1998, 37, 12 367 -12 374. [28] H. Han, C. L. Cliff, L. H. Hurley, Biochemistry 1999, 38, 6981-6986.
[29] H. Han, R.J. Bennett, L. H. Hurley, Biochemistry 2000, 39, 9311 -9316.
[30] S. M. Kerwin, G. Chen, J. T. Kern, P. W. Thomas, Bioorg. Med. Chem. Lett.2002, 72, 447-450.
[31] V. Caprio, B. Guyen, Y. Opoku-Boahen, J. Mann, S. M. Gowan, L. M. Kelland, M.A. Read, S. Neidle, Bioorg. Med. Chem. Lett. 2000,
10, 2063-2066.
[32] P. Alberti, P. Schmitt, C. H. Nguyen, C. Rivalle, M. Hoarau, D. Grierson, J. L. Mergny, Bioorg. Med. Chem. Lett. 2002, 72, 1071 -1074.
[33] N. Sato, K Mizumoto, M. Kusumoto, H. Niiyama, N. Maehara, T Ogawa, M., Tanaka, FEBS Lett. 1998, 441, 318-321.
[34] W. Duan, A. Rangan, H. Vankayalapati, M.-Y Kim, Q. Zeng, D. Sun, H. Han,O. Y. Fedoroff, D. Nshioka, S. Y. Rha, E. Izbicka, D. D. Von Hoff, L. H. Hurley, Mol. Cancer. Ther. 2002, 1, 103-120.
[35] W. Alberti, J. Ren, M. P. Teulade-Fichou, L. Guittat, J. F. Riou, J. B. Chaires, C. Helene, J. P. Vigneron, J. M. Lehn, J. L. Mergny, J.
Biomol. Struct. Dyn. 2001,19, 505-513.
[36] J. L. Mergny, L. Lacroix, M. P. Teulade-Fichou, C. Hounsou, L. Guittat, M. Hoarau, P. B. Arimondo, J. P. Vigneron, J. M. Lehn, J. F. Riou, T. Garestier, C. Hélène, Proc. Natl. Acad. Sci. USA 2001, 98, 3062-3067.
[37] J. Ren, J. B. Chaires, J. Am. Chem. Soc. 2000, 122, 424-425. [38] J. Ren, J. B. Chaires, Methods Enzymol. 2001, 340, 99-108. [39] T. M. Davis, W. D. Wilson, Anal. Biochem. 2000, 284, 348-353. [40] T. M. Davis, W. D. Wilson, Methods Enzymol. 2001, 340, 22-51.

![Figure 5. SPR sensorgrams for binding of ditercalinium to [CG] 4 and G4 DNA in HBS-EP buffer supplemented with 0.2 M KCI, at 25 °C](https://thumb-eu.123doks.com/thumbv2/123doknet/5882368.143617/5.918.149.759.737.1002/figure-spr-sensorgrams-binding-ditercalinium-dna-buffer-supplemented.webp)
![Figure 6. Binding plots used to determine the affinity constants for ditercalinium complexed with the duplexes (●) [AATT] and (○) [CG] 4 and with (◊) the tetraplex G4 sequence](https://thumb-eu.123doks.com/thumbv2/123doknet/5882368.143617/6.918.205.432.188.393/binding-determine-affinity-constants-ditercalinium-complexed-duplexes-tetraplex.webp)
