HAL Id: hal-00327862
https://hal.archives-ouvertes.fr/hal-00327862
Submitted on 25 Jul 2003HAL is a multi-disciplinary open access
archive for the deposit and dissemination of sci-entific research documents, whether they are pub-lished or not. The documents may come from teaching and research institutions in France or abroad, or from public or private research centers.
L’archive ouverte pluridisciplinaire HAL, est destinée au dépôt et à la diffusion de documents scientifiques de niveau recherche, publiés ou non, émanant des établissements d’enseignement et de recherche français ou étrangers, des laboratoires publics ou privés.
An improved infrared carbon monoxide analyser for
routine measurements aboard commercial airbus
aircraft: Technical validation and first scientific results
of the MOZAIC III programme
P. Nedelec, Jean-Pierre Cammas, V. Thouret, G. Athier, J.-M. Cousin, C.
Legrand, C. Abonnel, F. Lecoeur, G. Cayez, C. Marizy
To cite this version:
P. Nedelec, Jean-Pierre Cammas, V. Thouret, G. Athier, J.-M. Cousin, et al.. An improved infrared carbon monoxide analyser for routine measurements aboard commercial airbus aircraft: Technical validation and first scientific results of the MOZAIC III programme. Atmospheric Chemistry and Physics Discussions, European Geosciences Union, 2003, 3 (4), pp.3713-3744. �hal-00327862�
ACPD
3, 3713–3744, 2003 An improved infrared carbon monoxide analyser P. Nedelec et al. Title Page Abstract Introduction Conclusions References Tables Figures J I J I Back Close Full Screen / EscPrint Version Interactive Discussion
c
EGU 2003
Atmos. Chem. Phys. Discuss., 3, 3713–3744, 2003 www.atmos-chem-phys.org/acpd/3/3713/
c
European Geosciences Union 2003
Atmospheric Chemistry and Physics Discussions
An improved infrared carbon monoxide
analyser for routine measurements
aboard commercial airbus aircraft:
Technical validation and first scientific
results of the MOZAIC III programme
P. Nedelec1, J.-P. Cammas1, V. Thouret1, G. Athier1, J.-M. Cousin1, C. Legrand2, C. Abonnel3, F. Lecoeur4, G. Cayez5, and C. Marizy6
1
Laboratoire d’A ´erologie, CNRS, Observatoire Midi-Pyr ´en ´ees, UMR 5560, 14 Avenue Edouard Belin, 31400 Toulouse, France
2
Air C.O.M., Avenue Tsukuba, 14200 Herouville Saint Clair, France
3
M ´et ´eo-France, Centre d’Aviation M ´et ´eorologique, A ´erodrome, 91228 Br ´etigny-sur-Orge, France
4
M ´et ´eo-France, Direction des Syst `emes d’Observation de la M ´et ´eorologie, 7 rue Teisserenc-de-Bort, BP 202, 78195 Trappes, France
5
M ´et ´eo-France, Direction Interr ´egionnale Nord-Est, BP 124 Parc d’Innovation, boulevard Gonthier d’Andernach, 67403 Illkirch Cedex, France
6
Airbus France, 316 Route de Bayonne, 31300 Toulouse, France
Received: 14 April 2003 – Accepted: 10 June 2003 – Published: 25 July 2003 Correspondence to: P. Nedelec ([email protected])
ACPD
3, 3713–3744, 2003 An improved infrared carbon monoxide analyser P. Nedelec et al. Title Page Abstract Introduction Conclusions References Tables Figures J I J I Back Close Full Screen / EscPrint Version Interactive Discussion
c
EGU 2003
Abstract
The European-funded MOZAIC programme (Measurements of ozone and water vapour by Airbus in-service aircraft) has been operational since 1994 aboard 5 commercial Airbus A340. It has gathered ozone and water vapour data between the ground and an altitude of 12 km from more than 20 000 long-range flights. A new infrared carbon
5
monoxide analyser has been developed for installation on the MOZAIC equipped air-craft. Improvements in the basic characteristics of a commercial CO analysers have achieved performance suitable for routine aircraft measurements : ±5 ppbv, ±5% pre-cision for a 30 s response time. The first year of operation on board 4 aircraft with more than 900 flights has proven the reliability and the usefulness of this CO analyser.
10
The first scientific results are presented here, including UTLS exchange events and pollution within the boundary layer.
1. Introduction
Carbon monoxide (CO) is a key trace gas within tropospheric photochemistry. The re-action of CO with the hydroxyl radical (OH) provides a constraint on the concentration of
15
OH in the unpolluted atmosphere (Logan et al., 1981), and thus on the oxidizing capac-ity in the troposphere. Changes in OH oxidation due to changes in CO concentrations could perturb the concentration of greenhouse gases such as CH4and O3(Thompson and Cicerone, 1986). Thus a better understanding of the atmospheric distribution of CO is important for the assessment of climate change.
20
CO has both natural and anthropogenic sources. Naturally produced CO results pri-marily from the oxidation of methane and other hydrocarbons (notably isoprene). An-thropogenically produced CO results mainly from the combustion of fossil fuels domi-nantly in the northern hemisphere and from biomass burning in the tropics. The chem-ical lifetime of CO varies from about one month in the tropics to about a year in the
25
ACPD
3, 3713–3744, 2003 An improved infrared carbon monoxide analyser P. Nedelec et al. Title Page Abstract Introduction Conclusions References Tables Figures J I J I Back Close Full Screen / EscPrint Version Interactive Discussion
c
EGU 2003
sources, resulting in mixing ratios that vary widely over the planet.
Tropospheric CO concentrations have been measured globally at monitoring stations in the planetary boundary layer (Novelli et al., 1998 and references therein). Whilst air-craft, satellites and balloons are used for measurements of global CO, these data are relatively sparse compared to those measurements made within the boundary layer.
5
Vertical distributions of CO over continental regions were recently gathered by aircraft during several regional campaigns – see Emmons et al. (2000) for list, details and data composites maps issued from these measurements. During the STRATOZIII mission (Marenco et al., 1989), CO measurements were performed aboard an instrumented Caravelle aircraft between 70◦N–60◦S. More recently, a Japanese passenger aircraft
10
programme performed measurements of CO in the upper troposphere through auto-matic flask sampling system (Matsueda et al., 1998 and references therein) between 30◦N and 30◦S at approximately the longitude of Japan. A worldwide picture of CO dis-tribution patterns in the middle troposphere was clearly captured by the MAPS experi-ment (Reichle et al., 1986, 1990, 1999) in 1981, 1984 and 1994. Since the beginning
15
of 2000, the MOPITT instrument onboard the TERRA satellite has delivered a global picture of CO (Edwards et al. 2003).
Despite the existing CO measurements available for different regions, seasons, and resolutions, more frequent in-situ measurements are still necessary for a better under-standing of the global cycle of CO and to help improve our knowledge of other key
20
constituents such as ozone and OH. From the perspective the MOZAIC programme making CO measurements along with ozone and water vapour is particularly useful as it allows high ozone events to be attributed unambiguously to either a stratospheric or anthropogenic source.
Because of the usefulness of CO as a tracer, the MOZAIC programme (Marenco
25
et al., 1998) was extended to perform measurements of CO on-board the 5 aircraft already equipped with ozone and water vapour sensors. Since December 2001, the five MOZAIC aircraft have been successively equipped and now provide automatic CO measurements along the main routes operated by Lufthansa, Air France and Austrian
ACPD
3, 3713–3744, 2003 An improved infrared carbon monoxide analyser P. Nedelec et al. Title Page Abstract Introduction Conclusions References Tables Figures J I J I Back Close Full Screen / EscPrint Version Interactive Discussion
c
EGU 2003
airlines with 3, 1, and 1 aircraft respectively (see web site for detailshttp://www.aero.
obs-mip.fr/mozaic/). In the perspective of understanding the ozone budget, having the CO measurements along with ozone is of particular interest. CO is one of the main ozone precursors and as it is emitted directly by human activities, this makes it a good tracer species for anthropogenic emissions thus helping to differentiate the peaks of
5
ozone concentration (pollution or stratospheric intrusions).
The goals of this paper are two fold. Firstly, we present the measurements technique, the constraints imposed by automatic use onboard a passenger aircraft, the instrument validation and the quality testing. We then describe some scientific issues that have arisen from the first flights which have given new perspectives on regional and global
10
CO, O3and H2O distributions.
2. The MOZAIC CO analyser
2.1. Choice of the analytical principle
The MOZAIC programme is a long term programme involving automatic systems on-board five commercial Airbus A340 aircraft (Marenco et al., 1998). Since 1994, it
15
automatically collected measurements of ozone, water vapour and standard meteo-rological parameters (Pressure, Temperature, wind speed and direction) during more than 20 000 flights, which represents about 145 000 hours of flight. The instrumental environment in a commercial aircraft is harsh due to large temperature and pressure variations and strong vibrations mainly during take-off, landing, but also sometimes
dur-20
ing cruise. In addition, the maintenance of the MOZAIC systems is limited by the rare and short periods of availability of the aircraft at the airlines home bases. Due to prac-tical constraints, systems replacement due to failure can only be achieved every five to six weeks. For these reasons, the choice of the CO analyser has to be a compromise between measurement performance (response time, sensitivity), weight and long-term
25
ACPD
3, 3713–3744, 2003 An improved infrared carbon monoxide analyser P. Nedelec et al. Title Page Abstract Introduction Conclusions References Tables Figures J I J I Back Close Full Screen / EscPrint Version Interactive Discussion
c
EGU 2003
been used for measuring carbon monoxide onboard aircraft : grab samples followed by laboratory gas chromatographic analysis (Matsueda et al., 1998 and 1999), in-situ gas chromatography with FID or mercury vapour detectors (Marenco et al., 1989, Hoel et al., 1987), tunable diode laser (Sachse et al., 1987, 1991) or more recently reso-nance fluorescence instruments (Volz et al., 1985, Gerbig et al., 1996, Takegawa et
5
al., 2001). Although these methods are accurate and in the case of the last two offer fast response time, their use for long-term routine operation aboard aircraft remains difficult, as it is limited by the instruments weight and by the use of compressed gas for in-situ calibration. For the MOZAIC programme, where systems have to be oper-ated continuously for months without maintenance, another method has been chosen.
10
Although the IR gas filter correlation (GFC) is less sensitive than the other principles listed above, its simplicity, stability and recent improvements has made this choice re-alistic. It has been used extensively by different groups involved in long term ground based measurements (Dickerson et al., 1987, Parrish et al., 1994) and in intercom-parison campaigns with tunable diode laser (Fried et al., 1991). One of the important
15
advantages of this method is the long term stability of the calibration factor, which ob-viates the need for an in-situ calibration using compressed gas cylinders. This reduces the weight of the equipment, increases the time between services and leads to easier certification for commercial aircraft.
2.2. Principle and improvement of the sensor performance
20
The MOZAIC CO analyser is an improved version of a commercial Model 48CTL from Thermo Environmental Instruments, based on the Gas Filter Correlation principle of in-frared absorption by the 4.67 µm fundamental vibration-rotation band of CO. Radiation from an infrared source is chopped and passes through a gas filter which alternates be-tween CO and N2via the rotation of the filter wheel. The radiation then passes through
25
a narrow band pass filter and a multiple optical pass sample cell where absorption by the sample gas occurs. The IR radiation exits the sample cell and falls on a PbSe solid state IR detector. Other gases do not cause modulation of the detector signal since
ACPD
3, 3713–3744, 2003 An improved infrared carbon monoxide analyser P. Nedelec et al. Title Page Abstract Introduction Conclusions References Tables Figures J I J I Back Close Full Screen / EscPrint Version Interactive Discussion
c
EGU 2003
they absorb the reference and measure beams equally. Thus, the Gas Filter Correla-tion System responds specifically to CO. The Model 48CTL is qualified by U.S. EPA designated Method (EQSA-0486-060). The accuracy specification of the commercial instrument is 10 ppbv CO for 300 s integration time.
Several major modifications have been added by the authors in order to improve
5
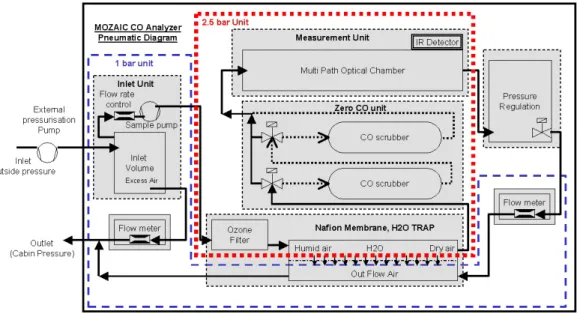
the Model 48CTL instrument characteristics (schematic diagram displayed on Fig. 1). The first one is to make periodical accurate zero measurements. This is necessary because of the zero drift of the instrument due to internal temperature fluctuations. A SOFNOCAT catalyst from Molecular Products Ltd. is used in a volume sufficient to remove CO by oxidising to CO2more than 99% of the atmospheric CO. This catalyst
10
is hydrophobic, so is not sensitive to water vapour variations in the air. The zero mode is applied for 40 s every 20 min and the zero level is linearly interpolated between two zeroes during data processing. During long term operation, a second catalyst element is periodically used in series to test the validity of the zeroing.
The second major modification is the use of a new PbSe IR detector (BxT2S series
15
from Cal Sensors, Inc.) with a two stage thermoelectric cooler integrated to regulate its temperature down to −30◦C. The lower temperature and the temperature regulation re-duce significantly the signal-to-noise ratio. The low voltage signal from the IR detector requires special care to ground the different elements of the instrument.
The third major modification increases and maintains the pressure within the
absorp-20
tion cell to 2.5 bar. This higher pressure provides more CO molecules for IR absorption, hence increases the signal-to-noise ratio by a factor about of two.
2.3. Laboratory tests
As major modifications have been applied to the commercial analyser (Model 48CTL), extensive laboratory tests have been conducted to validate the MOZAIC CO analyser.
25
The analysers are periodically calibrated in the laboratory using CO ppmv range con-centrations in air from compressed cylinders with a NIST specification for CO concen-tration and a dilution system which use calibrated mass flow controllers from Bronkhorst
ACPD
3, 3713–3744, 2003 An improved infrared carbon monoxide analyser P. Nedelec et al. Title Page Abstract Introduction Conclusions References Tables Figures J I J I Back Close Full Screen / EscPrint Version Interactive Discussion
c
EGU 2003
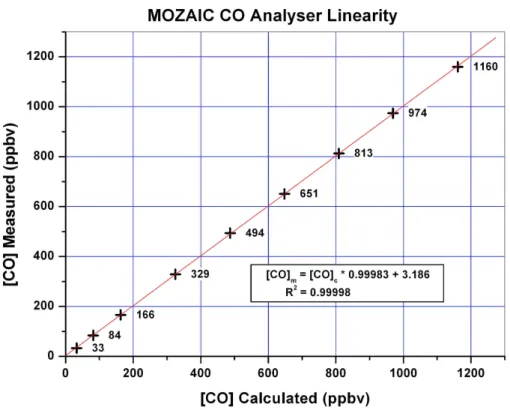
High-Tech BV. The linearity has been checked between 0 and 1160 ppbv (Fig. 2) and is shown to be almost one (the 3 ppbv offset is due to the precision of the zeroing which is ±5 ppbv). Several months of operation onboard the aircraft have not, up to the present, affected the calibration of the instruments, as all the instrument voltages and pressure are regulated and recorded. The absence of rapidly consumed calibration cylinders in
5
the aircraft was a major issue for MOZAIC analysers operation without maintenance for several months.
High concentrations of water vapour in the troposphere are a major interference in atmospheric CO measurements at ppb levels (Dickerson et al., 1987), due to signif-icant water vapour IR absorption. A Nafion membrane from Perma Pure, Inc. was
10
installed to dry the air before the measurement, using the pressure difference between the pressurised stage and ambient pressure stages (Fig. 1). The water molecules from the pressurised air move through the Nafion membrane wall and evaporate into the lower pressure air. The interference of water vapour has been experimentally tested in laboratory, at the Centre d’Aviation M ´et ´eorologique facilities (M ´et ´eo-France). If the
15
Nafion drier is not used, the artefact measured concentration is about+6 ppbv CO per hPa H2O. This can compared to the 12 ppbv CO per hPa H2O found by other authors (Fried et al., 1991). This difference may be explained by the 2.5 bar pressure used in this instrument but not by Fried et al. The artefact is apparent in both the sam-ple and zero modes, as the zero catalyst is hydrophobic. This could result in no net
20
interference, but water vapour concentrations can change extremely rapidly in the at-mosphere, especially when sampled by high speed aircraft, so it is critical to remove this interference directly. Laboratory tests made with the Nafion membrane installed show that the artefact CO signal from water vapour is negligible.
Ozone can reach high concentrations in the low stratosphere (ppmv level) and can
25
potentially act as an interference with transition bands of ozone overlapping the CO fundamental band (Dickerson et al., 1987). A commercial ozone trap made of MnO2 has been added before the measuring cell (Fig. 1) and ozone interference has been checked in the laboratory up to 1 ppmv ozone and has been found to be non existent.
ACPD
3, 3713–3744, 2003 An improved infrared carbon monoxide analyser P. Nedelec et al. Title Page Abstract Introduction Conclusions References Tables Figures J I J I Back Close Full Screen / EscPrint Version Interactive Discussion
c
EGU 2003
In addition, the first months of MOZAIC measurements in the stratosphere have clearly shown no correlation between measured CO and stratospheric ozone values in the range 400–1000 ppbv.
2.4. Instrument specifications
As the MOZAIC systems including the CO analysers are installed on commercial Airbus
5
A340 aircraft, they have been certified according to the European Joint Aviation Author-ities (JAA) requirements. This qualification has been achieved by EADS in Toulouse during the MOZAIC III programme. It includes structural modifications and shock ab-sorber installation, EMI and vibration tests which were performed at EADS facilities, smoke and overheating detection and the use of aeronautic electrical components. The
10
final weight of the MOZAIC CO analyser is 29 kg with 170 Watt power consumption. For operation at high altitudes up to 12.4 km (180 mbar), an external pressurisation pump is used (KNF Neuberger, Inc., Model N035, 11.2 kg). Before the final Airbus validation of this new CO analyser, five test flights have been performed in 1999 and 2000 using the Airbus Industrie A340 MSN001 prototype aircraft. This has proven the operation of
15
the analyser in flight conditions, at high altitudes up to the A340 maximum altitude of 41 000 feet (12.4 km).
These flights have shown the instrument stability for measuring low concentrations of CO, down to a mean of 40 ppbv CO concentrations observed in the stratosphere. The specifications achieved for 30 s integration time (response time of the instrument
20
to flush the absorption cell) are the following: precision ±5 ppbv CO (noise), ±5% (calibration), minimum detectable 10 ppbv CO. As the Airbus A340 aircraft maximum cruise speed is nearly 250 m/s, this analyser samples at a horizontal resolution of about 7 km, and a vertical resolution of about 300 m during ascents and descents. The CO analysers are now installed on the five MOZAIC equipped Airbus A340, operated free
25
ACPD
3, 3713–3744, 2003 An improved infrared carbon monoxide analyser P. Nedelec et al. Title Page Abstract Introduction Conclusions References Tables Figures J I J I Back Close Full Screen / EscPrint Version Interactive Discussion
c
EGU 2003
2.5. CO measurements in-flight comparisons 2.5.1. Dedicated research aircraft experiments
The MOZAIC CO analyser has also been flown and tested on a variety of European research aircraft: M ´et ´eo-France Merlin IV for test flights in 2000, CNRS/INSU Das-sault Myst `ere 20 for the PICO3 campaign in October 2000, CNRS/INSU Fokker 27
5
“ARAT” during the ESCOMPTE campaign in July 2001 and the DLR Falcon 20 during CAATER2 in October 2002 (Co-ordinated Access to Aircraft for Trans-national Environ-mental Research). These comparison flights afforded the opportunity to compare the MOZAIC instrument with two other measurement methods.
The intercomparison flight presented in Fig. 3 was performed on May 24th 2000,
10
aboard the M ´et ´eo- France Merlin IV. The objective of this flight above the Orl ´eans forest (south of Paris, France) was to compare the continuous CO measurements made by the MOZAIC analyser with whole air samples which were analysed post-flight by LSCE (Laboratoire des Sciences du Climat et de l’Environnement, Paris, France) for the RAM-CES programme (Gros et al., 1998). The LSCE routine CO analysis is made using a
15
Trace Analytical RGA3 chromatograph with mercury vapour detector, with a precision of 5 ppbv CO, calibrated with Air Liquide compressed cylinders, certified against the gravimetric scale from NOAA/CMDL. Twelve air samples were analysed by laboratory GC at different altitudes between 300 and 5700 m. The agreement with the MOZAIC CO analyser is good, particularly as the humidity variations found during this flight were
20
large (0.5 to 8 gH2O/kgAir).
The second comparison flight was undertaken on 7 July 2001, during the ESCOMPTE campaign (Cros et al., 2003). It was a flight dedicated to comparing measurements made by different aircraft. The Fokker 27 equipped with the MOZAIC CO analyser was flown together with the Dornier 128 (Corsmeier et al., 2001) operated by the Institute of
25
Meteorology and Climate Research, Forschungszentrum Karlsruhe (Germany). This aircraft was equipped with an Aerolaser AL5001 vacuum UV resonance fluorescence CO instrument (Gerbig et al., 1999). During nearly three hours of flight, the aircraft
ACPD
3, 3713–3744, 2003 An improved infrared carbon monoxide analyser P. Nedelec et al. Title Page Abstract Introduction Conclusions References Tables Figures J I J I Back Close Full Screen / EscPrint Version Interactive Discussion
c
EGU 2003
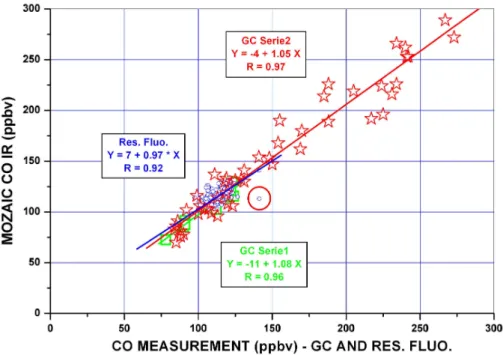
altitudes ranged between 150 and 3000 m altitude in the Marseille (France) area, with water vapour ranging from 4 to 9 g H2O/kgAir. No large pollution plumes were en-countered (stable 10 knots north-west wind), CO values ranging from 100 to 140 ppbv. However, two small pollution plumes of 140 ppbv CO were observed, one being seen by both instruments (lasting 30 s, 1 km), the second one (lasting 15 s, 0.5 km) was only
5
observed by the fast response Aerolaser instrument. This event is circled in red on Fig. 4 and reflects the limitation of the IR instrument in term of sensitivity and response time, compared to the resonance fluorescence instrument. The lower regression coef-ficient of 0.92 of the Dornier instrument may be caused by the different response times of the compared instruments.
10
The third comparison was performed on 2 and 3 October 2002, during the CAATERII campaign. The MOZAIC CO analyser was installed in the DLR operated Falcon 20. The first flight was between Oberpfaffenhofen (Germany), Orl´eans (France), Pader-borne (Germany), the second flight was from PaderPader-borne to Balaton (Hungary) and the final flight was between Balaton and Salzburg (Austria). The flights were mainly
15
below 1000 m altitude, with profiles up to 5000 m altitude. Flask samples were made by LSCE and subsequent analysis by gas chromatography as for the RAMCES pro-gramme (see previous text).
The Falcon flights occurred mainly in the central European boundary layer and sam-pled higher CO concentrations (150–270 ppbv) than those described earlier by the
20
Merlin and Fokker flights performed in relatively clean air, the CO concentration ranging between 80 and 140 ppbv. Figure 4 presents the comparisons between the MOZAIC CO analyser, the resonance fluorescence instrument and the GC analysis for the flask samples during the two campaigns (Series1 for Merlin flights and Series2 for the three Falcon flights). For the flask samples comparison, MOZAIC CO data have been
aver-25
aged over the time intervals in which the flask samples were filled.
The linear regressions and correlation factors calculated for the three inter-comparison (see Fig. 4) show the good agreement between the MOZAIC IR instrument and the two other methods: resonance-fluorescence and flask samples/gas chromatography. This
ACPD
3, 3713–3744, 2003 An improved infrared carbon monoxide analyser P. Nedelec et al. Title Page Abstract Introduction Conclusions References Tables Figures J I J I Back Close Full Screen / EscPrint Version Interactive Discussion
c
EGU 2003
clearly shows that this new instrument is highly suitable for making measurements of CO in the atmosphere.
2.5.2. Co-located MOZAIC aircraft
As MOZAIC systems are installed on five commercial aircraft operating from Europe over long range routes, aircraft are roughly co-located a few times per month, both
5
spatially and temporally . These events offer clear opportunities to inter-compare the measurements made by the different aircraft. This has been done systematically since 1994 for ozone (Marenco et al., 1998) and is now applied to the new CO measure-ments. Figure 5 presents the CO measurements made by two MOZAIC aircraft and shows good agreement between the two systems, within the measurement uncertainty
10
(±5 ppbv CO , ±5%).
3. First scientific results using new CO measurements
To show the scientific usefulness of the new MOZAIC CO measurements 3 case stud-ies are presented here which highlight different potential uses of these measurements. 3.1. Vertical profiles
15
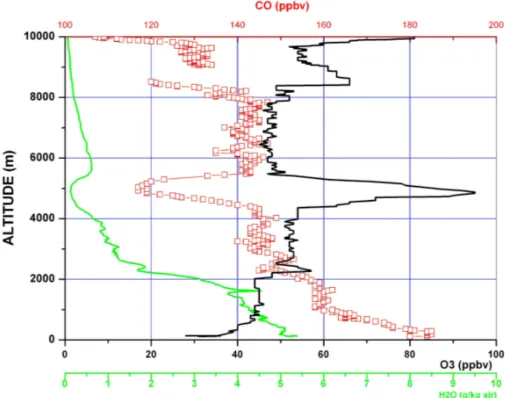
The first case study is a typical example of a winter mid-latitude tropopause fold ob-served during a take-off from Frankfurt. Figure 6 shows a 1-km deep layer at a height of 5000 m altitude which is defined by a maximum in the ozone mixing ratio (up to 95 ppbv), and minima in the carbon monoxide and water vapour mixing ratios (down to 112 ppbv and 0.2 g/kg respectively). Similar mixing ratio of O3, CO, and H2O are
20
not sampled elsewhere in the vertical profile until the aircraft enters the stratosphere at a height of 10 km. Baroclinic signatures that further characterize the tropopause folding process from which this layer originates are the change in the temperature
ACPD
3, 3713–3744, 2003 An improved infrared carbon monoxide analyser P. Nedelec et al. Title Page Abstract Introduction Conclusions References Tables Figures J I J I Back Close Full Screen / EscPrint Version Interactive Discussion
c
EGU 2003
lapse rate and the strong vertical wind shear observed in this MOZAIC vertical pro-file (not shown). The difference in the relative variations of tracers inside the layer, 90% increase in ozone and 25% decrease in carbon monoxide, is mainly due to the difference of integration time between the two analysers, i.e. 4 s for ozone and 30 s for carbon monoxide, leading to about 40 m and 300 m for the vertical resolution,
re-5
spectively. Technical improvements in the IR detector of the CO analyser to improve the temporal and hence the spatial resolution of the instrument are currently on trial. The response time of the MOZAIC humidity sensor is about 30 s around 5 km altitude (Helten et al., 1998), which gives a 300 m vertical resolution for the signature of the dryness of the tropopause fold. Such a vertical resolution (300 m for both the H2O and
10
CO measurements) is well suited to the validation requirements of present mesoscale numerical models studying the budget of trace gases in the planetary boundary layer and in the free troposphere.
A synoptic study of the meteorological situation, performed using ECMWF analyses, highlights the existence of a tropopause fold over Frankfurt on that day. An
upper-15
level trough moved over Frankfurt (Fig. 7) which is situated just west of the vertical tropopause break on the cyclonic-shear side of the polar jet-stream. Upper-level fron-togenesis has developed a stratospheric intrusion whose horizontal extension on the 296-K isentropic surface (Fig. 8) draws a tongue of relatively high potential vorticity (exceeding 0.75 pvu) stretching along the vertical tropopause break in the region of
20
Frankfurt. In the vertical plane across the polar jet stream and Frankfurt (Fig. 9), the tropopause fold appears like a typical stratospheric intrusion with potential vorticity isocontours slanting along isentropic surfaces. The vertical profile performed by the aircraft (Fig. 6) occurs approximately in the middle of the vertical cross-section of the stratospheric intrusion (Fig. 9).
25
3.2. UTLS studies
The second case study concerns a stratospheric filament sampled over the Atlantic during the cruise phase of the very first MOZAIC-III flight performed with O3, H2O
ACPD
3, 3713–3744, 2003 An improved infrared carbon monoxide analyser P. Nedelec et al. Title Page Abstract Introduction Conclusions References Tables Figures J I J I Back Close Full Screen / EscPrint Version Interactive Discussion
c
EGU 2003
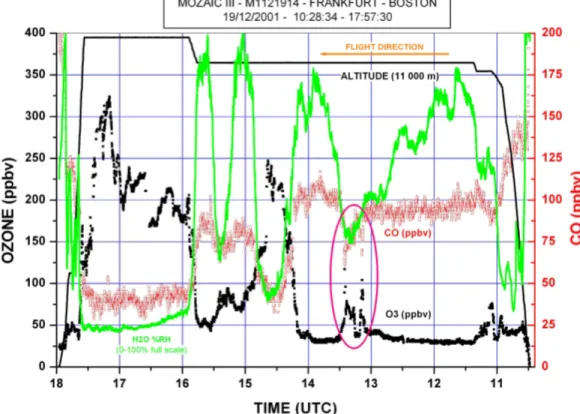
and CO analysers on 19 December 2001. Figure 10 shows that the aircraft flying in both the troposphere, typified by low mixing ratios of O3, high mixing ratios of CO, and relatively high values of humidity (for example between 11:24 and 12:49 UTC), and within the stratosphere typified by high mixing ratios of O3, low mixing ratios of CO, and low relative humidity (for example between 15:52 and 17:31 UTC for instance). An
5
zoomed-in view of the MOZAIC measurements during a period of strong O3gradients is displayed in Fig. 11. Compared to the upper tropospheric background values of O3 (30–40 ppbv) and CO (90–100 ppbv), two air masses of stratospheric-origin can be defined by the simultaneous increase of O3 concentration and decrease of CO concentration. Labelled (1) and (2) in Fig. 11, they have length of 77 km and 220 km
10
respectively, and are separated by a tropospheric episode of about 70 km length (from 13:10 to 13:15 UTC). The two ozone “cores” (O3 in excess of about 80 ppbv) have lengths of about 20–30 km and are sampled with 1 km horizontal resolution (4 s at 250 ms−1 cruise speed). The CO horizontal resolution (∼7 km at cruise level) is still enough good to get several independent samples in the ozone cores so that the CO
15
signatures are significant. However, the time response of the water vapour sensor at cruise altitude is several minutes (Helten et al., 1998) which does not allow the structure seen in O3and CO to be captured.
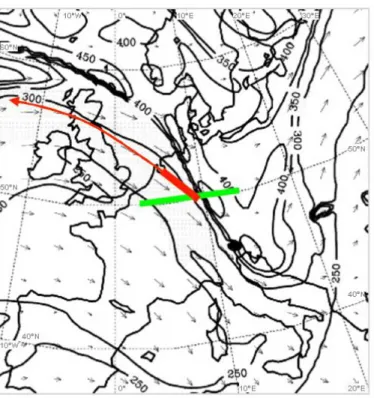
A synoptic study of the meteorological situation, again performed with ECMWF anal-yses, shows that the aircraft flew through a stratospheric filament stretching from
20
the mid-Atlantic south of Greenland to Portugal (Fig. 12). The vertical cross-section (Fig. 13) along the aircraft path (delimited by the start and end points of the time series shown on Fig. 11) confirms the local breakdown of the height of the tropopause. Nev-ertheless, neither the isobaric distribution of potential vorticity near the aircraft flight level nor the vertical cross-section of potential vorticity along the aircraft path
repro-25
duces the internal mesoscale structure of the filament as shown by MOZAIC in-situ data. The information content of MOZAIC data on mesoscale atmospheric structures is high compared to up-to-date numerical analyses and thus appropriate for mesoscale numerical models.
ACPD
3, 3713–3744, 2003 An improved infrared carbon monoxide analyser P. Nedelec et al. Title Page Abstract Introduction Conclusions References Tables Figures J I J I Back Close Full Screen / EscPrint Version Interactive Discussion
c
EGU 2003
3.3. Tropical studies
Whereas the magnitude of CO sources over Europe and North America (due to en-ergy production, transport etc.) are believed to be well constrained, emissions of CO from less-developed and typically tropical regions (due to two-stroke engines, biomass burning, small scale coal combustion etc.) are much less well understood.
Understand-5
ing the magnitude of the emissions from these less developed regions in important in understanding the past, present and future concentrations of CO in the atmosphere (Dickerson et al., 2002). MOZAIC flights in tropical regions are therefore particularly appropriated to study the composition of the atmosphere for which budgets of O3and CO are of interest. Furthermore, as these commercial aircraft perform round trip flights,
10
landing and take-off flight gives a way to document the time evolution of the vertical profile over a given place. For example MOZAIC flights to India (Frankfurt-Mumbai-Frankfurt), or Africa (Frankfurt-Lagos-Accra-Lagos-Frankfurt) provide 2 (Mumbai) or 4 (Lagos) vertical profiles of the planetary boundary layer within a few hours of each other. As an illustration of the potential of MOZAIC data over the tropics, the third
15
case study highlights the composition of the planetary boundary layer over Mumbai during the dry season. On 24 February 2002, a descent over Mumbai at approximately 18:00 UTC (not shown) is followed by an ascent at around 21:30 UTC (Fig. 14).
The top of the planetary boundary layer is defined by the sharp decrease of wa-ter vapour, ozone and carbon monoxide mixing ratios at an altitude of 2500 m. The
20
polluted planetary boundary layer is laden with O3 and CO. A further examination of tracer variations leads to the identification of three layers within the boundary layer. The first is below the top of the planetary boundary layer at 2000 m altitude which is characterized by a maximum in both H2O, O3, and CO mixing ratio, the second is at an altitude around 1000 m which is rather dry, has a relative minimum in CO mixing ratio
25
and a strong vertical gradient of O3, and the third layer is located below 500 m and is characterized by high values of relative humidity and CO and shows the signature of the dry deposition process of O3to the surface.
ACPD
3, 3713–3744, 2003 An improved infrared carbon monoxide analyser P. Nedelec et al. Title Page Abstract Introduction Conclusions References Tables Figures J I J I Back Close Full Screen / EscPrint Version Interactive Discussion
c
EGU 2003
4. Conclusions
MOZAIC is a unique programme which provides regular sampling of the UTLS region and performs vertical profiles over a variety of different locations across the globe (with the notable except of the Pacific, up to now). The routinely-operated CO analysers developed and flown for the MOZAIC programme will provide an extensive data base
5
over several years for carbon monoxide, as already been provided for ozone and water vapour since 1994. On one aircraft, additional NOymeasurements (Volz-Thomas from FZ J ¨ulich, Germany) complement the suite of measurements. From December 2001 to May 2003, more than 1300 long range flights have been obtained with simultaneous O3, CO and H2O measurements (nearly 10 000 flight hours).
10
The first year of operation of the routine MOZAIC CO analyser have shown the MOZAIC CO analyser’s reliability in the difficult operational conditions of commercial aircraft. The instrument performance (±5 ppbv CO , ±5%) is suitable for atmospheric studies, no interferences have been seen and in-flight comparisons with other mea-surement techniques have been positive. Future developments are planned for this
15
method, including an improvement of the sensitivity/response time by use of a new generation IR detectors and the weight reduction of the entire MOZAIC systems by integration of the O3and CO instruments with a single acquisition computer.
Acknowledgements. The MOZAIC programme is supported by the European Commission
(EVK2-CT1999-00015). We express our gratitude to Lufthansa, Air France, Austrian Airlines and
20
Sabena which have carried the MOZAIC systems free of charge since 1994. Many thanks go to the organisations which made possible the different flight tests of the instruments: Airbus on A340 MSN001, Centre d’Aviation M ´et ´eorologique of M ´et ´eo-France on Merlin IV, Institut Na-tional des Sciences de l’Univers et de l’Environnement from CNRS on the Fokker 27 “ARAT” and Dassault Myst `ere 20. For the intercomparisons flights, many thanks go to Laboratoire des
25
Sciences du Climat et de l’Environnement (CNRS-CEA) and to the Institute of Meteorology and Climate Research Forschungszentrum Karlsruhe for the Resonance-Fluorescence mea-surements on the Dornier 128.
ACPD
3, 3713–3744, 2003 An improved infrared carbon monoxide analyser P. Nedelec et al. Title Page Abstract Introduction Conclusions References Tables Figures J I J I Back Close Full Screen / EscPrint Version Interactive Discussion
c
EGU 2003
References
Corsmeier, U., Hanker, R., and Wieser, A.: Airborne turbulence measurements in the lower tro-posphere onboard the research aircraft Dornier 128-6, D-IUBF, Meteorologische Zeitschrift, 10, 4, 315–329, August 2001.
Cros B., Durand, P., Frejafon, E., Kottmeier, C., Perros, P. E., Peuch, V.-H., Robin, D., Sad, F.,
5
Toupance, G., and Wortham, H.: The ESCOMPTE programme: An overview, accepted to Atmospheric Research, 2003.
Dickerson, R. R. and Delany, A. C.: Modification of a commercial gas filter correlation CO detector for enhanced sensitivity. J. Atmos. Oceanic Technol., 5, 424–431, 1987.
Dickerson, R. R., Andreae, M. O., Campsos, T., Mayol-Bracero, O. L., Neusuess, C., and
10
Streets, D. G.: Analysis of black carbon and carbon monoxide observed over the In-dian Ocean: Implications for emissions and photochemistry. J. Geophys. Res, 107, 8017, doi:10.1029/2001JD000501, 2002.
Fried, A., Henry, B., Parrish, D. D., Carpenter, J. R., and Buhr, M. P.: Intercomparison of tunable diode laser and gas filter correlation measurements of ambient carbon monoxide,
15
Atmos. Environ.,25A, 2277–2284, 1991.
Edwards, D., Lamarque, J.-F., Atti ´e, J.-L., Emmons, L. K., Richter, A., Cammas, J.-P., Lyjak, L. V., Francis, G. L., Gille, J. C., and Drummond, J. R.: Tropospheric ozone over the tropical Atlantic: A satellite perspective, J.Geophys. Res., accepted, 2003.
Emmons, L. K., Hauglustaine, D. A., Muller, J.-F., Caroll, M. A., Brasseur, G. P., Brunner, D.,
20
Staehelin, J., Thouret, V. and Marenco, A.: Data composites of airborne observations of tropospheric ozone and its precursors. J. Geophys. Res. 105, 20 497–20 538, 2000.
Gerbig. C., Smitgen, S., Kley, D., Volz-Thomas, A., Dewey, H., and Haaks, D.: An improved fast response vacuum UV resonance fluorescence CO instrument, J. Geophys. Res., 104, 1699–1704, 1999.
25
Gerbig, C., Kley, D., Volz-Thomas, A., Kent, J., Dewey, K., and McKenna, D. S.: Fast response resonance fluorescence CO measurements aboard the C-130: Instrument characterisation and measurements made during North Atlantic Regional Experiment 1993, J. Geophys. Res., 101, 29 229–29 238, 1996.
Gros, V., Sarda-Esteve, R., Bonsang, B., Ramonet, M., and Valant, C.: Mesure du monoxyde de
30
carbone par chromatographie en phase gazeuse – DSM-LSCE, CEA-R-5814, CEA Saclay, 1998.
ACPD
3, 3713–3744, 2003 An improved infrared carbon monoxide analyser P. Nedelec et al. Title Page Abstract Introduction Conclusions References Tables Figures J I J I Back Close Full Screen / EscPrint Version Interactive Discussion
c
EGU 2003
Helten, M., Smit, H. G. J., Str ¨ater, W., Kley, D., Nedelec, P., Z ¨oger, M., and Busen, R.: Calibra-tion and performance of automatic compact instrumentaCalibra-tion for the measurement of relative humidity from passenger aircraft, J. Geophys. Res., 103, 25 643–25 652, 1998.
Hoel, J. M., Jr., Gregory, G. L., McDougal, D. S., Sachse, G. W., Hill, G. F., Condon, E. P., and Rasmussen, R. A.: Airborne intercomparison of carbon monoxide measurement techniques,
5
J. Geophys. Res., 92, 2009–2019, 1987.
Logan, J. A., Prather, M. J., Wofsy, S. C., and McElroy, M. B.: Tropospheric chemistry : A global perspective, J. Geophys. Res., 86, 7210–7254, 1981.
Marenco, A., Thouret, V., N ´ed ´elec, P., Smit, H. G. J., Helten, M., Kley, D., Karcher, F., Simon, P., Law, K., Pyle, J., Poschmann, G., von Wrede, R., Hume, C., and Cook, T.: Measurement
10
of ozone and water vapour by Airbus in-service aircraft: The MOZAIC airborne programme, An overview, J. Geophys. Res., 103, 25 631–25 642, 1998.
Marenco, A., Macaigne, M., and Prieur, S.: Meridional and vertical CO and CH4distributions in the background troposphere (70◦N–60◦S ;0–12 km altitude) from scientific aircraft measure-ments during the STRATOZ III experiment, Atmos. Environ.,23, 185–200, 1989.
15
Matsueda, H., Inoue, Y., Sawa, Y., Tsutsumi, Y., and Ishii, M.: Carbon monoxide in the up-per troposphere over the western Pacific between 1993 and 1996, J. Geophys. Res., 103, 19 093–19 110, 1998.
Matsueda, H., Inoue, H. Y., Sawa, Y., Tsutsumi, Y., and Ishii, M.: Carbon monoxide in the upper troposphere over the western Pacific between 1993 and 1996. J. Geophys. Res., 103,
20
19 093–19 110, 1998.
Matsueda, H. and Inoue, H. Y.: Aircraft measurements of trace gases between Japan and Singapore in October 1993, 1996, and 1997, J. Geophys. Res., 26, 2413–2416, 1999. Novelli, P., Masarie, K. A., and Lang, P. M.: Distributions and recent changes of carbon
monox-ide in the lower tropsphere, J. Geophys. Res. 103, 19 015–19 033, 1998.
25
Parrish, D. D., Holloway, J. S., and Fehsenfeld, F. C.: Routine, continuous measurement of car-bon monoxide with parts per billion precision. Environ. Sci. Tecnol., 28, 1615–1618, 1994. Reichle, H. G., Connors, V. S., Holland, J. A., Hypes, W. D., Wallio, H. A., Casas, J. C.,
Gorm-sen, B. B., Saylor, M. S., and Hesketh, W. D.: Middle and upper tropospheric carbon monox-ide mixing ratios as measured by a satellite-borne remote sensor during November 1981, J.
30
Geophys. Res., 91, 10 865–10 887, 1986.
Reichle, H. G., Connors, V. S., Holland, J. A., Sherrill, R. T., Wallio, H. A., Casas, J. C., Con-don, E. P., Gormsen, B. B., and Seiler, W.: The distribution of middle tropospheric carbon
ACPD
3, 3713–3744, 2003 An improved infrared carbon monoxide analyser P. Nedelec et al. Title Page Abstract Introduction Conclusions References Tables Figures J I J I Back Close Full Screen / EscPrint Version Interactive Discussion
c
EGU 2003
monoxide during early October 1984, J. Geophys. Res., 95, 9845–9856, 1990.
Reichle Jr., H. G., Anderson, B. E., Connors, V. S., Denkins, T. C., Forbes, D. A., Gormsen, B. B., Langenfelds, R. L., Neil, D. O., Nolf, S. R., Novelli, P. C., Pougatchev, N. S., Roell, M. M., Steele, L. P.: Space shuttle based global CO measurements during April and October 1994, MAPS instrument, data reduction, and data validation, J. Geophys. Res. 104, 21 443–21 454,
5
1999.
Sachse, G. W., Hill, G. F., Wade, L. O., and Perry, M. G.: Fast-response, high-precision carbon monoxide sensor using a tunable diode laser absorption technique, J. Geophys. Res., 92, 2071–2081, 1987.
Sachse, G. W., Collins, J. E., Jr., Hill, G. F., Wade, L. O., Burney, L. G., and Ritter, J. A.:
10
Airborne tunable diode laser sensor for high precision concentration and flux measurements of carbon monoxide and methane, SPIE Proceedings, 1991.
Takegawa, N., Kita, K., Kondo, Y., Matsumi, Y., Parrish, D. D., Holloway, J. S., Koite, M., Miyazaki, Y., Toriyama, N., Kawakami, S., and Ogawa, T.: Airborne vacuum ultraviolet reso-nance fluorescence instrument for in situ measurement of CO, J. Geophys. Res., 106, NO.
15
D20, 24 237–24 244, 2001.
Thompson, A. M. and Ciccerone, R. J.: Posssible perturbations of atmospheric CO, CH4and OH, J. Geophys. Res., 91, 10 853–10 864, 1986.
Volz, A. and Kley, D.: A Resonance-Fluorescence Instrument for the In-Situ Measurement of Atmospheric Carbon Monoxide. J. Atmos. Chem., 2, 345–357, 1985.
ACPD
3, 3713–3744, 2003 An improved infrared carbon monoxide analyser P. Nedelec et al. Title Page Abstract Introduction Conclusions References Tables Figures J I J I Back Close Full Screen / EscPrint Version Interactive Discussion
c
EGU 2003
Fig. 1. MOZAIC CO analyser schematic diagram. Air from outside is pressurised to aircraft cabin pressure at the inlet volume, then passes through ozone and water vapour traps. For zeroing, the sampled air can be passed via one or two CO scrubbers before entering the pressurised optical chamber where IR absorption occurs.
ACPD
3, 3713–3744, 2003 An improved infrared carbon monoxide analyser P. Nedelec et al. Title Page Abstract Introduction Conclusions References Tables Figures J I J I Back Close Full Screen / EscPrint Version Interactive Discussion
c
EGU 2003
Fig. 2. MOZAIC CO analyser linearity in the current atmospheric CO ranges, using NIST com-pressed cylinders ppmv range CO in air. The dilution system was using Mass Flow controllers from Bronkhorst Hi-Tec B.V. The linearity of the instrument is almost 1, the −3.16 ppbv offset coming from the zero measurement precision (±5 ppbv).
ACPD
3, 3713–3744, 2003 An improved infrared carbon monoxide analyser P. Nedelec et al. Title Page Abstract Introduction Conclusions References Tables Figures J I J I Back Close Full Screen / EscPrint Version Interactive Discussion
c
EGU 2003
Fig. 3. Aircraft test flight realised on 24 May 2000, on M ´et ´eo-France Merlin IV up to 5.7 km altitude (green line). MOZAIC CO analyser in-situ measurements (black line and circles) are plotted with post-flight laboratory GC analysis of 12 grab samples (red squares). Agreement between both is within the uncertainty of the two methods. In particular, the water vapour variations between 0.5 and 8 g/kg air do not show any influence.
ACPD
3, 3713–3744, 2003 An improved infrared carbon monoxide analyser P. Nedelec et al. Title Page Abstract Introduction Conclusions References Tables Figures J I J I Back Close Full Screen / EscPrint Version Interactive Discussion
c
EGU 2003
Fig. 4. Regression of the overlapping CO measurements during five intercomparison flights, with MOZAIC CO measurements on the vertical scale. Blue points are the measurements made by the Dornier 128 Aerolaser UV resonance fluorescence instrument. The one circled in red represents a plume not captured by MOZAIC CO analyser. Green squares are the flask samples GC analysis by LSCE for the M ´et ´eo-France Merlin IV flight. Red stars are the GC analysis by LSCE for the DLR Falcon 20 flights. Linear regressions are drawn in corresponding colours, with their calculation.
ACPD
3, 3713–3744, 2003 An improved infrared carbon monoxide analyser P. Nedelec et al. Title Page Abstract Introduction Conclusions References Tables Figures J I J I Back Close Full Screen / EscPrint Version Interactive Discussion
c
EGU 2003
Fig. 5. Two MOZAIC aircraft during flights from Chicago to Munich and from Detroit to Frankfurt, on 10 October 2002. The aircraft coincidence is during 2 hours and 20 min over the Atlantic ocean between 50◦N, 50◦W and 53◦N, 15◦W. The two Lufthansa aircraft are flying at 37 000 feet (11 250 m), with a lag time of only 10 min. CO measurements are shown with 30 second mean values, with their uncertainty bars (±5 ppbv, ±5%), in red for the first aircraft, blue for the second one 10 min later.
ACPD
3, 3713–3744, 2003 An improved infrared carbon monoxide analyser P. Nedelec et al. Title Page Abstract Introduction Conclusions References Tables Figures J I J I Back Close Full Screen / EscPrint Version Interactive Discussion
c
EGU 2003
Fig. 6. Vertical profile over Frankfurt (Germany) on 10 February 2002 from 12:34 UTC to 13:01 UTC. Shown are the mixing ratio of ozone (ppbv, black solid line), carbon monoxide (ppbv, red square line) and water vapour (g/kg, green line) versus altitude (m).
ACPD
3, 3713–3744, 2003 An improved infrared carbon monoxide analyser P. Nedelec et al. Title Page Abstract Introduction Conclusions References Tables Figures J I J I Back Close Full Screen / EscPrint Version Interactive Discussion
c
EGU 2003
Fig. 7. Pressure (contours every 50 hPa) and wind (vectors, shading for wind speeds in excess of 50 ms−1) at the tropopause (defined as 1.5 pvu surface) on 10 February 2002, 12:00 UTC from ECMWF analyses. Horizontal line of the vertical cross-section shown on Fig. 9 is displayed in green about 50◦N. Flight track is displayed in red, larger for the ascending part of the flight.
ACPD
3, 3713–3744, 2003 An improved infrared carbon monoxide analyser P. Nedelec et al. Title Page Abstract Introduction Conclusions References Tables Figures J I J I Back Close Full Screen / EscPrint Version Interactive Discussion
c
EGU 2003
Fig. 8. Potential vorticity (contours every 0.75 pvu) and wind vectors on the 296 K isentropic surface on 10 February 2002, 12:00 UTC from ECMWF analyses. Horizontal line of the vertical cross-section shown on Fig. 9 is displayed in green about 50◦N. Flight track is displayed in red, larger for the ascent.
ACPD
3, 3713–3744, 2003 An improved infrared carbon monoxide analyser P. Nedelec et al. Title Page Abstract Introduction Conclusions References Tables Figures J I J I Back Close Full Screen / EscPrint Version Interactive Discussion
c
EGU 2003
Fig. 9. Vertical cross section of potential vorticity (solid contours, every 0.75 pvu, shaded be-tween 1.5 and 3.0 pvu) and potential temperature (dashed lines, every 4 K) on 10 February 2002, 12:00 UTC. The line of cross section goes from 50.3◦N–3.1◦E to 50.2◦N–13.2◦E, the as-cent from Frankfurt is displayed in red. The pressure altitude of the ozone maximum is the blue dashed line.
ACPD
3, 3713–3744, 2003 An improved infrared carbon monoxide analyser P. Nedelec et al. Title Page Abstract Introduction Conclusions References Tables Figures J I J I Back Close Full Screen / EscPrint Version Interactive Discussion
c
EGU 2003
Fig. 10. Time series of MOZAIC parameters during a flight from Frankfurt to Boston on 19 De-cember 2001 from 10:28 to 17:57 UTC: ozone mixing ratio (ppbv, black dots), carbon monoxide mixing ratio (ppbv, red line), relative humidity (%, green line) and flight altitude with flight direc-tion (m, black line). The region of the stratospheric filament is indicated by the pink circle, a zoom on the time series of MOZAIC parameters in this region is displayed on Fig. 11.
ACPD
3, 3713–3744, 2003 An improved infrared carbon monoxide analyser P. Nedelec et al. Title Page Abstract Introduction Conclusions References Tables Figures J I J I Back Close Full Screen / EscPrint Version Interactive Discussion
c
EGU 2003
Fig. 11. Time series of MOZAIC parameters during a flight from Frankfurt to Boston on 19 De-cember 2001 from 12:50 to 13:40 UTC: ozone mixing ratio (ppbv, black dots), carbon monoxide mixing ratio (ppbv, red line), relative humidity (%, green line) and flight direction arrow (orange). Stratospheric episodes discussed in the text are labelled (1) and (2).
ACPD
3, 3713–3744, 2003 An improved infrared carbon monoxide analyser P. Nedelec et al. Title Page Abstract Introduction Conclusions References Tables Figures J I J I Back Close Full Screen / EscPrint Version Interactive Discussion
c
EGU 2003
Fig. 12. Potential vorticity (contours every 1 pvu, shaded for values in excess of 3 pvu) at 250 hPa (near the flight level, ∼=227 hPa) on 19 December 2001, 12:00 UTC from ECMWF analyses. The red horizontal line near 55◦ N represents the flight path, the vertical lines in dashed blue highlights the period 12:50 to 13:40 UTC.
ACPD
3, 3713–3744, 2003 An improved infrared carbon monoxide analyser P. Nedelec et al. Title Page Abstract Introduction Conclusions References Tables Figures J I J I Back Close Full Screen / EscPrint Version Interactive Discussion
c
EGU 2003
Fig. 13. Vertical cross section of potential vorticity (solid lines, every 0.75 pvu, shaded for values between 1.5 and 3.0 pvu) and potential temperature (dashed contour lines, every 4 K) on 19 December 2001 12:00 UTC, over 818 km. The cross section goes from 54.3◦N–18.6◦W to 55.2◦N–29.3◦W along the aircraft path over the Atlantic, it corresponds to the period from 1249 UTC to 13:46 UTC on Fig. 12 (see O3, CO, and H2O time series). The red arrow represents
ACPD
3, 3713–3744, 2003 An improved infrared carbon monoxide analyser P. Nedelec et al. Title Page Abstract Introduction Conclusions References Tables Figures J I J I Back Close Full Screen / EscPrint Version Interactive Discussion
c
EGU 2003
Fig. 14. Vertical profile over Mumbai (India) on 24 February 2002 from 21:18 to 21:49 UTC. Mixing ratio of ozone (ppbv, black solid line), carbon monoxide (ppbv, red square line) and water vapour (g/kg, green line) versus altitude (m).