Characterization of recharge mechanisms in a Precambrian basement aquifer in semi-arid south-west Niger
44
0
0
Texte intégral
(2) 26. piezometric methods were combined to determine changes in recharge rate and origin of. 27. groundwaters for the shallow weathered aquifer and the deep fissured/fractured aquifer. At the. 28. basin scale, the groundwater fluxes towards the Niger River are influenced mainly by. 29. topography, with no visual long-term trend in groundwater levels (1980-2009). The hydro-. 30. geochemical signature is dominated by the calcic-bicarbonate to magnesian (70%) type. It. 31. shows evolution from an open environment with CO2 and low mineralized water (granitoids,. 32. alterites) towards a more confined environment with more mineralized waters (schists). Stable. 33. water isotopes (δ18O, δ2H) analysis suggests two main groundwater recharge mechanisms: (i). 34. direct recharge with nearly no post-rainfall fractionation signature and (ii) indirect recharge. 35. from evaporated surface waters and/or stream-channel beds. Groundwater tritium content. 36. indicates that recharge is mostly recent, with an age less than 50 years (3H > 3 TU), with only. 37. 10% indicating low or even no recharge for the past decades. A median value of the. 38. groundwater renewal rate estimated from individual values of tritium is equivalent to 1.3% y-1,. 39. close to the one determined for groundwater samples dating to the early 1980s, thus indicating. 40. no measurable long-term change.. 41 42. Keywords: Niger, fractured aquifers, hydrochemistry, environmental isotopes, groundwater. 43. recharge.. 44 45 46 47. NOTE TO COPYEDITOR – PLEASE INSERT THE FOLLOWING AS A FIRSTPAGE FOOTNOTE: This article is part of the topical collection “…”.
(3) 48 49 50. 1. Introduction. 51. Since the 1970s, the Sahelian regions of West Africa have experienced climatic variability. 52. marked by recurrent droughts (Nicholson 2001, L'Hôte et al., 2002; Sagna et al., 2015). These. 53. drought periods are remarkable for their duration at the global scale, and characterized by a. 54. reduction of about 20% in precipitation (Taylor et al., 2002; Panthou et al., 2014). In the central. 55. Sahel, this has led to a degradation of soil surface conditions and lasting changes in the water. 56. balance (Leduc et al., 2001; Séguis et al., 2004; Mahé, 2009). The high population growth (of. 57. about 2-3% yr-1) and the estimated extension of cultivated areas (5% in 1960 to 14% in 1990). 58. has been associated to a 28% loss of forest cover (Taylor et al., 2002) and have thus accentuated. 59. the effect of land clearance on soil crusting (Favreau et al., 2009). Hydrological studies have. 60. also shown the sustained indirect impact of these anthropogenic pressures on surface waters.. 61. For example, their effects are reflected in the increase in river flows despite the recurrence of. 62. droughts (Mahé et al., 2003). As a consequence of intense and persistent climate and. 63. environmental disturbances, it is necessary to consider how these changes affect groundwater. 64. (Lapworth et al., 2013, Ibrahim et al., 2014). In Niger, the impact of these changes has been. 65. assessed in unconfined sedimentary aquifers (Leduc et al., 2001, Leblanc et al., 2008). Higher. 66. piezometric levels observed since the mid-1960s are interpreted as the response to. 67. anthropogenic degradations of the vegetation cover, despite the decrease of rainfall (Favreau et. 68. al., 2009, 2012).. 69. In the crystalline basement zone, the long-term dynamics of groundwater resources. 70. remain unknown. Filippi et al.(1990) showed that in the neighboring crystalline basement. 71. region of Burkina Faso, plurimetric groundwater level fluctuations are caused by the seasonality. 72. of rainfall. For a large Sahelian catchment (20,000 km2) in Burkina-Faso, a clear link has been.
(4) 73. established (Mahé, 2009) between the degradation of soil surface characteristics and an increase. 74. in Hortonian surface water flows. In the basement area of northeastern Mali, Gardelle et al.. 75. (2010) observed an increase in pond areas which could have an impact on the dynamics of. 76. underlying aquifers, if focused recharge occurs similarly to observations made in the. 77. sedimentary context of the neighboring Sahelian zones.. 78. Previous research highlights the complexity of hydrogeological studies in semi-arid. 79. zones where the different terms of the hydrological balance are particularly sensitive to small. 80. environmental changes and where the response of the impacted systems can be counter-. 81. intuitive. Despite these difficulties, hydrogeological studies in crystalline basement zones are. 82. of primary importance. The uncertainty on water availability is generally more pronounced,. 83. since groundwater resources are often smaller in volume and discontinuous in space. In the. 84. south-west of Niger, about 40% of the wells drilled in villages have low yield (<0.5m³/h).. 85. Moreover, 55% of the productive wells are abandoned due to chemical problems, as. 86. contaminant concentrations (e.g. nitrate, arsenic, and fluoride) exceed WHO drinking-water. 87. standards (Ousmane et al., 2012). These difficulties of access to drinking water, coupled with. 88. the low mean productivity, explain why the region's population is locally affected by severe. 89. water shortages during the long dry season. In the semi-arid crystalline basement regions, the. 90. main challenge lies in a better hydrogeological characterization in order to better understand. 91. the groundwater dynamics, not only in terms of recharge, but also in terms of groundwater. 92. quality.. 93. Previous studies carried out in the crystalline area of south-west Niger revealed that recharge. 94. occurs following two mechanisms: (i) direct and diffuse recharge in some more permeable. 95. zones of the landscape (e.g. sand dunes) and, (ii) indirect and punctual recharge in topographical. 96. depressions (Ousmane, 1988; Girard et al., 1997; Abdou Babaye, 2012) where water. 97. accumulates during the rainy season. Due to the spatial and temporal variability and the various.
(5) 98. processes associated with the recharge, estimating the rate of renewal of groundwater is usually. 99. challenging in semi-arid areas (De Vries and Simmers, 2002). This complexity is accentuated. 100. by the fact that indirect localized recharge is often the dominant recharge mechanism,. 101. sometimes at low frequencies (Gaultier, 2004; Bajjali, 2008). Quantification of the localized. 102. recharge requires accurate and localized information, which, often over the long term, is. 103. unavailable. To compensate for the low density of observations, a range of techniques is. 104. commonly used to explain the link between the dynamics of the aquifers and climate and. 105. environmental changes (Ngounou Ngatcha et al., 2007, Stadler et al., 2010, Bouragba et al.,. 106. 2011). In arid and semi-arid regions, multiple tracer approaches are preferred to estimate. 107. localized recharge, compared to the regional hydrological water budget method for which. 108. accurate quantification of this type of recharge remains difficult (De Vries and Simmers, 2002,. 109. Scanlon et al., 2006). In complex water-rock-interaction media, isotopes of the water molecule. 110. (18O, 2H, 3H) have proven to be valuable tracers of the subsurface flow (among others: Aggarwal. 111. et al., 2005; Clark 2015; Solder et al., 2016; Cook et al., 2017).. 112. This study applies hydrodynamics data (groundwater levels, surface water levels) and. 113. hydrogeochemical data (major ions, water isotopes) that will be combined to specify, over the. 114. long term, the spatio-temporal dynamics of groundwater fluxes in the semi-arid southwest of. 115. Niger. This will acheive better management of the resource.. 116 117. 2. Case study. 118. 2.1 Geographic and climatic context. 119. The study area is located in the south-western part of Niger, between longitudes 0°30' and 0°50'. 120. East and latitudes 13°45 'and 14°20' North. With an area of 900 km2, the study area occupies. 121. the central part of the Dargol basin, which is a tributary on the right bank of the Niger River. 122. (Figure 1). The climate is Sahelian with a rainy season extending from June through September..
(6) 123. The extreme daily temperature values observed over the period 1999-2008 range from 15° C (6. 124. am) to 43° C (6 pm), with an annual average of 29° C. The relative humidity of the air shows. 125. an annual variation of 18% (March) to 90% (August). The mean annual rainfall at the Tera. 126. rainfall station is 409 mm (1999-2008), while the mean annual evapotranspiration calculated. 127. from the Penman method for the corresponding period is 2,000 mm (i.e. five times the annual. 128. rainfall). 25% of precipitation is from high-intensity events (Panthou et al., 2014) that produce. 129. rapid Hortonian flows (Amani and Nguetora, 2002).. 130. The density and orientation of the drainage network is influenced by the topography, the. 131. lithology and the tectonic structure of the substratum. Taking its source in Burkina Faso, about. 132. 320 m above sea level (m asl), the temporary river Dargol and its main tributary the Tilim flow. 133. on the right bank of the Niger river (elevation 198 m asl at the station of Kakassi), about 90 km. 134. northwest of Niamey (Figure 1). Its flow is linked to rainfall that begins in June and July and. 135. ends three months later with an average flow of 160×106 m3/year (1964-1994). There is also a. 136. chain of temporary pools or artificial water reservoirs, of which only the Téra dam contains. 137. water continuously (available water volume of 7.7×10⁶ m3 at its creation in 1981).. 138. The relief of the area is relatively flat with isolated hills and fixed sand dunes inherited from. 139. more arid periods of the Quaternary. These morphological assemblages are notched by usually. 140. dry valleys (koris) which drain water towards depressions (valleys, ponds) during the rainy. 141. season. Degraded and sparse vegetation (savanna and steppe) occupies the plateaux, whereas. 142. the bottom of the valleys and depressions give way to denser woody vegetation. The rate of. 143. local population growth was about 3.9% per year over the period 2001 to 2012, with more than. 144. 95% of the population living in rainfed agriculture or extensive livestock farming (INS, 2012).. 145. 2.2 Geological and hydrogeological context. 146. The bedrock of the study area is formed by a Precambrian basement composed of rocks of the. 147. metamorphic belt (green rocks including pyroxenites, amphibolites, epidotites, chloritoschists,.
(7) 148. metabasalts, metagabbros, greywacke rocks, tuffs, rhyolitic breccias, micaschists, clayey. 149. schists, quartzitoschists). These rocks show a NNE-SSW orientation. They are separated by. 150. Eburnean granitoid bodies (granites, granodiorites and diorites) (Machens, 1973, Soumaila and. 151. Konaté, 2005) (Figure 1). In some locations, these massifs contain Archean relics (pegmatites,. 152. leptynites) (Machens, 1973, Dupuis et al., 1991). Shallow formations made of alterite (5 to 50. 153. m thick), alluvium and colluvium overlie bedrock formations. At the regional scale, four main. 154. fracture orientations constitute the major structural features (Abdou et al., 1998, Affaton et al.,. 155. 2000, Abdou Babaye, 2012): N20 ° to N50 °; N60 ° to N90 °; N120 ° to N140 ° and N350 ° to. 156. N15 °.. 157. In crystalline and metamorphic schists environments, aquifers are developed in the shallow. 158. weathered levels (alterites and alluvial deposits) and in the fractures/cracks of the deep. 159. basement. These two superimposed aquifers can be considered as connected in some areas. 160. (Dewandel et al., 2006). The weathered aquifer is formed by semi-permeable materials with. 161. high storage capacity. It covers the upper part of the deep aquifer corresponding to the highly. 162. fractured zone due to decompression of the bed-rock with high permeability. The lower part of. 163. the deep aquifer corresponds to the compact bed-rock only affected by fractures of tectonic. 164. origin (faults). This deep fractured aquifer is generally confined, whereas, in some locations, it. 165. is able to drain the upper horizons. Most fractures therefore contribute to aquifer transmissivity. 166. but are considered to have a low storage capacity.. 167. In the study area, the depth to the water table varies according to the topography, the type of. 168. aquifer and season. The shallow weathered layers are located in the valleys (alluvium) and the. 169. plateaux (alterites). The depths to the water table, as observed in traditional wells dug in alluvial. 170. formations, vary from 1 to 10 m. In modern wells, drilled in alterites, the water depth ranges. 171. between 15 and 30 m. Upper parts of the aquifer are very reactive to rainfall fluctuations. 172. (Ousmane, 1988) and can dry up during the dry season leading to recurring problems of water.
(8) 173. shortage. Deep aquifer parts are, in principle, more promising in terms of productivity and. 174. sustainability because of the role played by fractures in the drainage, storage and circulation of. 175. groundwater. As a result, these deep aquifers have been the subject of several village water. 176. drilling programs to cover the water needs of the population in the crystalline area. Analysis of. 177. the data from 140 boreholes (Figure 1) from these programs (1980-2009) allowed for synthesis. 178. of the hydrogeological parameters of the study area. The depths of these boreholes vary from. 179. 36 to 120 m with an average of 60 m and a standard deviation of 20 m. The best water. 180. production flows are generally obtained between 30 and 65 m; 76% of the water is produced in. 181. the first 50 m constituting the upper part of the bedrock (Abdou Babaye, 2012). Beyond this. 182. depth, transmissive zones are rare. In granitic rocks, the depth limit to these transmissive zones. 183. rarely exceeds 50 m, whereas it can reach 60 m (and even slightly deeper) in green rocks. 184. (schists) due to the nature and thickness of their weathering products. Lithological diversity and. 185. the various tectonic phases influence the hydrogeological properties of basement aquifers and,. 186. of course, their productivity. Analysis of the drilling data reveals that water yields are generally. 187. low, ranging from 0.5 m³/h to 5 m³/h, with the majority of boreholes being limited to values. 188. below 2.5 m³/h. In green rocks, higher water yield (mean of 2.7 m³/h versus 1.9 m³/h in. 189. granitoids) are observed. Flow rates greater than 10 m³/h were obtained in boreholes drilled in. 190. fractured networks of shear zones.. 191. Hydraulic conductivity values estimated by short-time (4 h) pumping tests range from 2.4×10-. 192. 7. 193. granitoids and green rocks. Ousmane (1988) showed statistically that green rocks are more. 194. productive with a drilling success rate (flow rate> 0.5 m3/h) of 87% compared to about 60% for. 195. granitoid rocks.. m/s to 3×10⁻⁵m/s with averages of 3×10⁻⁶ m/s and 1.1×10⁻⁵ m/s respectively observed on. 196 197. 3. Methodology.
(9) 198. 3.1 Groundwater level surveys. 199. In the study area, measurements of static groundwater levels date from the drilling operations.. 200. Unfortunately, there is no regular and official monitoring of groundwater levels in rural and. 201. even urban waterworks. The absence of a piezometric network and the low density of. 202. measurement points did not allow drawing a reliable piezometric map. However, measurements. 203. (with a centimeter accuracy) of groundwater levels have been carried out in various topographic. 204. (basin, slope, plateau) and geological (schists, granites, weathered rocks) contexts in both high. 205. and low groundwater-level periods. Groundwater levels were measured, at the beginning of the. 206. day before the pumping activities, at 30 points in May 2009 and 40 points in October–. 207. November 2009 and in April–May 2010. In addition to these seasonal campaigns, monthly. 208. surveys were made from October 2009 through January 2012. Almost all the measurements. 209. were undertaken in wells screened in the bed-rock fractured aquifer. Only six measurements. 210. were made in wells drilled in the superficial layers (alterites and alluvium). All the wells being. 211. in operation, the measurements were made very early in the morning (between 5 and 8 am) in. 212. order to obtain a measurement in conditions close to the static level. This recent dataset has. 213. been completed by about 20 older measurements from the early 1980s to evaluate the long-term. 214. dynamics of the groundwater levels.. 215. 3.2 Groundwater sampling. 216. Forty-five water samples, taken for classical chemical analyses, were taken from shallow wells,. 217. boreholes and surface waters. These samples were taken during periods of high (October–. 218. December 2009) and low (April–May 2010) groundwater levels. The sampling points were. 219. chosen to be representative of the main different geological contexts of the fractured aquifers. 220. in the study area. Nevertheless, for the purpose of comparison, three analyses concerned the. 221. shallow aquifer and a surface water sample was also collected at the Tera dam..
(10) 222. In addition, most of the points sampled during the period of high groundwater level were also. 223. sampled for isotopes analyses. Thus, 22 waterworks (20 boreholes and 2 wells) were sampled. 224. for oxygen-18 / deuterium analyses, and 17 sampled for tritium analyses. 5 of these points are. 225. corresponding to those already sampled in the 1980s (Ousmane, 1988). In addition, a surface. 226. water sample (Tera dam) was taken and analyzed for its water isotope content.. 227. During each sampling survey, physico-chemical parameters (pH, temperature, electrical. 228. conductivity) were measured in situ.. 229. Measurements and sampling were carried out after at least 30 minutes of pumping in order to. 230. obtain groundwater samples more representative of groundwater in the aquifer.. 231. 3.3 Chemical and isotope analyses. 232. Chemical analyses (carried out in the HGE-ULg laboratory) have ionic balance errors varying. 233. around ± 3%. Analyses (Ca2+, Mg2+, Na+, K+, Cl-, NO3-, S042-) were carried out using a Capillary. 234. Ion Analysis (C.I.A.) technique. Silica was determined by a Flame Atomic Absorption. 235. technique while carbonate (CO32-) and bicarbonate (HCO3-) ions were calculated after. 236. determination of pH and the complete alkalimetric title.. 237. Analyses of the oxygen-18 / deuterium pair were carried out by the IDES Laboratory of the. 238. University of Paris-Sud (Orsay, France) and those related to tritium in the HYDROISOTOP. 239. laboratory in Schweitenkirchen, Germany. The results of the analyses are expressed in δ ‰ vs. 240. V-SMOW. The analytical errors are respectively ± 0.2 δ ‰ and ± 2 δ ‰ for oxygen-18 and. 241. deuterium. For tritium (expressed as a tritium unit (TU)), the accuracy is ± 0.5 TU with a. 242. detection limit of 0.9 TU.. 243. Rainfall data were obtained from the International Atomic Energy Agency (IAEA) network. 244. (GNIP, 2011), from Niamey/ORSTOM stations (1992 to 1999) and IRI/Abdou Moumouni. 245. University of Niamey in Niger, located at an almost identical (190 m vs 225 m asl) altitude. 246. (Ousmane, 1988; Girard, 1993, Taupin et al., 2002, Guéro, 2003, Tremoy et al., 2012)..
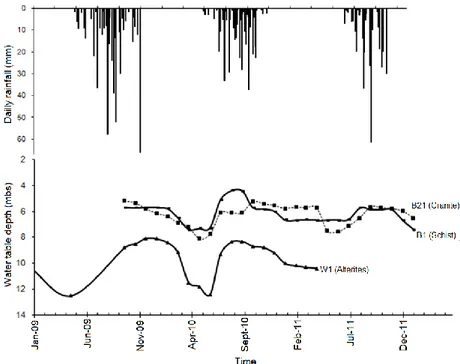
(11) 247 248. 4. Results. 249. 4.1 Hydrodynamics. 250. The monthly monitoring of the static groundwater piezometric levels shows seasonal. 251. fluctuations subsequent to the beginning of the rainy season for all (n = 3) of the wells surveyed,. 252. both in the shallow part of the aquifer in the alterites (shallow wells) and in the deep fractured. 253. aquifer (boreholes). The water table decreases from the end of October to early November,. 254. reaching the lower levels in May (Figure 2). From the first weeks of July, a rapid (alterites) or. 255. progressive (deep fractured aquifer) rise of groundwater levels is observed. Maxima are reached. 256. in August - September or even in October, two to four months after the start of the rainy season.. 257. The amplitude of fluctuations of groundwater levels between periods of high and low. 258. groundwater levels varies from 0.29 m to 13.1 m. The highest amplitudes are observed in the. 259. upper areas (plateau, sand dune).. 260. Due to the low amount of data, it is not possible to draw a map with hydraulic head contours.. 261. However, main flow directions can be derived from the available data (Figure 3).The map of. 262. the main groundwater flow directions in the deep aquifer (Figure 3), drawn for the high. 263. groundwater level periods (October-November 2009), shows a strong influence of the. 264. topography. The directions of the groundwater flows are thus quite similar to that of surface. 265. waters, and influenced by the directions of the major fractures, North-East, South-East and. 266. West-East. Some small piezometric domes are observed in the west, south-west, north and. 267. center corresponding probably to preferential infiltration from pools and artificial reservoirs. 268. (dam). The lowest groundwater levels are observed in the southeastern part of the basin in the. 269. vicinity of the Tilim plain and its confluence with the flood plain of the Dargol River..
(12) 270. Comparison of the groundwater levels from the 1980s to 2009 shows a decrease in about 65%. 271. of the boreholes (13 out of 20 boreholes) (Figure 4); On the other hand, a significant increase. 272. is observed in some boreholes, with no clear spatial pattern observed.. 273. 4.2 Hydrochemistry. 274. The results of the chemical analyses (synthesis in Table 1; full analyses in Table S1 of the. 275. electronic supplementary material (ESM)) reveal that the groundwater is slightly acidic to. 276. neutral and characterized by a variable mineralization (ranging from 266 to 1,184 μS/cm). Dam. 277. water, sampled in high water conditions (18 December 2009) shows a low mineralization (143. 278. μS/cm). The temperature of the water varies from 29 to 34 °C in all the groundwater samples.. 279. The highest values could be overestimated due to surface measurements in periods of high. 280. atmospheric temperatures..
(13) 281 282 283 284. Table1: Synthesis of the results of chemical and isotopic analyses for the high groundwater level period (The complete data are provided in Table S1 of the ESM) Chemical elements (mg/L), electrical conductivity (Cond) in µS/cm, deuterium excess (d), δ18O and δ2H (‰ V-SMOW), TU Tritium Unit Sample type (n) Green rocks (12). Granitoids (13). 285 286. Cond 25°. pH. Ca2+. Mg2+. Na+. K+. Cl-. SO42-. NO3-. CO32-. HCO3-. δ18O. δ2H. d. Min. 385. 6.43. 18.72. 10.51. 19.71. 2.12. 2.67. 3.69. 0.3. 0.93. 146.81 -2.32. -11.6. 4.78. 3H. (TU). <0.9. Max. 1,123.3. 7.3. 128.28. 48.66. 76.97. 7.2. 23.43 294.95. 231.1. 10.54. 390.18 -4.49. -31.1. 8.24. 4.7. Mean. 658.47. 6.86. 54.7. 26.06. 47.1. 4.32. 9.26. 57.27. 51.25. 4.91. 278.71 -3.55. -21.9. 6.52. 3.51. Stand. Dev Min. 255.60. 0.24. 33.81. 12.37. 19.92. 1.86. 7.211. 88.56. 69.29. 2.37. 64.345. 0.87. 6.96. 1.36. 1.41. 350. 6.1. 21.8. 5.51. 13.06. 0.01. 3.5. 2.22. 1.05. 0.94. 100.41 -4.13. -0.09. -0.39. 1.4. Max. 1,184.5. 7.1. 108.1. 26.86. 84.06. 5.17. 45.22. 40.67. 405.8. 7.41. 353.6. -27.6. 9.56. 5.9. 0.9. Mean. 594.65. 6.63. 51.57. 17.69. 49.51. 2.93. 16.77. 19.59. 95.84. 3.36. 228.73 -2.94. -19.2. 4.38. 3.75. 298.98. 0.27. 26.02. 15.39. 21.90. 1.517. 13.3. 12.25. 124.6. 1.93. 80.43. 1.52. 8.24. 4.64. 1.21. Alterites (1). Stand. Dev -. 719. 7.1. 74.78. 27.38. 33.62. 6.26. 42.10. 21.75. 138.24. 3.95. 211.25. 0.19. -3.06. -4.58. -. Dam (1). -. 143.6. 7.79. 21.34. 3.09. 3.51. 3.60. 1.34. 1.29. 3.04. 0.31. 89.56. 0.79. -1.99. -1.2. -.
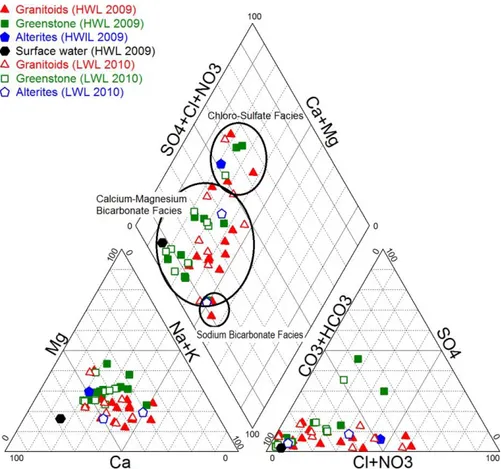
(14) 287. The deep and shallow aquifers show diversified facies (Figure 5). The most represented. 288. groundwater facies is the calcium-magnesium bicarbonate facies (70% of the samples) followed. 289. by the calcium chloro-sulfate (25%) and sodium bicarbonate (5%). The chloro-sulfate calcium. 290. signature reflects the evolution of the anions of the bicarbonate pole towards the chloride-nitrate. 291. pole. This evolution is mainly due to an increase in nitrate, and secondarily by the addition of. 292. sulphates in the evolution towards a third facies. Chloride-nitrate water is interpreted as a. 293. characteristic of a recently recharged aquifer. On the other hand, the evolution of the waters of. 294. the bicarbonate calco-magnesian zone towards the bicarbonate sodium domain could be a sign. 295. of some aging of the waters due to the cation exchange indices between alkaline earths and. 296. alkalies (Diop and Tijani, 2008).. 297. 4.3 Isotopic signal of the local rainfall. 298. The local meteoric waterline (LMWL), based on Niamey's monthly rainfall (Taupin et al.,. 299. 2003), has the following equation (1992-1999, n = 28 and R² =0.97):. 300 301. δ2H = 7.7 δ18O + 5.4. (1). 302 303. The slope of this LMWL (7.7) is lower than that of the World Meteorological Water Line (8).. 304. This characteristic is interpreted in the Sahel as the result of slightly evaporated precipitation. 305. during rainfall, in accordance with the interpretation of the monitoring of isotope concentrations. 306. of atmospheric water vapor in Niamey (Tremoy et al., 2012). The origin of precipitation is. 307. determined from the values of the deuterium excess:. 308. d = δ2H - 8 δ18O. (2). 309. Tritium concentrations in precipitation show a series of peaks following the first nuclear tests. 310. in early 1950’s. Current tritium concentrations are of 5 to 10 TU in the precipitation in the. 311. northern hemisphere (GNIP, 2011). In southwestern Niger, the most recent measurements were.
(15) 312. ~7 TU in 1994 and ~4 TU in 2006 (Favreau et al., 2002; Favreau, pers. Com., IRD France,. 313. 2016).. 314. The weighted average of the measures, the rainy period number by month, collected in Niger. 315. and Burkina Faso between 1998 and 2008 is 5.2 TU (Ousmane, 1988, Favreau et al., 2002,. 316. Guéro, 2003, Yaméogo, 2008). This value represents the isotopic signature of the current rains. 317. and therefore the input function of the hydrological system. Given the half-life of tritium (12.41. 318. years), groundwater infiltrated before the 1950’s (average concentration estimated at 5 TU in. 319. precipitation) would have in 2009 (sampling date) a tritium concentration of 0.2 TU, therefore. 320. lower than the detection threshold.. 321. 4.4 Isotopes in groundwaters. 322. Stable-isotope compositions of 22 groundwater samples, including two samples from wells dug. 323. in alterites, range from -4.5 ‰ to +0.9 ‰ for oxygen-18 and -31 ‰ to -0.1 ‰ for deuterium.. 324. The overall mean values and standard deviations are respectively -3.0 ‰ and 1.5 ‰ for oxygen-. 325. 18 and -19 ‰ and 8.2 ‰ for deuterium. Considering only deep bottom aquifers (17 values),. 326. mean values of -3.6 ‰ and -23 ‰ for oxygen-18 and deuterium respectively are found. δ18O. 327. levels are 36% higher than -3 ‰ while 77% have deuterium values lower than -25 ‰. These. 328. results highlight the influence of different lithologies and the different groundwater pathways. 329. in the area.. 330. The calculated deuterium excess (d) values for groundwater are less than 10 (Table 1). This. 331. shows that the air masses that generated Niger's precipitation and eventually groundwater. 332. recharge originate from the Guinean monsoon, with a marked effect of the re-evaporation of. 333. rainfall (Tremoy et al., 2012).. 334. The isotopic composition of groundwater in arid regions can be considerably modified by. 335. evaporation in comparison to isotopic composition of the local precipitation (Clark and Fritz. 336. 1997, Favreau et al., 2002). However, despite high actual evapotranspiration (AET) values, it.
(16) 337. is possible to have groundwater with isotopic compositions close to the average precipitation. 338. composition, demonstrating rapid recharge flows to aquifers (Acheamponga and Hess, 2000;. 339. Goni, 2006). By plotting the sampled points in the diagram δ2H vs δ18O (Figure 6), it is observed. 340. that all points are organized around the two following linear regression lines:. 341 342. δ 2H = 7.5 δ 18O + 4.5. R2 = 0.83 (Samples from the deep aquifers, n = 17). (3). δ 2H = 4.8 δ 18O – 4. R2 = 0.95 (Samples from the shallow aquifers, n = 5). (4). 343 344 345 346. The 17 points corresponding to the samples taken in the deep aquifers are aligned around line. 347. (3) in Fig 6 (expressed by Equation 3) with a slope of 7.6, very close to the slope of the line. 348. representative of the local precipitation (LMWL). This suggests rapid recharge to the aquifers. 349. without marked evaporation effects as shown in Figures 7, 8 and 9 and confirmed by the. 350. computation of the water renewal rate for these aquifers. Three of these boreholes (circled. 351. points in Fig 6) deviate from the LMWL and are below the evaporation line (4) in Fig 6. 352. (expressed by Equation 4). This deviation from the LMWL could indicate enrichment by the. 353. evaporation process from surface water. The position of these boreholes in the interdunary. 354. basins and in sandy zones, which are favorable sites for the concentration of runoff water, the. 355. infiltration (Aranyossy and Gaye, 1992; Ngounou Ngatcha et al., 2001) and the evaporation. 356. could explain their evaporated intermediate composition. Contrary to the observations made in. 357. the neighboring sedimentary zone (Favreau et al., 2002), the deeper part of the aquifers seem. 358. to be able to hold slightly evaporated waters. Desconnets et al. (1997) show that in the. 359. sedimentary zones of the Sahelian regions, ~80 to 90% of the water accumulated in the ponds. 360. infiltrate and contribute to the rapid recharge of the aquifers. On the other hand, in the basement. 361. area, clayey-sandy alterites have an effect on the infiltration rate due to their low permeability..
(17) 362. Five points are aligned with the straight line (4) in Fig 6, with a slope of 4.8, indicating an. 363. enrichment by evaporation of the surface water that supplies the aquifers by the indirect. 364. recharge processes (Abdalla, 2009). These five points correspond to wells collecting shallow. 365. weathered layers and shallow boreholes screened at the interface between the fractured horizon. 366. and grainy weathered horizon. This evaporation line (4) intersects the LMWL through a point. 367. of coordinates -4.1 ‰ and -23.1 ‰ corresponding to the mean weighted rainfall composition. 368. at the Niamey station. The fact that this point belongs to the evaporation line (2) in Fig 6. 369. indicates that the waters of the shallow aquifers come from the current rains which have. 370. undergone evaporation at the surface or in the first meters of the ground. In semi-arid zones,. 371. partial evaporation of water in the first meters of the soil is the basis of isotopic enrichment. 372. (Edmunds et al., 2002; Stadler et al., 2010).. 373. Tritium activity in the bedrock aquifers shows a wide range of values. The concentrations. 374. ranged from <0.9 (detection limit) to 5.9 TU, with an average of 3.69 ± 1.22 TU. Generally. 375. speaking, 82% of the Liptako basement groundwater samples have tritium levels of ≥ 3 TU, of. 376. which 64% are > 4 TU. This implies that bedrock aquifers contain an important part of the. 377. waters that were infiltrated recently, i.e. over the past 50 years. Nevertheless, there are two older. 378. water samples with low tritium content (<0.9 TU, 1.4 ± 0.6 TU). High nitrate concentration in. 379. this part of the aquifer may be inherited from soil nitrogen sources and subsequent leaching. 380. occurring during high recharge events (Schiewede et al., 2005; Favreau et al., 2009).. 381. Waters with tritium levels close to those of recent precipitation (3 to 4.7 ± 0.7 TU) are found in. 382. both deep and shallow aquifers. These two levels are distinguished according to their oxygen-. 383. 18 contents which are relatively enriched in the more shallow aquifers. These shallow aquifers. 384. can be characterized by an indirect and rapid mode of recharge through the major bed of koris. 385. or laterally by evaporated surface waters..
(18) 386. Thirteen older groundwater samples, within the limits of the Dargol basin and dating back to. 387. the early 1980s (Ousmane, 1988), were also considered for an estimate of long-term changes. 388. in the renewal rates based on tritium data.. 389. The diagram of δ18O vs 3H highlights the presence of three groups of water belonging to. 390. different periods of recharge (Figure 10). Thus, low-tritiated waters (<3 TU) belong to the. 391. deeper parts of aquifers characterized by higher oxygen-18 depletion. This older signal could. 392. correspond to a recharge during the wetter period of the mid-20th century (B12 <0.9 TU). It. 393. may also be interpreted by a slow and diffuse mode of recharge probably induced by rainwater. 394. infiltration through the altered zones.. 395 396. 5. Discussion. 397. 5.1 Hydrochemical evolution of the groundwater. 398. The hydrogeochemical signature of waters can be used to trace water-aquifer matrix exchanges.. 399. An increase in groundwater bicarbonate (and in pH values) results from higher soil CO2 partial. 400. pressure supplied by the infiltration water, assuming there is a closed system in the deeper part. 401. of the aquifer. This trend is consistent with the results (see Fig S1 of the ESM) indicating a. 402. positive correlation between HCO3 and (Na + K)-Cl in contrast to (Ca + Mg)-(HCO3 + SO4). 403. which shows a weaker negative correlation. The latter could be due to the different origins of. 404. the Ca2+ and Mg2+ ions, because the ion exchange reaction supposes the replacement of these. 405. ions by Na+ as a function of aging of the water (see Fig S2 of the ESM). This principle is clearly. 406. proved through the diagram (Na + K) - Cl vs (Ca + Mg) - (HCO3 + SO4) made from the points. 407. sampled in the dry season. The results of Principal Component (PC) analysis using the same. 408. water samples (Abdou Babaye, 2012) show the existence of two main sources of ion production.. 409. The first subgroup (Ca2+, NO3-, Cl-) indicates the influence of anthropogenic activities (septic. 410. tanks, animal excrement around wells) in the mineralization of water, which is partly confirmed.
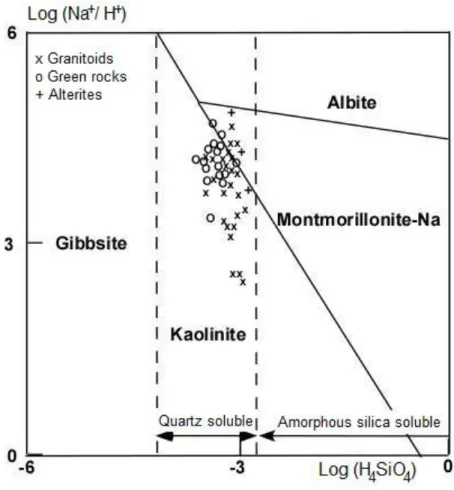
(19) 411. by the presence of NO3- (La Vaissière, 2006 ; Diaw, 2008 ; Yaméogo, 2008). It has been shown. 412. that the Mg2+, Na+, SO42- cluster revealed that these ions would come from a different process. 413. than pollution through the infiltration of recent waters (Abdou Babaye, 2012). The Mg2+ ion in. 414. this group shows that some of the waters with a calco-magnesian bicarbonate facies may be. 415. associated to old waters (Figure 10).. 416. The relationship between Mg2+ and δ18O clearly discriminates waters of the superficial aquifers. 417. from those of the deeper aquifers (Figure 7). This relationship makes it possible to distinguish. 418. deep and confined schist aquifers, from granitic aquifers overlaid by sandy clay weathering. 419. products more permeable than those found above the schist formations. A clear increase in. 420. magnesium content with depth can be observed, except for the boreholes drilled in the granite. 421. basement. This increase, and the oxygen-18 among the most depleted in the groundwater. 422. samples, would then indicate the relationship between the geochemical process of hydrolysis. 423. and the more or less intense water-rock interactions.. 424. The saturation index (SI) of calcite and dolomite (Figure 8) and the equilibrium diagram (Figure. 425. 9) show that the hydrodynamic functioning of these systems is influenced by the lithology of. 426. the reservoirs (granitoids, schists, alterites). Thus, recent waters (group 1 in Fig 8), with a high. 427. value of pCO2 and very negative values of the saturation index (sub-saturation), are found in. 428. the wells and boreholes close to the Dargol flood plain. In contrast, waters with a longer. 429. residence time (group 3 in Fig 8) are found on the plateau, the dunes or in the schist formations. 430. overlaid by a thick weathered layer. For the latter, one can deduce a slower circulation rate of. 431. the waters with relatively depleted contents of heavy isotopes (δ18O <-4 ‰) and tritium (<3. 432. TU). The isotopic signature of these waters proves that the diffuse recharge is low and that the. 433. water resulting from the indirect recharge (from topographic depression) would takes time (≥. 434. 50 years based on the lower tritium values) before reaching this part of the aquifer. Regarding. 435. the geochemical rock-water interaction (Figure 9), waters are in the stability domains of.
(20) 436. kaolinite and montmorillonite. In the equilibrium diagram, this distribution of points is clearly. 437. influenced by the lithological nature, or by the distance to the recharge zone. The samples show. 438. an evolution from an open environment (groundwater in chemical equilibrium with kaolinite),. 439. where groundwaters are less mineralised (granitoid, alterites), towards a confined environment. 440. (groundwater more in equilibrium with montmorillonite) as in green rocks with naturally more. 441. mineralised waters. Groundwaters are becoming ‘older’ when passing from the kaolinite. 442. equilibrium towards the montmorillonite equilibrium showing confined conditions and. 443. probably associated low permeability values. This confinement is mainly related to the thick. 444. clayey-sandy alterite layers found in the schists zones, but also to the low-permeabability filling. 445. of some fractures.. 446. 5.2 Recharge rates and changes in groundwater storage. 447. The annual and interannual fluctuations in groundwater levels and the hydrogeochemical. 448. behavior of the aquifers reveal the complexity of recharge processes in this semi-arid zone. The. 449. litho-tectonic context of the study area accentuates spatial heterogeneity in the hydraulic. 450. properties of aquifers due to the variable nature of the weathering products and the degree of. 451. fracturation of the surrounding rocks. Variations in groundwater levels are greater in boreholes. 452. located at high elevations (plateaux, dunes, rather remote from koris) than in those located in. 453. the immediate vicinity of floodplains of koris or ponds (Ousmane , 1988). In schists or dune. 454. areas, the characteristics of the land surface results in low diffuse infiltration. The large. 455. thickness of the unsaturated zone, the clogging of the ponds and the low infiltration favor the. 456. loss of water by evaporation (Figure 11).. 457. These arguments corroborate those suggested by the hydrogeochemical study discussed above.. 458. Heavy isotope depletion (δ18O <-4 ‰) and lower tritium content (<3 TU) suggest that the. 459. aquifers contain a significant component of older water and that recharge by direct infiltration. 460. of rainfall is low. The hypotheses on the rate of water renewal are verified by using a simple.
(21) 461. analytical model applied in the semi-arid zone (Leduc et al., 2000, Le Gal La Salle et al., 2001,. 462. Favreau et al., 2002) where the water renewal rate is high. This model makes it possible to. 463. calculate not only renewal rates in 2009 but also possible changes since the early 1980s (Table. 464. 2). Thus, the following equation can be used to calculate the average tritium content in an. 465. aquifer in a year i: ln2. Av𝑖 = (1 − Tr𝑖 )Av𝑖−1 𝑒 −( 𝑇 ) + Tr𝑖 Ap𝑖. 466. (5). 467. Where Tr𝑖 is the renewal rate of the water in the aquifer, T the half-live of tritium (12.43 years). 468. and Ap𝑖 the tritium content in precipitation for the year i.. 469. Given the uncertainties associated with the recharge and tritium concentration in the recharge,. 470. and the possible variations in pumping or volume of the aquifer, the only significant variations. 471. between 1980-1981 and the end of 2009 are observed for the wells Sirfikouara (B19) and. 472. Toumbindé B7) with respectively 2 and 3 times the renewal rate. The aquifer remained stable. 473. at wells B20 and B21. The proximity of these wells (B19, B20, B21) to the riverbed of the koris. 474. and especially the permeability of the shallow weathered materials (sands and granitic sand). 475. facilitate the infiltration of water on the one hand, but also the direct hydraulic relationship. 476. between the superficial and deep aquifers on the other hand. This is highlighted on the cross-. 477. section AB (Figures 3 and 12) showing the hydraulic equilibrium between these two. 478. superimposed aquifers, contrary to the phenomenon observed in schists formations (cf. Figure. 479. 11).. 480. In the Yanga area (B12; Figure 11), an apparent decrease in the renewal rate is observed. The. 481. exceptional characteristics of waters sampled in B12 are mainly their high mineralization (>. 482. 1100 μS/cm) but also their tritium content below the detection limit (<0.9 TU). These samples. 483. also belong to the family of waters close to saturation (cf Figure 8) corresponding to confined. 484. aquifers, with slow transit time leading to a low renewal rate or even no renewal during the. 485. years of drought. All these elements suggest that these waters have infiltrated very rapidly in a.
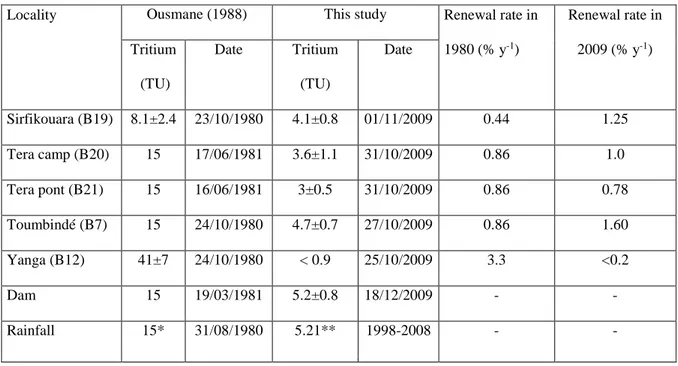
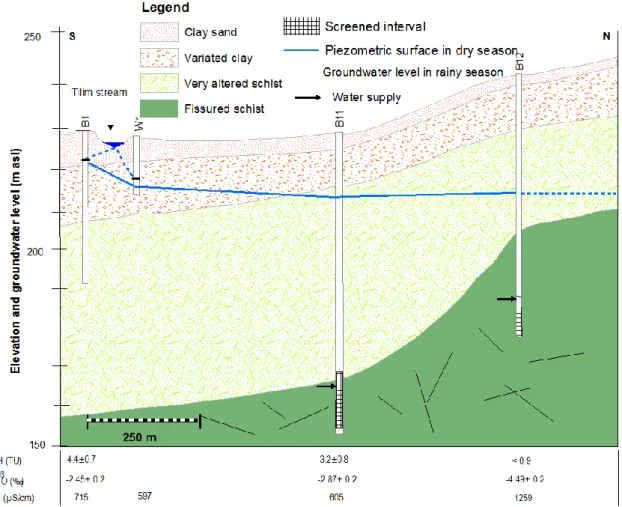
(22) 486. more humid period and at a lower temperature than that of the current climate. This is consistent. 487. with the theory of mixing of water of ancient origin prior to 1954 (Girard et al., 1997), as. 488. suggested by Ousmane (1988) from the activities of 14C.. 489. The results of the model do not show a clear trend in the evolution of the aquifer renewal rate. 490. or in the storage in the aquifer (see Figure 3). Comparison of renewal rates computed on the. 491. long-term is appropriate for groundwaters (Mc Donnell, 2017); the median value of individual. 492. renewal rates of the 1980-1981 data set of groundwater tritium is of 20 % decade-1, an estimate. 493. that can be considered close, considering the high interannual variability in recharge in the. 494. Sahel (Favreau et al., 2009), to the one inferred (13% decade-1) from the groundwater sampling. 495. and analyses performed in 2009, approximately three decades later.. 496 497. Table 2: Comparison of tritium content in boreholes in 1980-1981 (in Ousmane, 1988) and. 498. 2009 (this study). Locality. Ousmane (1988) Tritium. Date. (TU). This study Tritium. Date. Renewal rate in 1980 (% y-1). Renewal rate in 2009 (% y-1). (TU). Sirfikouara (B19). 8.1±2.4. 23/10/1980. 4.1±0.8. 01/11/2009. 0.44. 1.25. Tera camp (B20). 15. 17/06/1981. 3.6±1.1. 31/10/2009. 0.86. 1.0. Tera pont (B21). 15. 16/06/1981. 3±0.5. 31/10/2009. 0.86. 0.78. Toumbindé (B7). 15. 24/10/1980. 4.7±0.7. 27/10/2009. 0.86. 1.60. 41±7. 24/10/1980. < 0.9. 25/10/2009. 3.3. <0.2. Dam. 15. 19/03/1981. 5.2±0.8. 18/12/2009. -. -. Rainfall. 15*. 31/08/1980. 5.21**. 1998-2008. -. -. Yanga (B12). 499 500 501 502. (*)Niamey-Université station, (**) Mean tritium concentration in rainfall (period 1998-2008; Dosso and Niamey stations) and from Burkina Faso (Ouagadougou station).. 503. 5.3 Recharge conceptual model.
(23) 504. Understanding the different recharge processes is an essential step for further assessment of the. 505. hydrodynamic functioning of the aquifers. Studies on the recharge mechanisms in arid and. 506. semi-arid environments in Africa have shown the importance of the drainage network in this. 507. process (Desconnets et al., 1996, Leduc et al., 1996a). Temporary watercourses and endorheic. 508. pools can constitute preferential recharge zones. In basement areas, the concordance between. 509. the hydrographic network and the main tectonic fractures could enable a preferential infiltration. 510. towards the deep basement (Rana, 1998).. 511. The spatial distribution of tritium contents (Figure 3) shows that the groundwater with high. 512. tritium concentrations is located near the koris beds. The tritium content in groundwater also. 513. decreases as the distance of the sampling points to the topographic depressions zones increases.. 514. Two assumptions could be invoked for explaining the presence of older waters in the upper. 515. areas. One could argue that the recharge occurs by direct diffuse percolation of the rain through. 516. the variably saturated zone. Its relative low permeability would explain long travel times. This. 517. is however unlikely the case considering the large thickness over the saturated zone and the dry. 518. conditions favoring evaporation of the infiltrated waters (Favreau et al., 2002). Moreover, some. 519. observations are in contradiction with this hypothesis showing a current isotopic signature. 520. despite the thickness and low permeability of the overlying cover (see Figure 8). In the. 521. basement area, groundwater flow is generally influenced by the density of fractures, but. 522. especially by the deep fractures which constitute the preferential pathways for groundwater.. 523. This leads to the second hypothesis, which states that major fractures are the preferential. 524. pathways for the rapid drainage of recharge waters. Thus, recent waters are found in boreholes. 525. screened in major fractures, while old waters are located in less permeable areas characterized. 526. by secondary fractures (Diop and Tijani, 2008). Ousmane (1988) showed that the isotopic. 527. contents of the Sahelian basement water generally show a significant heterogeneity since each. 528. isolated fracture constitutes a distinct aquifer system recharged locally by vertical infiltration..
(24) 529. In the Kobio basin, located about 100 km south-east of Tera (see Figure 1), Girard et al. (1997). 530. have highlighted the importance of the fracture network in the recharge process, but also the. 531. continuity of the aquifer due to the fracture network density.. 532. The interconnection of fractures and the permeability of filling materials locally determine the. 533. continuity of the aquifer (Ball et al., 2010). However, the boreholes may belong to different. 534. hydraulic systems, isolated by fractures filled by clays acting as a low-permeability barrier. 535. (Ousmane et al., 1983). The low tritium (below the detection limit) and low heavy isotope (δ18O. 536. of -7.4 ‰) content are related to the litho-structural context and to the recharge mechanism of. 537. the upper zones (Girard et al., 1997). These were demonstrated by the results of the present. 538. study through the isotopic heterogeneity accentuated by the hydraulic discontinuity due to the. 539. faults which do not favor the continuity of circulation of water beyond this zone (Ousmane,. 540. 1988, Nkotagu, 1996). The boreholes (B1, B11) located along the NE-SW major fault where. 541. the Tilim River flows show an isotopic homogeneity (18O and 3H); whereas those located on. 542. either side of this fault show different isotopic signatures (see Figure 8, Figure 3). These very. 543. close boreholes capture different fractures, fractures connected to the major fault with recent. 544. waters due to rapid and recharge, and secondary fractures with isolated old waters (Diop and. 545. Tijani, 2008). The non-connection of the latter with the major fractures and the drainage. 546. network give these waters specific isotopic signatures. Thus, these fractures can only receive. 547. water from vertical infiltration with transit times up to 30-60 years under fallow soils in arid. 548. regions (Ibrahim et al., 2014). According to Lapworth et al., (2013), the transit time through. 549. the unsaturated zone can reach 100 years in semi-arid regions. This delay may, however be. 550. shortened by the low thickness of the unsaturated zone or the high conductivity of fractures. 551. (Stadler et al., 2010) leading to a very short transit time.. 552. It should be noted that in basement areas of humid regions, stable-isotope compositions are. 553. relatively homogeneous in fractured aquifers due to the high precipitation and water stock in.
(25) 554. the unsaturated zone (Adiaffi et al., 2009; Lapworth et al., 2013). This zone acts as a buffer to. 555. homogenise by mixing the successive infiltration waters and minimise the chemical. 556. heterogeneity in the saturated zone (Lapworth et al., 2013). The spatial heterogeneity of the. 557. isotopic composition of groundwater in arid and semi-arid regions (Leduc et al., 1997, Le Gal. 558. La Salle et al., 2001) is due to the spatial and temporal variations of the recharge. In addition,. 559. rainfall events from the core of the rainy season (mid-July – mid-September) are known to. 560. usually result in more depleted values in their stable isotopic composition (Ousmane, 1988;. 561. Goni et al., 2001; Taupin et al., 2002, 2003; Favreau et al., 2002; Saravana et al., 2009; Massing. 562. and Tang, 2010). Processes favoring infiltration during those periods could influence the. 563. groundwater isotopic composition.. 564. 5.4 Impact of vegetation cover and climate variability. 565. Several studies carried out in arid zones have demonstrated the influence of climatic variability. 566. and changes in vegetation cover on water resources (Leducet al., 2001, Favreau et al., 2009,. 567. Ibrahim et al., 2014). In Niger, degradation of vegetation cover and increase in growing areas. 568. have resulted in an increase in runoff, despite a decline of about 20% in annual rainfall (Taylor. 569. et al., 2002). Thus, the global runoff coefficient (i.e. ratio between total rainfall and measured. 570. total runoff at a discharge point of the considered basin) calculated on the Dargol at Tera has. 571. increased from 6.2% (before 1972) to 8.4% over the period from 1972 to 1992. Soil crusting. 572. and closure of macropores partly explain the predominance of localized recharge, leading to an. 573. increase in groundwater levels in the immediate vicinity of watercourses in the Continental. 574. Terminal (CT) aquifer (Favreau et al., 2002), ~150 km east of the study area. This process could. 575. explain the large increase in the groundwater level observed in the boreholes (W1 and B9;. 576. Figure 4) localised in topographic depressions. Contrary to the observation made in the. 577. sedimentary areas, basement aquifers generally show a piezometric decline since the early. 578. 1980s (Figure 4). For the Burkina-Faso basement area, Filippi et al. (1990) showed that the.
(26) 579. decrease in rainfall results in a decrease in groundwater levels. The sensitivity of the aquifers. 580. to rainfall fluctuations is due to the rapid mode of recharge through open fractures on the one. 581. hand and to the low capacity of soil aquifers to store a lot of water on the other hand. These. 582. distributions distinguish them from regional sedimentary aquifers, where renewal rates are. 583. usually much lower (< 0.1% a-1 in the CT aquifer in SW Niger; Favreau et al., 2002) that can. 584. more easily mitigate the effect of climate change.. 585. 6. Conclusion. 586. The combined interpretation of groundwater level and hydrogeochemical data provided. 587. new insights into the hydrodynamic functioning and recharge processes of the fissured and. 588. weathered aquifers of southwestern Niger. The shallow aquifers of alterites are unconfined,. 589. whereas those of the fissured and / or fractured basement are often confined. The degree of. 590. confinement of these layers depends on the covering materials that are genetically related by. 591. weathering to the type of bed-rock. Thus, the permeability of the alteration products of the. 592. granitic rocks allows a good interaction (and therefore without confinement) between the. 593. superficial and deep aquifers. On the other hand, the less permeable clayey alteration above the. 594. schist aquifers creates confined conditions in these aquifers. The chemical and isotopic data. 595. have provided useful information to trace the path followed by infiltration water and their. 596. residence time in aquifers. Thus, the origin and the recharge processes, and the transit time of. 597. the waters have been specified. The main conclusions drawn from this study can be summarized. 598. as follows:. 599. . The distribution of isotopic contents in groundwater shows spatial variations accentuated. 600. by the hydraulic discontinuity due to fractures. These variations confirm a relative. 601. independence of each fracture in the groundwater circulation.. 602 603. . The recharge of the aquifers follows two distinct mechanisms: a direct recharge from the precipitation that does not undergo significant evaporation for the majority of the boreholes,.
(27) 604. and an indirect recharge from highly evaporated surface water found in the wells getting. 605. water from the alterite or shallow aquifers;. 606. . Tritium contents confirm an important component of recent waters, which, given the depth. 607. of the screen depths (20 to 120 m), implies rapid infiltration through fractures or major. 608. faults superimposed on the surface drainage network. In the groundwater sector where. 609. tritium concentrations are < 3 TU, the renewal rate may be lower. The evolution of. 610. radioactive decay in the waters of the boreholes sampled at the beginning of the 1980s. 611. provides further details on the role of diffuse infiltration in the recharge of the waters but. 612. also on the mixing process and changes in the renewal rate, and recharge on a pluri-. 613. decennial scale.. 614. . The water-rock interaction, through the saturation index and the equilibrium diagrams of. 615. the minerals, allowed to estimate the approximate age of the water and to distinguish the. 616. parts of the aquifers where the recharge is weak.. 617 618. This study proves that the aquifer system is well connected to the land surface through the. 619. fracture system. In addition to the low hydraulic conductivity and storativity of these aquifers,. 620. this means that the aquifers are very sensitive both to drought and pollution. A long drought. 621. resulting from climate change could result in dramatic decline in water level and well drying.. 622. The potential impact of agricultural and industrial development on groundwater quality is also. 623. immediate and huge. As a result, protection against contamination remains a major challenge.. 624. Taking into account these two problems is thus of primary importance for the management of. 625. these groundwater resources.. 626 627. Acknowledgments.
(28) 628. This study was funded by the Belgian Technical Cooperation (BTC), the University of Liège. 629. (ULg) and by The International Foundation for Science (IFS grant, 2008). Some technical. 630. support was also provided by the AMMA-Catch team at IRD in Niger. This would not have. 631. happened without the logistical help of AbdouMoumouni University (UAM) and we express. 632. our deep gratitude to them.. 633 634. References. 635. Abdalla O. A. E. (2009) Groundwater recharge/discharge in semi-arid regions interpreted from. 636. isotope and chloride concentrations in north White Nile Rift, Sudan. Hydrogeol. J., 17,. 637. 679–692. DOI 10.1007/s10040-008-0388-9.. 638. Abdou A., Bonnot H., Bory K. D., Chalamet D., St Martin M., Younfa I. (1998) Notice. 639. explicative des cartesgéologiques du Liptako à 1/100 000 et 1/200 000.[Explanatory note. 640. of the geological maps of the Liptako region at scales of 1/100,000 and 1/200,000].. 641. Ministry of Mines and Energy, Niger Republic, 64 p.. 642. Abdou Babaye M. S. (2012) Evaluation des ressources en eau souterraine dans le bassin de. 643. Dargol (Liptako – Niger). [Groundwater resources estimates in the River Dargol basin. 644. (Liptako, Niger)]. PhD Thesis Univ. Liège, 235p.. 645 646. Acheamponga S.Y., Hess J.W. (2000) Origin of the shallow groundwater system in the southern Voltaian Sedimentary Basin of Ghana: an isotopic approach. J. Hydrol., 233, 37-53.. 647. Adiaffi A., Marlin C., Oga Y.M.S., Massault M., Noret A., Biemi J. (2009) Palaeoclimatic and. 648. deforestation effect on the coastal fresh groundwater resources of SE Ivory Coast from. 649. isotopic and chemical evidence. J. Hydrol., 369, 130 –141.. 650. Affaton P., Gaviglio P., Pharisat A. (2000) Réactivation du craton ouest-africain au Panafricain. 651. : paléocontraintes déduites de la fracturation des grès néoprotérozoïques de KareyGorou. 652. (Niger, Afrique de l’Ouest). [Reactivation of the West-African craton during the Panafrican.
(29) 653. tectonic cycle: evidence of paleostresses recorded by brittle deformation in the. 654. Neoproterozoic sandstones of KareyGorou (Niger, West Africa)].C. R. Acad. Sci. Paris,. 655. Sciences de la Terre et des planètes, 331, 609–614.. 656 657. Aggarwal, P. K., Gat J. R. and K. F. O Froehlich (eds) (2005) Isotopes in the water cycle: past, present and future of a developing science. IAEA, Dordrecht NL: Springer.. 658. Amani A., Nguetora M. (2002) Evidence d’une modification du régime hydrologique du fleuve. 659. Niger à Niamey. [Evidence of a change in the hydrological regime of the River Niger in. 660. Niamey]. IAHS Publ. 274; 449-456. 661. Aranyossy J. F., Gaye C. B. (1992) Use of the tritium thermonuclear peak in the deep. 662. unsaturated zone for quantitative estimate of aquifer recharge under semiarid conditions –. 663. First application in the Sahel. C.R. Acad. Sci. Paris 315 (ser II) : 637-643. 664. Bajjali W. (2008) Evaluation of groundwater in a three-aquifer system in Ramtha area, Jordan:. 665. recharge mechanisms, hydraulic relationship and geochemical evolution. Hydrogeol. J. 16,. 666. 1193–1205.. 667. Ball L. B., GE S., Caine J. S., Revil A., Jardani A. (2010) Constraining fault-zone hydrogeology. 668. through integrated hydrological and geoelectrical analysis. Hydrogeol. J., 1057–1067.. 669. Bouragba L., J.Mudry J., Bouchaou L., Hsissou Y., Krimissa M., Tagma T., Michelot J. L.. 670. (2011) Isotopes and groundwater management strategies under semi-arid area: Case of the. 671. Souss upstream basin (Morocco). Applied Radiation and Isotopes 69 (2011) 1084–1093.. 672. Carrillo-Rivera J. Joel, Clark I. D., Fritz Peter (1992) Investigating recharge of shallow and. 673. paléo-groundwaters in the villa de Reyes basin, SLP, Mexico, with environmental isotopes.. 674. Applied Hydrogeology 4, 35-48.. 675 676. Clark, I. D. (2015) Groundwater geochemistry and isotopes. Boca Raton: CRC Press Taylor & Francis Group..
(30) 677. Cook, P., Dogramaci, S., McCallum, J. and J. Hedley (2017) Groundwater age, mixing and. 678. flow rates in the vicinity of large open pit mines, Pilbara region, northwestern Australia.. 679. Hydrogeol. J. 25, 39-53.. 680. Dakoure D. (2003) Etude hydrogéologique et géochimique de la bordure sud-est du bassin. 681. sédimentaire de Taoudeni (Burkina Faso - Mali) - essai de modélisation [Hydrogeological. 682. and geochemicalstudy of the southeastern part of the Taoudenisedimentary basin (Burkina. 683. Faso - Mali) – first modelingattempt]. PhD thesis, ,Univ. Paris VI - Pierre et Marie Curie,. 684. 223p.. 685. De La Vaissière R. (2006) Etude de l'aquifère néogène du Bas-Dauphiné. Apports de la. 686. géochimie et des isotopes dans le fonctionnement hydrogéologique du bassin de Valence. 687. (Drôme, Sud-Est de la France) [Study of the Neogene aquifer of the lower Dauphiné region.. 688. Contribution of geochemistry and isotopes approaches in the hydrogeological functioning. 689. of the Valence basin (Drôme, southeastern France)]. PhD thesis, University of Avignon. 690. and the Vaucluse region, 339p.. 691 692. De Vries J. J., Simmers I. (2002) Groundwater Recharge: an overview of processes and challenges. Hydrogeol. J., 1, 5-17.. 693. Desconnets J. C., Taupin J. D., Lebel T, Leduc C. (1997) Hydrology of the Hapex-Sahel Central. 694. super-site: surface water drainage and aquifer recharge through the pool systems. J. Hydrol.. 695. 188:155–178.. 696. Dewandel B., Lachassagne P., Wyns R., Maréchal J. C., Krishnamurthy N. S. (2006) A. 697. generalized 3-D geological and hydrogeological conceptual model of granite aquifers. 698. controlled by single or multiphase weathering. J. Hydrol. 330, 260-284.. 699. Diaw M. (2008) Approche hydrochimique et isotopique de la relation eau de surface/nappe et. 700. du mode de recharge de la nappe alluviale dans l’estuaire et la basse vallée du fleuve. 701. Sénégal : Identification des zones inondées par Télédétection et par traçage isotopique..
(31) 702. [Hydrodynamics and isotopic approaches of the relationships between surface and. 703. groundwaters and of the recharge processes of the alluvial aquifer in the downstream part. 704. of the Senegal River: identifying flooded areas by remote sensing and isotopic tracers] PhD. 705. thesis, Univ. C.A. Dakar, 178p.. 706 707. Diop S, Tijani M. N. (2008) Assessing the basement aquifers of Eastern Senegal. Hydrogeol. J. 16:1349–1369, DOI 10.1007/s10040-008-0353-7. 708. Dupuis D., Pons J., Prost A.E. (1991) Mise en place de plutons et caractérisation de la. 709. déformation birimienne au Niger occidental. [Plutonic emplacement and Birimian. 710. deformation in western Niger]. C.R. Acad. Sci. Paris, 312 (II), 769 – 776.. 711. Edmunds W.M., E. Fellman, I.B. Goni et C. Prudhomme (2002) Spatial and temporal. 712. distribution of groundwater recharge in northern Nigéria. Hydrogeol. J., 10, 205-215.. 713. Favreau, G., B. Cappelaere, S. Massuel, M. Leblanc, M. Boucher, N. Boulain, and C. Leduc. 714. (2009) Land clearing, climate variability, and water resources increase in semiarid. 715. southwest. 716. DOI:10.1029/2007WR006785.. 717 718. Niger:. A. review,. Water. Resour.. Res.,. 45,. W00A16,. Favreau G., Leduc C., Marlin C., Guero A. (2002) A rising piezometric depression in the Sahel (southwestern Niger). C. R. Geoscience 334, 395–401.. 719. Favreau G., Nazoumou Y., Leblanc M, Guéro A., Goni I. B. (2012) Groundwater ressources. 720. increase in the Iullemmeden Basin, West Africa. IAH – Inter. Contri. To Hydrogeo., 27,. 721. 113-128.. 722. Filippi, C., Milville, F., Thiery, D., (1990) Evaluation of natural recharge to aquifers in the. 723. Sudan-Sahel climate using global hydrological modelling: application to ten sites in. 724. Burkina Faso. Hydrol. Sci. J., 35, 29-48..
(32) 725. Gardelle J., Hiernaux P., Kergoat L., Grippa M. (2010) Less rain, more water in ponds: a remote. 726. sensing study of the dynamics of surface waters from 1950 to present in pastoral Sahel. 727. (Gourma region, Mali). Hydrol. EarthSyst. Sci., 14, 309–324.. 728. Gaultier, G. (2004) Recharge et paléorecharged’une nappe libreen milieu sahélien (Niger. 729. Oriental) : approchesgéochimique et hydrodynamique.[Recharge and paleorecharge of a. 730. superficial aquifer in the Sahel(southeast Niger): geochemistry and hydrodynamic. 731. approaches]. PhD thesis, Univ. Paris Sud, 179p.. 732. Girard P. (1993) Techniques isotopiques (15N,. 18. O) appliquées à l'étude des nappes des. 733. altérites et du socle fracturé de l'ouest africain. Étude de cas: l'Ouest du Niger. [Isotopic. 734. techniques (15N, 18O) applied for groundwater in alterites and hard rock aquifers of West. 735. Africa. Case study: West Niger] PhD thesis, Univ. Québec à Montréal, 141p.. 736 737 738 739 740 741 742 743. Girard P., Hillaire-Marcel C., Oga M.S. (1997) Determining the recharge mode of Sahelian aquifers using water isotopes. Journal of Hydrology, n° 197, 189–202. GNIP. (2011). Global. Network. of. Isotopes. in. Precipitation.. http://www-. naweb.iaea.org/napc/ih/IHS_resources_isohis.html, last access January 2018 Goni I. B. (2006) Tracing stable isotope values from meteoric water to groundwater in the southwestern part of the Chad basin. Hydrogeol. J. 14: 742–752. Goni I.B, Fellman, Edmunds W.M (2001) Rainfall geochemistry in the Sahel region of northern Nigeria. Atmospheric Environment, 35, 4331-4339.. 744. Guéro A. (2003) Étude des relations hydrauliques entre les différentes nappes du. 745. complexesédimentaire de la bordure sud-ouest du bassin des Iullemmeden (Niger) :. 746. approchesgéochimique et hydrodynamique [Study of hydraulic relationships between the. 747. different aquifers of the sedimentary complex of the southwestern border of the. 748. Iullemmeden basin (Niger): hydrodynamics and geochemical approches]. PhD Thesis,. 749. Univ. Paris XI Orsay, 265 p..
(33) 750. Ibrahim M., Favreau G., Scanlon B. R., Seidel I. C., Le Coz M., Demarty J., Cappelaere B.. 751. (2014) Long-term increase in diffuse groundwater recharge following expansion of rainfed. 752. cultivation in the Sahel, West Africa. Hydrogeol. J., DOI 10.1007/s10040-014-1143-z. 753. INS (2012) Présentation des résultatspréliminaires du quatrièmerecensementgénéral de la. 754. population et de l’habitat (RGP/H) [Presentation of the preliminary results of the 4th general. 755. census of the population and living conditions (RGP/H)]. Niger Republic, 9p.. 756. Lapworth D.J., MacDonald A. M., Tijani M. N., Darling W. G., Gooddy D. C., Bonsor H. C.,. 757. L. J. Araguás-Araguás L. J. (2012) Residence times of shallow groundwater in West. 758. Africa: implications for hydrogeology and resilience to future changes in climate.. 759. Hydrogeol. J. 21: 673–686, DOI 10.1007/s10040-012-0925-4.. 760. Leblanc M., Favreau G., Massuel S., Tweed S., Loireau M., Cappelaere B. (2008) Land. 761. clearance and hydrological change in the Sahel: SW Niger. Global and Planetary Change. 762. GLOBAL-01298. 763. Leblanc M., Tweed S., Van Dijk A., Timbal B. (2012) A review of historic and future. 764. hydrological changes in the Murray-Darling Basin. Global and Planetary Change 80–81,. 765. 226–246. 766 767. Leduc C, Favreau G, Schroeter P. (2001) Long-term rise in a Sahelian water-table: the continental terminal in south-west Niger. J. Hydrol 243: 43–54.. 768. Leduc C., Sabljak S., Taupin J-D., Marlin C., Favreau G. (2000) Estimation de la recharge de. 769. la nappe quaternaire dans le Nord-Ouest du bassin du lac Tchad (Niger oriental) à partir de. 770. mesures isotopiques. [Recharge of the Quaternary water table in the northwestern Lake. 771. Chad basin (southeastern Niger) estimated from isotopes]. C.R. Acad. Sci. Paris, n° 330,. 772. 355–361.. 773. Leduc C., Taupin J-D., Le Gal La Salle C. (1996) Estimation de la recharge de la nappe. 774. phréatique du Continental Terminal (Niamey, Niger) à partir des teneurs en tritium..
(34) 775. [Recharge of the Continental Terminal water-table (Niamey, Niger) estimated from tritium. 776. measurements and modelling]. C.R. Acad. Sci. Paris, t. 323, série II a, 599-605.. 777. Le Gal La Salle C., Marlin C., Leduc C., Massault M., Favreau G. (2001) Renewal rate. 778. estimation of groundwater based on radioactive tracers (3H et 14C) in an unconfined aquifer. 779. an a semi-arid area, Iullemede Basin, Niger. J. Hydrol., 254, 145– 156.. 780 781. L’Hôte Y., Mahé G., Some B., Triboulet J. P. (2002) Analysis of a Sahelian annual rainfall index from 1896 to 2000; the drought continues. Hydrological Science, 47, 56 –572.. 782. Machens E. (1973) Contribution à l’étude des formations du socle cristallin et de la couverture. 783. sédiementaire de l’Ouest de la République du Niger. Mémo. (Contribution to the study of. 784. the formations of the crystalline basement and the sedimentary cover of the West of the. 785. Republic of Niger. Memo.) BRGM, n°82, 167p. 786 787. Mahé G. (2009) Surface/groundwater interactions in the Bani and Nakambe rivers, tributaries of the Niger and Volta basins, West Africa. Hydrol.Sci., 54(4), 704-712.. 788. Mahé G., Leduc C., Amani, A., Paturel J.E., Girard S., Servat E., Dezetter A. (2003).. 789. Augmentation récente du ruissellement de surface en région soudano-sahélienne et impact. 790. sur les ressources en eau [Recent increase in runoff in the Sudano-Sahelian region and its. 791. impact on water resources]. In: Hydrology of Mediterranean and Semiarid Regions. IAHS. 792. Pub. 278, 215-222.. 793. Massing O., Tang Z. (2010) Recharge of the Quaternary Aquifer of Lake Chad Basin. 794. Estimated from Oxygen-18 (18O) and Tritium (3H) Isotopes. Journal of American Science,. 795. 6 (9), 283-292.. 796 797. McDonnell. J.. (2017). Beyond. the. water. balance.. Nat.. Geosci.. Vol.. 10.. www.nature.com/naturegeoscience. Accessed 2017. 798. NgounouNgatcha B., Mudry J., Wakponou A., Ekodeck G.E., Njitchoua R., Sarrot-Reynaul. 799. J. (2001) Le cordon sableux Limani-Yagoua, extrême-nord Cameroun, et son.
(35) 800. rôlehydraulique (The Limani-Yagoua sandy belt, far north Cameroon, and its hydraulic. 801. role.). Journal of African Earth Sciences, 32(4), 889-898.. 802 803 804 805. Nicholson S.E. (2001) Climatic and environmental change in Africa during the last two centuries. Clim Res, 17, 123–144. Nkotagu (1996) Origins of high nitrate in groundwater in Tanzania. Journal of African Earth Sciences. 21(4),. 471-478.. 806. Ousmane B. (1988) Étude géochimique et isotopique des aquifères du socle de la bande. 807. sahélienne du Niger (Liptako, Sud-Maradi, Zinder-Est). [Geochemical and isotopic study. 808. of the basement aquifers of the Sahelian belt of Niger (Liptako, South Maradi, East Zinder].. 809. PhD thesis, Univ. Niamey, 175p.. 810. Ousmane, B., Fontes J. C., Aranyossy J. F., Joseph A. (1983) Hydrologie isotopique et. 811. hydrochimie des aquifères discontinus de la bande sahélienne et de l'Aïr (Niger)' [Isotope. 812. hydrology of the discontinuous aquifers of the Sahelian belt and the Aïr (Niger)]. In:. 813. Isotope hydrology, 1983, IAEA Vienna, 367-395.. 814. Ousmane B., Galadima S., Moumouni A., Soumana I. (2012) La qualité physico-chimique. 815. des eaux des aquifères discontinus du socle du Département de Téra (Liptako, Niger) :. 816. impacts sur les taux de desserte en eau potable des populations rurales au sahel. [Physico-. 817. chemical quality of water in basement discontinuous aquifers of the department of Tera. 818. (Liptako, Niger): impacts on the drinkable water supply rates in Sahel rural areas]. Africa. 819. Geosci. Review, 19(1), 1-16. 820. Panthou G., Vischel T., Lebel T. (2014) Recent trends in the regime of extreme rainfall in the. 821. Central Sahel. Short Communication. Int. J. Climatol. 34: 3998–4006. DOI:. 822. 10.1002/joc.3984.
(36) 823. Rana S. S. (1998) Application of Directional Filtering in Lineament Mapping for Groundwater. 824. Prospecting Around Bhinmal – A Semi Arid Part of Thar Desert. Jour. Indian Society of. 825. Remote Sensing, 26 (1-2), 35-44.. 826. Sagna P., Ndiaye O., Diop C., Niang A. D., Sambou P. C. (2015) Les variations récentes du. 827. climat constatées au Sénégal sont-elles en phase avec les descriptions données par les. 828. scénarios du GIEC ? [Are recent climate variations observed in Senegal in conformity with. 829. the descriptions given by the IPCC scenarios?] Pollution atmosphérique, 227, 1-17.. 830. Saravana K. U., Suman S., Navada S.V., Deodhar A.S. (2009) Environmental isotopes. 831. investigation on recharge processes and hydrodynamics of the coastal sedimentary aquifers. 832. of Tiruvadanai, Tamilnadu State, India. J. Hydrol, 364, 23– 39.. 833. Scanlon B. R., Keese K. E., Flint A. L., Flint L. E., Gaye C. B., Edmunds W. M., Simmers I.. 834. (2006) Global synthesis of groundwater recharge in semiarid and arid regions.. 835. Hydrol.Process. 20, 3335–3370.. 836. Schiewede M., Duijnisveld W. H. M., Böttcher J. (2005) Investigation of processes leading to. 837. nitrate enrichment in soils in the Kalahari Region, Botswana. Physics and Chemistry of the. 838. Earth 30, 712-716.. 839. Séguis, L., B. Cappelaere, G. Milesi, C. Peugeot, S. Massuel, and G. Favreau (2004). 840. Simulated impacts of climate change and land-clearing on runoff from a small Sahelian. 841. catchment, Hydrol. Processes, 18, 3401–3413, doi:10.1002/hyp.1503.. 842. Solder, J. E., Stolp, B. J., Heiweil, V. M. and D. D. Susong (2016) Characterization of mean. 843. transit time at large springs in the Upper Colorado River Basin, USA: a tool for assessing. 844. groundwater discharge vulnerability. Hydrogeology Journal 24, 2017-2033.. 845. Soumaila A., Konate M. (2005) Caractérisation de la déformation dans la ceinture birimienne. 846. (paléoprotérozoïque) de Diagorou-Darbani (Liptako nigérien, Afrique de l'Ouest).
Figure

+5


Documents relatifs
The cycle time of the reorientation mechanism is a combination of time delays set to (1) allow the pneumatic valves fully actuate and (2) allow the pins to fully
Refining the high-fidelity archaeointensity curve for western Europe over the past millennium: analysis of Tuscan architectural bricks (Italy)... Refining the high-fidelity
Using the principal lithologic name from the core description to assign five lithologies (sand, silt, clay, calcareous clay, and volcanic ash; see Lithostratigraphy ),
LES REPRESENTATIONS ICONOGRAPHIQUES DE SOCRATE Socrate, donc, n’était plus parmi les hommes ; mais les Athéniens se repentirent aussitôt, au point de fermer palestres et gymnases.
We have presented a novel DOCM system and have obtained images and motion measurements of structures within the or- gan of Corti of a mammalian cochlea in vitro.. We believe the
Construction of 1D and 2D Copper(I) Coordination Polymers Assembled by PhS(CH2)nSPh (n = 1,2) Dithioether Ligands: Surprising Effect of the Spacer Length on the Dimensionality,
As detailed in Section 3, the methodological approach involves three steps: (i) quality-control and selection of suitable flow records available from 72 gauging stations along the
Unsaturated zone experiments are carried out at selected field sites in the Kingdom of Saudi Arabia, representing different potential groundwater recharge scenarios in arid
