HAL Id: in2p3-00664211
http://hal.in2p3.fr/in2p3-00664211
Submitted on 30 Jan 2012
HAL is a multi-disciplinary open access
archive for the deposit and dissemination of
sci-entific research documents, whether they are
pub-lished or not. The documents may come from
teaching and research institutions in France or
abroad, or from public or private research centers.
L’archive ouverte pluridisciplinaire HAL, est
destinée au dépôt et à la diffusion de documents
scientifiques de niveau recherche, publiés ou non,
émanant des établissements d’enseignement et de
recherche français ou étrangers, des laboratoires
publics ou privés.
Beam Foil Interaction Studies for the Future Stripper of
GANIL
E. Baron, C. Ricaud
To cite this version:
E. Baron, C. Ricaud. Beam Foil Interaction Studies for the Future Stripper of GANIL. EPAC 88 - First
European Particle Accelerator Conference, Jun 1988, Rome, Italy. pp.839-841, 1988. �in2p3-00664211�
839
BEAM FOIL INTERACTION STUDIES FOR THE FUTURE STRIPPER OF GANIL -- E. Baron and Ch. Hicaud
GANIL - R.P. 5027 - 14021 Caen Cedex - FRANCE
Summary
The GANIL 3 - cyclotron accelerator complex is to
be upgraded L~I 1989 by increasing the beam energy at the stripper. In view of this modification, -he effect of carbon stripper foils of varicus thicknesses (from 50 to 250 i.lg,'cmii on the ener&?,y spread oi‘ AI-, Kr, Xe and Ta beams was measured using the aralysing section 3f the 270" spectrometer. Energies ranging from 3.2 to 6.5 XeV/A (i.e. corresponding to the future energy range) were ,~sed, and intensities of several hundreds of electrical nanoamperes 'were concentrated over a few mm z spot.
Unusually large values of the additional energy
scread are reported. In addition, charge state distributions of the 6.45 MeV/A Xe and 4.el iYeV/A Ta
beams were measured as a function of the carbon thickness, in order to be able to choose how close to the equilibrium thickness the stripper should be, while keeping the enera spread of the outgoing beams ulthin reasonable l;mits.
1) Introduction
The energy spread SW generated by the carbon stripper foils on the GANIL heavy ion beams may, if tco large, lead to particle losses in the third stage of acceleration SSC2. Measurements performed with the
11)
MP tandem at Strasbowg , and a compilation of experirental values available at the beginning of the GANIL operation had led to the semi-empirical for-nula for the carbon foils :
$,'(MeV/A)
(z/AIP (Z/A)t.x(pqicm
?i
V
(1)
where r;W is the HWHM value, x the foil thickness, Z and A the atomic and mass numbers, the indices p and t respectively referring to proJectile and target. However, since then, the day-to day operation ?f the accelerator revealed 6W values higher r;han expected thrwJgh (1). In addition, the machine modification to be undertaken at the end of 1988 in view of lncreaslng
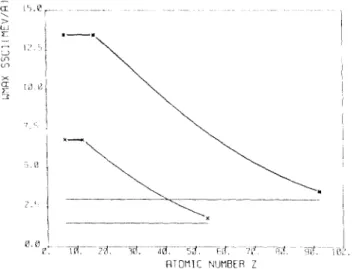
the energy of the"medi.x heavy"-to-"very heavy" IO" beans (J'~.A.E'~ project '*)) is based on energies at the stripper much higher than the present ones (figure 1) and therefore, thicker targets will be required to reach equilibrium for the charge state dlstrjbutions ; scarce values collected in different laboratories indicate that WC should expect up to 300 (or even 500 pgjcn2) eqJrllbrium thicknesses, to be compared t3 the present ROug/cm ' value. Figure 1 also shows that ion species above xenon will be accelerated ar.d stripped at energies whex p3or data exist on charge state dlstributlons P(Q) as a function of carbon thickness. We therefore had to refine our knowledge on these two parameters : 6W and ?iQ).
Moreover, the energy ioss AW caused by these thicker
foils can no longer be compensated by a polarisation
of the strIpper, end this has to be taken into account in ‘-he design of the SSC:' injectiorl system ; a precise knowledge of the rrqil i red range ~1‘ thickness 1s
r. e c e .5 5 a r v
In ';iew of ttils, we carried out. a series of mrnsurementc (:l' si W versuc carbon thlcknes!; with 3.74 McV/A Ar, i.'>3 MeV!& Kr, 6.48 MeVjA Xe and 4.81 MeV/A TR beams ; :.tI(~ charp,e state distrlbutlons were
me:isurrd only wi th the Xc anti Ta beams.
c”.I1 ’
13: ix. -- ?A:- Pf.
-Aa. -- mSS. -~ f iC !:‘- -,c jlL_. t i 0.’ I IATOMIC NUMBFR ZFigure 1. GANIL energy range at the stripper : present (Xi and future (*)
2) Experimental method 2.1. Apparatus
We used the 135" analysing section of the high energy monochronator following xx2 ; IO" beams accelerated by SSCI were directed to the objet focal point where the width Ox, was measured either by movable slits, or by a beam profile monitor- ; the dimension Sxi at the image point was similary measured by a beam profile monitor (total width : 47 mm ;
distance between wres : 1 mm).
The relative er.ergy spread (HWHM) is then calculated by :
fil)))qq ; t2.10-3
'd Y,jxz - PAX”
1 0 where C analyserd (l.596the disoersion coefficient of the m~iToo 1 momentumwise), and the energy spread of the unstripped beam is substracted by
quadratic difference. The charge state distributions were measured using merely two Faraday cups located at the SSCl output and at the image point of the analyser, each measurement on one cup being followed immediately by the corresponding one on the other ciip for monitoring.
The target thicknesses were measured by energy difference,
tables 13) ,
using the newly-calculated stopping power with a 2 to :i p&;/cm' accuracy.
2.2. Targets
Two possible reasons for 6 W valces larger than could be predicted were considered :
- foils could be inhomogenous from the start ; we therefore tried strippers from five different origins: three laboratories (JSN Grenoble, CRN Strasbourg and Facult6 dw Sciences Nantes) and two commercial firms (') ;
- inhomogeneltl could develop during the modification of the carbon structure under bombardment by intense heavy ion beams : to check for this, one test (with tantalum) was carried out using first a reduced intensity and then the full beam (factor 10 to 15).
3) -.. Results
3.1. Energy spread
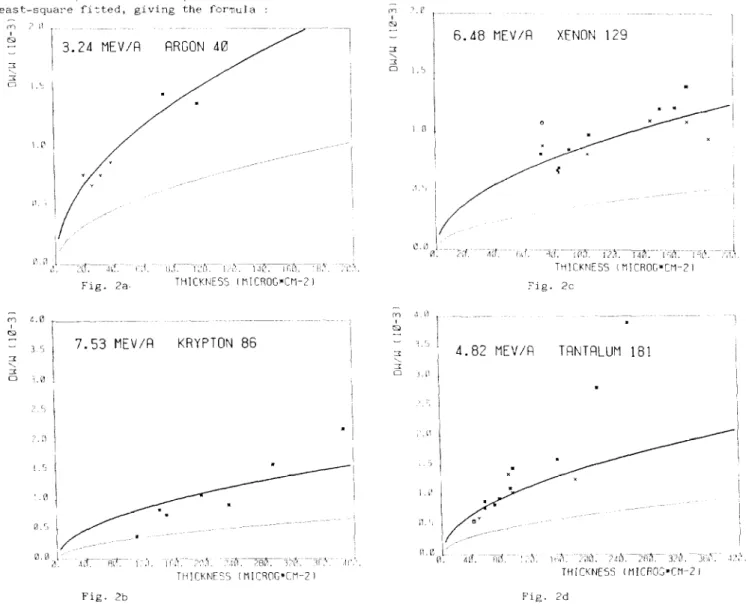
The results are presented cn figures 2a to 2d ; IL can he seen that :
- the results are always higher than predicred bj formula (1) (thin line) sometimes by a factor of 2 o?
3,
- ever. for targets originating frorr the same manufacturer, th? measured values do not show a smooth variation as a function of the thickness ; for
example, the 70 - to - 130 Ilg,/cm ’ Grenoble targets
may generate a 6 W value comparable to t.hr 140 - to - 190 pg,/cm * ones (figures 2~1,
- no target make see-ns to be better than the
others I
- some targets give ~lld results (see the 21;’ and Ihe 255 ~&cm’ points on figure 2d).
Figure 3 shows the results of two series of measurements with foils hzmbarded first by a reduced
(10 ‘pps! Ta bear, then by the full intensity (1.6.10’” PPS) ; although there is a definite growth of the 6W value for each target, the initial value isalways much
larger than could be predicted by formula (1).
In order to have a rough approximation for the energy spread to be expected after the “0.A.E” modiflcarion, all the experimental results were least-square fit-ted, giving the formula :
1’ a 1
,‘, -,y. ,,Lf. / i 1):. ,,,A , :. !Jc;7-rj ‘i: ‘\I’).
/i
Fig. 2a- THICK’IIESS I nICROC*Ct?Z Im L.0 _-..-
~~~~
~
CL
1
~
/
-
i’,
7.53
MEV/A
KRYPTON 86
5
!
2
*.i?
aw/w = 10.5. 1cY3 l.R66+l.i;7 Log w w
(see t,he thick llr:es $7” fig:lres 2a to 2d:, but the accuracy is not better than 5CX.
3.2. Charge state distributions
The distributions were measured for the Xe and :a beams ‘with 5 and 4 different thicknesses respectively; they are presented in Table la and lb, with t,he mean
value ?j and the standard deviation d. For comparison, the last column shows the d:stribJtion as we usually calc:ilate it (f0r equ:libri,q thickness and w ’ 1 .:i MeV/.A 1 , i .e by the formulae (41.
0 = Zp (I - exp ( --yo*:,
R = v/c
(4:
d : <>.t v-i$Y-?qm
(5:
(fcrmula (5) gives d as predicted by ‘J.5 Nikolaev and
I.S. Dmitriev) (‘j 7. It is to be noted that t.he apParently too high calculated 0’s might be due to the fact that in neither case, the equi I i brl urn thickness is reached, as shown by figure 4.
117 ‘.I Al 1 _~. -
6.48
MEVIA
XENON 129
zi
.
/
l!.ii ,
63. ; ;f
n:f I#!‘. xi. &d&l;;,,
i,;h7; I!$. Ai
>
,*
i
.?ig. Z?cm .!I,
&
1 ~-~ ~~
.
.-’ !‘,j‘.I
A.82
MEV/fZ
TFINTRLUM 181
-,
2
j,:
I
.
KM,&1 1,7- R?T I :I. ,I! ??S -:fi. 33: <q. tr? ,I”,
THICKNT’I I MIC%lG’CtI-2 1 Fig. >b
ii l! I ’
(1. blf. lhi I/S. 14 , ,l!\. .*10. -:r3. i.;il. ,i :. f .‘.'. THICYNE55 lNlCP@Z’Cfl-2 1 Fig. 2d
Figure 2. Relative energy spread (HWHM) generated by carbon foils on various beam. Foil origins :
Strasbourg (Cl), Nantes (01, Crenoblp IX), M~crornatter (Yj and Arizona (“1. The thin and heavy lines represent expressions
(1)
and
b4i
respectively.841
3.3. Chcice of the stripper thickness for the "0.A.E" modification (Examplei
Thenorxal injection energy into SSC? can be lowered by at most 2% to accaunt for th? energy :;;E in the stripper ; in the cases consldered here, corresponds to foil thicKnesses of 230 p g/cm ' for Xe and 15':' p g:cir 2 for Ta and, although equill3rium 1s not necessarily reached, tt-,e required charge states
(44 + and 51 + respectively) are very close to the maximum probability.
This choice vo~ld then lead to an additional energy sgread SW/U = + 1.3 ~CI-~ , accor3:ng to formula (3 1. If this last figure were unbearable for a safe accelerat:on in ssc2, a reduction of the quoted thicknesses by a factor of 2 would bring &W/W down
t3 20.3.10-' while reducing the intensities by only
33%.
4) Conclusions
Tie energy spread generated by thick carbon foils
on heavy ion beams can be estimated. The charge state
distributions are fairly well predicted if close to equilibrium and the measurement of their evolution as
a function of fcil thickness allows to find a eood comprorlse to satisfy
constraints of SSC2.
the injection and acceleration c1 ? I1 6 _-
1 4.82
MEV/H
2
2
cl / ';
j
1
I
b
.’
i
~
I
,: i
1’
i
,.!
5,
TRNTFiLUM 181
I
: i ! .’ i a. 1!3. / ‘.!>. I :5 -,,/a
THICKNESS IMICROG*CM-21 Figure 3. Relative energy spread generated by carbonfoils zn a 4.82 MeVj Ta beam with reduced (01, then full (X) inzensity.
The solij line represents expression (11. 5: 0 ( 2 c.,.el -Ixz--- ~- 5 :c1 II 5 A? n '2 1 Xi "E.01 AT.0 ,A'l c1,
I
Ai, E
AA.0
/
.A3
I,
’
“) 1’1
.: ,‘I
--,,,
p_:ly-ji
.Alj I*! .fI’ 1 !,’ r ,‘. 4.i. l,d. ‘Yf LB. -;r,fi.- :I;?. .I:,+
TIY;CKNESS IkilCROC*CM-?I
FlgdrP 4. Mean rharge 5 as a function of foil
thickness for the X e a:ld Ta beams. The values
calri.lnted by (4) are shown as horizontal Iices.
Table 1
Charge distribution ('%I a s a function of foil thickness.
The colunr. noted (5) gives tie predict ion as
calculated with formulae (4) and (5) using the exit energ+ of a 183pg/cm ?foil for XP and of a 157 pg/cm2 foil for Ta.
Charge State 43 44 45 1 2.891 1.381 0.721 0.281 0.361 46 I 6.901 4.031 2.621 1.16 1.061 47 112.641 8.941 6.711 4.001 2.601 08 118.18114.94112.781 9.021 5.351 49 j19.82/18.92117.45113.45/ 9.241 50 /16.27/19.18~19.35~19.49~13.38/ 51 /11.71~15.37~17.68~20.20~16.24~ 52 1 7.001 9.86112.55116.13116.52' 53 / 2.611 4.681 6.551 9.53114.091 54 I 0.821 1.751 2.681 4.68110.071 55 56
Q
Charge / Thickness cLtp,'cm *) I state / '11 8‘ / 102 1 It1 110.3 / (5)' I-- 37 1 1.9El 0.721 3.381 38 1 5.271 2.801 1.621 0.601 0.661 0.2F 39 /11.13/ '7.321 4.721 2.351 1.601 l-.1: 40 ~18.20~14.98~11.37~ 7.151 4.711 3.70 41 ~22.41~2L.79/19.08~14.51~10.94/ 8.98 42 ~18.67~22.16~22.97j20.98~18.10~16.11 43 ~13.02~16.7?~19.86!23.15~23.19~21.35 44 / ~7.25jlO.39~14.53/20.28/24.19~20.9@ 45 I 1.391 2.631 4.241 8.14111.47115.12 46 I 0.251 Q.42/ 1.111 2.361 4.111 8.07 47I
I
j 0.121 0.491 1.031 3.19 .-,T.78~Ib8)++~1.8: d I --_ ---'- a) W = 6.48 MeV/A Xe 6, = 17t d b) W = 4.82 MeV/A Ta Q = 2O+ AcknowledgementsThe authors wish to thank Mrs. A. Meens, Prof. Catherine and Mr. Richaud for providing the targetd ; they are also indebted to J. Ferm6 for strongly encouraging this work and to J. Gillet for his efficient technical help.
References
1. G. Frick et al. ZEEE Trans. on Nut. SC. NS23, 1187 (1976)
2) J. FermG. Proceedings of the 11th. International Conference on Cyclotrons and their applications, 24
(1986)
3) H. Bimbot, H. &win, F. Berna and X. Cadour. Private communication
4) E. Baron - GANIL Report 79R/146/TF14
5) V.S. Nikolaev and 1-S. Dmitriev. Phys. Letters 28A, 2'77 (1968).