The Spatial Footprint of the Non-Ferrous Mining
Industry in Lubumbashi
I. Vranken1,2*, Y.M. Amisi3, F.K. Munyemba4, I. Bamba2, F. Veroustraete5, M. Visser2 & J. Bogaert1 Keywords : Copper Belt- Katanga- Atmospheric deposits- Landscape metrics- Perception- Kevin Lynch Mots clés : Arc cuprifère- Katanga- Dépôts atmosphériques- Indices de structure spatiale- Perception- Kevin
Lynch
Summary
In the south-eastern part of the Katanga Province (Democratic Republic of the Congo), high concentrations of copper and cobalt are found in the soils of the well-known “Copper Belt”. Due to dominant south-eastern winds, the metallurgic industry in Lubumbashi has been the source of spatially concentrated atmospheric deposits of non-ferrous metal particles and associated substances in a cone-shaped zone, situated north-west of the metal processing site. The existence of this zone has been evidenced using two different techniques: firstly, by means of landscape metric comparisons of the vegetation and bare soil patterns in two study areas, one inside the pollution cone and one outside; secondly, by means of the city perception theory developed by Kevin Lynch. Higher fragmentation and lower vegetation presence were observed inside the pollution cone, reflecting the negative impact of the atmospheric deposits. Those differences were higher for sites closer to the emission source. Lynch’s approach outlined the negative impact of diverse industrial plants on the perception of the local population. Six pollution districts and several contaminated paths, limits, nodes and polluting landmarks were identified. Citizens even recognize them as part of the collective image of the city.
Résumé
Empreinte spatiale de l'industrie minière non ferreuse à Lubumbashi
Dans le sud-est du Katanga (République Démocratique du Congo),de hautes concentrations de cuivre et cobalt sont présentes dans les sols de l’Arc cuprifère. Suite à des vents dominants des secteurs sud-est, l’industrie métallurgique à Lubumbashi a été la source de dépôts atmosphériques de métaux non ferreux et substances associées, concentrés en une zone en forme de cône au nord-ouest de l’usine. L’existence de ce cône a été démontrée par deux techniques: premièrement, aumoyen de comparaisons d’indi-ces de structure spatiale de la végétation et des sols nus; et ensuite avec la théorie de la perception urbaine développée par Kevin Lynch. Une fragmentation plus importante et une présence plus faible de végétation ont été observées dans le cône de pollution, ce qui reflète l’impact négatif des dépôts atmosphériques. Ces différences étaient plus élevées pour les sites plus proches de la source d’émission. L’approche de Lynch a mis en évidence l’impact négatif de plusieurs usines sur la perception de la population locale. Six quartiers de pollution et plusieurs voies, limites et nœuds contaminés ainsi que des points de repères polluants ont été identifiés. Les citoyens les reconnaissent même comme partie intégrante de l’image collective de la ville.
Introduction
Soil contamination by atmospheric deposits of non-ferrous metals has been described for ecosystems worldwide (5, 15, 34, 38). In the south-eastern part
of the Katanga Province (Democratic Republic of the Congo), high concentrations of copper and cobalt are present in the soils of the well-known “Copper Belt” (14). This zone has been a place of intensive mining in the colonial period itself (until
1 Université de Liège, Gembloux Agro-Bio Tech, Unité Biodiversité et Paysage, Gembloux, Belgique.
2 Université Libre de Bruxelles, Ecole Interfacultaire de Bioingénieurs, Service d'Ecologie du Paysage et Systèmes de Production Végétale, Bruxelles, Belgique.
3 Université de Lubumbashi, Faculté des Sciences, Lubumbashi, R.D. Congo.
4 Université de Lubumbashi, Faculté des Sciences Agronomiques, Lubumbashi, R.D. Congo.
5 Flemish Institute for Technological Research, Atmospheric Processes and Remote Sensing Unit, Mol, Belgium. * Auteur correspondant : Email : ivranken@ulg.ac.be
1960) and afterwards, when mining activities and pyrometallurgic industry were continued by the Gécamines Company (4).
The analysis of landscape patterns is justified by the pattern/process paradigm, a central hypothesis in landscape ecology (37) linking emerging patterns to underlying processes. Landscapes close to metal processing sites generally display a distinct pattern of scattered vegetation patches embedded in a matrix of bare soil (19, 26). Due to the dominant south-eastern winds, the metallurgic industry in Lubumbashi, capital of the Katangese Copper Belt, has been the source of spatially concentrated atmospheric deposits of non-ferrous metal particles and associated substances in a cone-shaped zone or “pollution cone”, situated north-west of the metal processing site and characterised by degraded vegetation (11, 20, 24). At the landscape level, the footprint of this long-term metal processing activity should therefore be detectable as a zone with higher vegetation fragmentation and higher bare soil presence. Unfortunately, this footprint, and hence the existence of the pollution cone, has not yet been evidenced using landscape metrics (8). Therefore, this paper compares the patterns of vegetation and bare soil of two oppositely placed study areas, one inside the pollution cone and one outside.
According to Kevin Lynch (23), environmental perception or legibility is central for every living creature capable of motion because perception determines the way they exploit their environment to subsist, depending on their movements across the landscape. Features leading to stronger images for citizens (high “imageability”) then form the urban system, the analysis of which should be at the base of urban design (23). Industrial landscapes are an issue of concern when a perceptive approach is applied since industrial residues may spread far beyond the industrial infrastructure itself, e.g., bare soils resulting from vegetation degradation due to environmental contamination (3, 23, 29). The application of the Kevin Lynch theory (23) is considered complementary to the aforementioned analysis based on landscape metrics, and is hence the second objective of this paper. Evidencing the ecological footprint of the non-ferrous mining industry is considered crucial to confront local decision makers with the negative impact of metallurgic industry within an urban context.
Material and Methods
Landscape metrics
A map of Lubumbashi containing four land cover
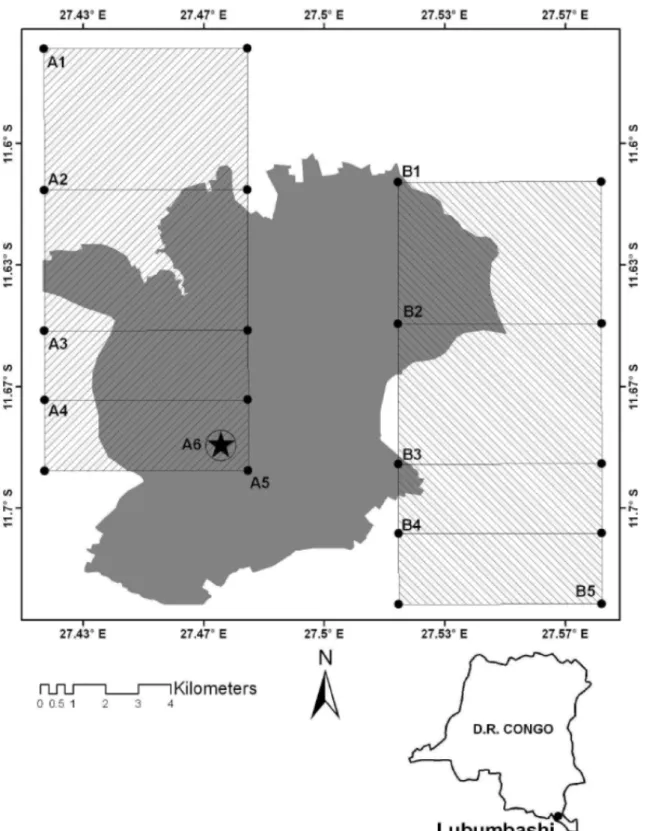
classes (vegetation, bare soil, built-up, water) based on a Quickbird image of 2005 was used (27, 28); spatial resolution was set to 40 m to fit the recommended 30-100 m resolution range (32) for pattern analysis. Two regions of interest (ROI) of 79 km² were defined and compared, one inside the pollution cone, situated north-west of the emission source, i.e. inside the deposit range (18) and one outside the pollution cone, situated south-east of the emission source (Figure 1). Each ROI was divided in three subzones of 13 km², 26 km² and 52 km² (with the smallest subzone closest to the emission source) in order to enable the detection of the influence of spatial scale. Total area, number of patches, average patch size and area of the largest patch of the vegetation and bare soil classes were calculated and noted as av, nv, āv, amax,v and as, ns,
ās, amax,s respectively.
To avoid any influence of the absolute areas of vegetation and bare soil on pattern measurement and to exclude non-pollution related differences between the zones, two ratios were calculated to compare the relative presence of vegetation and bare soil. R1 (Equation I) expresses the dominance
of vegetation over bare soil (R1>1) or the
dominance of bare soil over vegetation (R1<1):
R
1=
a
va
s (I)R1 is expected to be lower inside than outside the
pollution cone because of the higher presence of bare soils due to toxic deposits.
Secondly, R2 (Equation II) compares the average
patch sizes of both classes:
R
2=
a
va
s(II)
R2 is expected to be lower inside the pollution cone
and higher outside because of the supposed higher vegetation fragmentation in the cone.
The fragmentation degree of both land cover types was also measured by the index of the largest patch (7) expressing the dominance (%) of the largest patch [Dv for vegetation (Equation III), Ds for
bare soil (Equation IV)] inside its class:
D
v=
a
max , va
v(III)
D
s=
a
max , sFigure 1: Map of the two study areas in Lubumbashi situated oppositely of the emission source (Gécamines smelter), indicated by a star symbol (A6). Each study area of 79 km² (rectangles A1/A5 respectively B1/B5) contains three subzones of 13 km² (rectangles A4/A5 respectively B4/B5), 26 km² (rectangles A3/A5 respectively B3/B5) and 52 km² (rectangles A2/A5 respectively B2/B5). As a consequence of the prevailing south-eastern winds, the pollution cone is expected to be situated north-west of the emission source. The grey zone indicates the central part of Lubumbashi, including the following municipalities: Katuba, Kampemba, Lubumbashi, Kamalondo, Kenya and Ruashi.
Dv was expected to be higher outside the pollution
cone and Ds was expected to be higher inside the
pollution cone. Perception analysis
In order to analyse the “imageability” and legibility of the city, cognitive cartography was realised. The study was carried out in 2007 and inscribed inside the agglomeration of Lubumbashi according to perceived limits empirically defined during field prospection (1). Two different methods were used, the first approach consisted of the identification of the structuring elements composing the city images: edges, paths, nodes, landmarks and quarters (23, 40).
Point edges (1, 2) have also been added to adapt the theory of Lynch (23) to developing countries, where cities are less frequently limited by easily identifiable boulevards and where certain landmarks can be considered as edges. By walking, cycling or driving across the city, the presence, visibility, and interrelations between the structuring elements have been examined by four trained experts. Their observations are considered as repetitions of the observations made by a single person and hence form the “map of the observer” (2). The second approach consisted of interviewing one hundred citizens. Sample size was verified using a saturation-accumulation curve (data not shown) in order to test whether all relevant elements had been cited. The point at which this curve, representing number of elements vs. number of individuals interviewed, levels off is accepted to correspond to the minimum sample size required (3, 16). To avoid any bias due to the interviewing sequence, 99 randomisations of this sequence were produced using the EstimateS software, which generated accumulation curves for each element with a 95% confidence limit (12).
Citizens were firstly asked general questions about the image evoked by Lubumbashi. Consequently, they were requested to describe the paths they usually took to walk across the town, and put this into words as if they had to explain it to a someone not familiar with Lubumbashi. This method allows an identification of the city elements from a citizen’s point of view and the affect he associates with them. Secondly, pictures of representative elements of Lubumbashi, including metallurgic infrastructures or sites close to them where shown. The people interviewed were asked to describe their feelings about the metallurgic industry in their city, and were requested to identify which of the six aforementioned structuring elements allowed to recognize such sites and their environmental
impact. All cited elements were used to compose a map forming the collective image of the city.
The map of the observer and the collective map were compared using the Sørensen similarity index
Ss (17, 21, 36) (Equation V):
S
s=
2 a
2 a
+b+c
×100
(V)with a the number of elements present in both maps, and b and c the number of elements mentioned in only one of both maps. A chorema (10) combining the elements linked to the mining industry and characterised by environmental impact from both collective and observer’s maps was also produced to highlight the negative impact of the mining industry on the town and to compare it with the aforementioned spatial statistic approach (3, 10, 28).
Results
Landscape metrics
Inside and outside the pollution cone, a dominance of vegetation over bare soil (R1>1) was observed,
but this dominance was higher outside (R1≈3.5) the
pollution cone than inside (R1≈2), as expected
(Figure 2a). The average patch area of vegetation was found to be higher than the average patch area of bare soil both inside and outside the pollution cone (R2>1; Figure 2b), but the difference was more
pronounced outside (R2≈13) than inside the
pollution cone (R2≈5).
Hence, vegetation patches are actually smaller inside the cone than outside. The relative positions of the curves representing the fragmentation metrics (Figures 2a,b) confirm that vegetation cover is less fragmented outside the pollution cone than inside; analogously, bare soil is less fragmented inside the pollution cone than outside. The metric curves with respect to the inside and outside of the cone come closer to each other as the study zone extents increase. Hence, the differences between vegetation and bare soil patterns decrease when considering larger study zones, including areas located further away from the emission source (28, 39).
Perception analysis
Accumulation curves (data not shown), showed that after 45 interviews all city structuring elements had been cited (1, 2, 39). No significant elements have consequently been ignored.
observer’s map with those composing the collective map evidences a high similarity (Table 1) when compared to Lynch (23). The perceived elements which could be linked to the negative (visual) impact of mining (in both the observer’s and the collective maps) have been represented on a synthetic chorema (10) (Figure 3).
Each of the six elements composing the image of the city was reported as environmentally altered by the mining industry. The map clearly identifies the
pollution cone linked to the activity of the Gécamines industry, and more recently the STL plant, situated on the same site. Nevertheless, it also shows that many other mining companies installed in the periphery of the town induce perceived environmental impacts. In the northern part of the city, recent industries, i.e. South China Mining, Zong Hang, Zhong Hua, Cota Mining, Ngapura Mining, Huachim Society, Congo Loyal and Congo Julian were cited. In the eastern part, Ruashi mining is situated in the centre of a large mining district. Other industrial plants were also mentioned, situated between the railway and the Naviundu River: Chemaf, STVD, Ciment Kat and Exaco. Even if most of those recent industries only occupy the peripheral zone of the city, their impact is also mentioned in the city centre, notably through the citation of transportation axes and rivers which were reported to be contaminated by these mining activities; the embankment areas of two out of five rivers (Naviundu and Lubumbashi) were also reported as polluted. Polluted drinking water was mentioned in the interviews as well. Decantation pools and fumes were denoted as pollution sources. The presence of bare soils and metallophyte vegetation were frequently cited as consequences of those polluting activities. Next to the different metallurgic plants from which the city originated, contamination and pollution are nowadays part of the image of the city of Lubumbashi.
Discussion
Higher vegetation presence and lower fragmentation outside than inside the pollution cone confirmed our hypothesis. This is consistent with observations from soil science and botany carried out in the area, though their extent could not be made as large as those in this study for logistic reasons. Indeed, higher copper and cobalt concentrations were found in surface horizons of
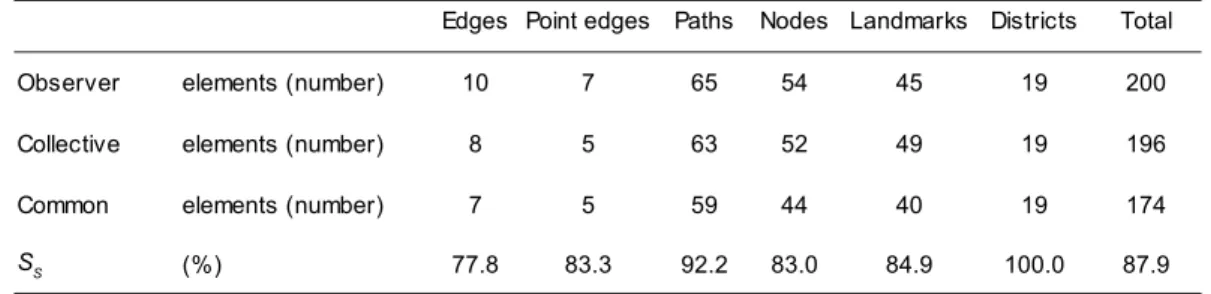
Table 1
Number of elements composing the image of Lubumbashi, for the trained investigators (observer) and the interviewed citizens (collective). SS: Sørensen coefficient of similarity between both maps.
Figure 2 : Pattern analysis of vegetation and bare soil by means of landscape metrics in Lubumbashi. Two study areas are compared, one situated inside the pollution cone, one situated outside. (a) Dominance of vegetation or bare soil in the study areas as measured by the ratio of the area of the vegetation to the area of bare soil (R1). (b) Comparison of the
average patch area between vegetation and bare soil by means of the ratio R2.
Districts Total
Observer 10 7 65 54 45 19 200
Collective 8 5 63 52 49 19 196
7 5 59 44 40 19 174
(%) 77.8 83.3 92.2 83.0 84.9 100.0 87.9 Edges Point edges Paths Nodes Landmarks
elements (number) elements (number) Common elements (number)
soils (35) and land cover changes have been observed over time, replacing miombo with savannah, metalliferous grass species, and bare soils for the extreme contamination cases (11, 20, 22, 24, 25, 35). When both study zones are enlarged, they appear to become more similar. This may be understood because the area extensions are situated further away from the emission source and are less influenced by atmospheric deposits. This tends to confirm that vegetation is affected by those deposits, as vegetation cover increases when deposit amounts and densities decrease with distance. Furthermore, pattern change with changing extent is common in large scale ecological studies since pattern features have been found to appear or disappear with
changing spatial scales (6, 13).
The differences observed between the maps composed by trained observers, on one hand, and the collective maps, on the other hand, are assumed to be originating from differences in instruction level between local populations and experienced investigators (1, 2). Since the social contrast between rich and poor citizens is generally larger in developing countries compared to developed ones (40), a lower similarity could be expected, as evidenced by this study. Indeed, mobility, or “motility”, i.e. the ability to move across a city, using different means of transportation, or to find one’s way on maps, is reported higher for upper social levels, having higher so-called
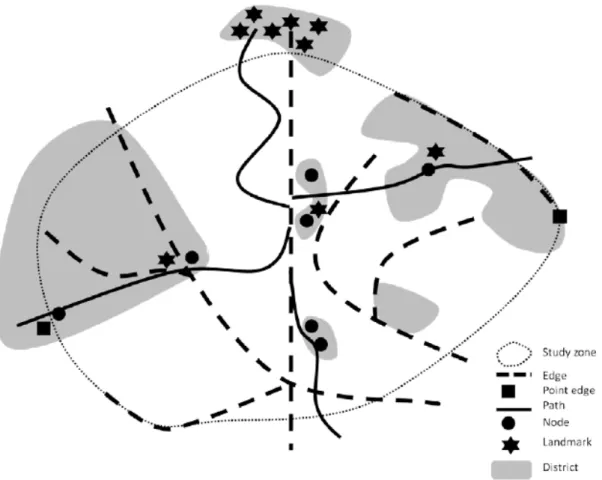
“socio-Figure 3:Chorema of the perceived negative impacts of mining and industry in Lubumbashi (synthesis of observers’ and collective maps). Each of the six elements composing the city has been represented according to its association with perceived environmental impacts related to mining and/or metallurgic industry. Edges are contaminated main roads or rivers, point edges being industrial plants. Landmarks are also industrial buildings or plants. Paths correspond to the main roads to mining sites. Nodes are often mining sites connected to paths related to pollution. Districts are mainly characterised by contamination, deforestation, bare soils and metallophyte vegetation. Northern zone: district of recently developed industries such as South China Mining, Zong Hang, Zhong Hua, Cota Mining, Ngapura Mining, Huachim Society, Congo Loyal and Congo Julian. Eastern zone: district with Ruashi mining zone and metal processing factories. Central zone, situated in between the railway (West) and the Naviundu River (East): districts marked by presence of Chemaf, STVD, Ciment Kat, and Exaco. Western zone: Gecamines and STL industrial plants with their pollution cones.
spatial” competences (9, 33).
The current study shows that Kevin Lynch's urban picturesque analysis methods are applicable to developing countries as well when slightly adapted. New concepts like point limits have been introduced to enable this, but the method remains sufficiently general to apply elsewhere as well. A major critique on Lynch's work was the small number of interviewed individuals to establish cognitive representations of the city (23). To avoid this drawback, Kevin Lynch suggested a huge census, which would have been harsh to conduct. Therefore, the accumulation curve method used in the current study allows to compose a complete collective image of the city and, at the same time, with a limited sample size (1, 2). It is also interesting to note that, although mining zones and roads were also perceived as major structuring elements of the town itself and of its development (1, 2, 39), they were also perceived as highly polluted.
Conclusion
Landscape analysis using pattern metrics confirms the hypothesis that, due to prevailing south-eastern winds, higher concentrations of non-ferrous metal particles have been deposed north-west of the Gécamines metal processing site, causing lower relative vegetation presence and higher vegetation
fragmentation. The area and cost-efficiency of remote sensing and pattern analysis, complementary to specific on-site investigation, is also highlighted in this study, as previous small-extent botanical or soil studies, though abounding in this sense for years, have not been able, till now, to evidence the very presence of a uniform and large pollution cone downwind of the Gécamines plant. Still, its depth and widths remain to be defined. Application of Kevin Lynch’s methodology taught that (industrial) mining activities largely influence the image of the city, also outside the pollution cone. The location of new mining and metal processing activities in what is currently the city periphery, will not solve the problem, since urban sprawl due to population growth will establish new contact areas between habitat and industry (30, 31).
Evidencing the existence as well as the ecological and human impacts of the pollution cone is crucial in convincing local decision makers of the negative impact of metallurgic industry in urban living conditions and perception.
Acknowledgements
This research was supported by the PIC REMEDLU (CUD). I. Vranken is a research assistant of the FNRS, Belgium.
Literature 1. Amisi M.Y., 2007, Perception et cartographie de Lubumbashi selon la
méthode de Kevin Lynch, Master dissertation, Sciences Agronomiques, Université de Lubumbashi, Lubumbashi, 60 p. 2. Amisi M.Y., 2008, Applicabilité de la théorie de perception de Kevin
Lynch à une ville du tiers monde, Annales de la Faculté des Sciences Agronomiques de Lubumbashi, 1, 71-77.
3. Amisi M.Y., 2010, Perception de l’impact des activités minières au Katanga. Analyse par l’application de la théorie paysagère de Kevin Lynch, Ph. D. dissertation, Faculté des Sciences, Université de Lubumbashi, Lubumbashi, 340 p.
4. Banza C.L.N., Nawrot T.S., Haufroid V., Decree S., De Putter T., Smolders E., Kabyla B.I., Lubuya O.N., Ilunga A.N., Mutombo A.M. & Nemery B., 2009, High human exposure to cobalt and other metals in Katanga, a mining area of Democratic Republic of Congo, Environmental Resources, 109, 745-752.
5. Barcan V.S. & Kovnatsky E.F., 1998, Soil surface geochemical anomaly around the copper–nickel metallurgical smelter, Water Air Soil Pollution, 103, 197-218.
6. Benson J.B. & Mackenzie M.D, 1995, Effects of sensor spatial resolution on landscape structure parameters, Landscape ecology,
10, 113-120.
7. Bogaert J., Zhou L. & Tucker C.J. et al., 2002, Evidence for a persistent and extensive greening trend in Eurasia inferred from satellite vegetation index data. Journal of Geophysical Research,
107, D11, ACL 4-1-ACL 4-14.
8. Bogaert J. & Hong S.-K., 2004, Landscape ecology: monitoring landscape dynamics using spatial pattern metrics. In: S.-K. Hong, J.A. Lee, B.-S. Ihm, A. Farina, Y. Son, E.-S. Kim, J.C. Choe (editors), Ecological issues in a changing world: status, response and strategy, Kluwer academic publishers, Dordrecht, pp. 109-131.
9. Bret B., 2009, Interpréter les inégalités socio-spatiales à la lumière de la théorie de la justice de John Rawls, Annales de Géographie, 1, 16-34.
10. Brunet R., 1980, La composition des modèles dans l’analyse spatiale, L’Espace Géographique, 4, 252-265.
11. Chapelier A., 1957, Elisabethville. Essai de géographie urbaine, Académie Royale des Sciences Coloniales, Duculot, Gembloux, 168 p.
12. Colwell R.K., 2009, EstimateS: Statistical estimation of species richness and shared species from samples, Version 8.2, User's guide and application published at: http://purl.oclc.org/estimates.
13. Farina A., 1998, Principles and methods in landscape ecology, Springer, Heidelberg, 235 pp.
14. Faucon M.P., 2009, Ecologie et biologie de la conservation des métallophytes. Le cas de Crepidorhopalon perennis et C. tenuis (Scrophulariaceae) des sols cupro-cobaltifères du Katanga, Ph.D. dissertation, Université Libre de Bruxelles, Brussels, 220 p.
15. Ginocchio R., 2000, Effects of a copper smelter on a grassland community in the Puchuncavi Valley, Chile, Chemosphere, 41,15-23. 16. Horn H.S., 1993, Biodiversity in the backyard, Scientific American,
268, 150-152.
17. Jaccard P., 1900, Contribution au problème de l’immigration post-glaciaire de la flore alpine, Bulletin de la Société vaudoise des Sciences Naturelles, 39, 87-130.
18. Koptsik S.N. & Koptsik G.N., 2001, Soil pollution patterns in terrestrial ecosystems of the Kola peninsula, Russia. In: D.E. Stott, R.H. Mohtar and G.C. Steinhardt (editors), Sustaining the Global Farm. 10th International Soil Conservation Organisation Meeting, 22-25 May 2001, Purdue, pp. 212-216.
20. Leblanc M. & Malaisse F., 1978, Lubumbashi: un écosystème urbain tropical, Centre international de sémiologie, UNAZA, Lubumbashi, 166 p.
21. Legendre L. & Legendre, P., 1979, Ecologie numérique: la structure des données écologiques, Les presses de l’Université du Québec, Vol. 2, pp. 1-49.
22. Leteinturier B., Baker A.J.M. & Malaisse F., 1999, Early stages of natural revegetation of metalliferous mine workings in south central Africa: a preliminary survey, Biotechnologies, Agronomie, Société, Environnement, 3, 28-41.
23. Lynch K., 1960, The image of the city, The M.I.T. press, Cambridge, 194 p.
24. Malaisse F., 1997, Se nourrir en forêt claire africaine. Approche écologique et nutritionnelle, Presses agronomiques de Gembloux, Gembloux, 384 p.
25. Mbenza M., Aloni K. & Muteb M., 1989, Quelques considérations sur la pollution de l’air à Lubumbashi (Shaba, Zaire), Geo-Eco-Trop, 13, 113-125.
26. Montgomery C.W., 2003, Environmental Geology, Mc Grow Hill companies, inc., Columbus, pp. 306-310.
27. Munyemba K.F., Bamba I., Kabulu D.J., Amisi M.Y., Veroustraete F., ngongo L.M. & Bogaert J., 2008, Occupation des sols dans le cône de pollution à Lubumbashi. Annales de la Faculté des Sciences Agronomiques, 1, 19-25.
28. Munyemba F.K., 2010, Quantification et modélisation de la dynamique paysagère dans la région de Lubumbashi: évaluation de l’impact écologique des dépositions issues de la pyrométallurgie, Ph. D. dissertation, Faculté des Sciences Agronomiques, Université de Lubumbashi, Lubumbashi, 284 p.
29. Neuray G., 1982, Des paysages: pour qui ? Pourquoi ? Comment ?, Presses agronomiques de Gembloux, Gembloux, 589 p.
30. Nkuku C. & Rémon M., 2006, Stratégies de survie à Lubumbashi
31. Nzuzi L., 1991, Urbanisation, industrialisation et hiérarchie urbaine dans le Shaba (Zaïre). In: J. Beaujeau-Garnier, B. Dezert (editors), La grande ville, enjeu du XXIème siècle, Presses universitaires de France, Paris, pp. 127-145.
32. O’Neill R.V., Riiters K.H., Wickham J.D. & Jones K.B., 1999, Landscape pattern metrics and regional assessment, Ecosystem Health, 5, 225-233.
33. Orfeuil J.-P, 2004, Transports, pauvretés, exclusions : pouvoir bouger pour s'en sortir, Aube, La Tour d'Aigue, 181 p.
34. Raven P.H., Evert R.F., Eichhorn S.E., 2000, Biologie végétale, De Boeck université, 944 p.
35. Shutcha M.N., Muemba M.M., Faucon M.P., Luhembwe M.N., Visser M., Colinet G. & Meerts P., 2010, Phytostabilisation of copper-contaminated soil in Katanga: an experiment with three native grasses and two amendments, International Journal of Phytoremediation, 12, 616-632.
36. Sørensen T., 1948, A method of establishing groups of equal amplitude in plant sociology based on similarity of species content. Biologiske skrifter kongelige Danske videnskabernes selskab, 4, 1-34.
37. Turner M.G., 1989, Landscape ecology: the effect of pattern on process, Annual Review of Ecology and Systematics, 20, 171-197. 38. Vangronsveld J., Vanassche F. & Clijsters H., 1995, Reclamation of a
bare industrial-area contaminated by non ferrous metals: in situ metal immobilization and revegetation, Environmental Pollution, 87, 51-59. 39. Vranken I., 2010, Pollution et contamination des sols aux métaux
lourds dues à l’industrie métallurgique à Lubumbashi: Empreinte écologique, impact paysager, pistes de gestion, Master dissertation, Université Libre de Bruxelles, Brussels, 118 p.
40. World Bank, 2005, Development indicators: economy, available online at http://devdata.worldbank.org/wdi2005/Cover.htm&title= BanqueMondiale%2Cindicateurs2005