1
Simultaneous determination of 14 bioactive citrus flavonoids
1using thin-layer chromatography combined with surface
2enhanced Raman spectroscopy
3Yuzhi Lia,c, Chengying Zhaoa, Chang Lua, Shuaishuai Zhoua, Guifang Tiana, Lili Heb,
4
Yuming Baoa, Marie-Laure Fauconnierc, Hang Xiaob,*, Jinkai Zhenga,*
5
a Institute of Food Science and Technology, Chinese Academy of Agricultural Sciences,
6
Beijing 100193, China
7
b Department of Food Science, University of Massachusetts, 100 Holdworth Way,
8
Amherst, MA 01003, USA
9
c Laboratory of Chemistry of Natural Molecules, Gembloux Agro-Bio Tech, University
10
of Liege, Gembloux 5030, Belgium
11
* Corresponding author: Jinkai Zheng, Tel: 62819501, Fax:
(086)-010-12
62819501; Hang Xiao, Tel: (413) 545 2281, Fax: (413) 545 1262.
13
E-mail address: [email protected]; [email protected]. 14
2
Abstract
16
Citrus flavonoids consist of diverse analogs and possess various health-promoting
17
effects dramatically depending on their chemical structures. Since different flavonoids
18
usually co-exist in real samples, it’s necessary to develop rapid and efficient methods
19
for simultaneous determination of multiple flavonoids. Herein, thin layer
20
chromatography combined with surface enhanced Raman spectroscopy (TLC-SERS)
21
was established to simultaneously separate and detect 14 main citrus flavonoids for the
22
first time. These target compounds could be characterized and discriminated when
23
paired with SERS at 6-500 times greater the sensitivity than TLC alone. TLC-SERS
24
exhibited high recovery rates (91.5-121.7%) with relative standard deviation (RSD)
25
lower than 20.8%. Moreover, the established TLC-SERS method was successfully used
26
to simultaneously detect multiple flavonoids in real samples, which exhibited
27
comparable accuracy to high performance liquid chromatography (HPLC) with shorter
28
analytical time (10 vs 45 min). All the results demonstrated that this could be a
29
promising method for simultaneous, rapid, sensitive and accurate detection of
30
flavonoids.
31
Keywords: citrus flavonoids, simultaneous determination, thin layer chromatography,
32
surface-enhanced Raman spectroscopy, HPLC.
3
Chemical compounds studied in this article
34
Tangeretin (PubChem CID: 68077); 5-demethyltangeretin (PubChem CID: 96539);
35
nobiletin (PubChem CID: 72344); 5-demethylnobiletin (PubChem CID: 358832);
36
naringenin (PubChem CID: 932); .hesperetin (PubChem CID: 72281); naringin
37
(PubChem CID: 442428); hesperidin (PubChem CID: 10621).
4
1
Introduction
39
Flavanones and polymethoxyflavones (PMFs) are the two major flavonoids in citrus
40
fruits, especially in their peels. Citrus flavanones, a class of polyphenolic flavonoids,
41
usually exists as glycoside forms including naringin and hesperidin, which are the most
42
abundant in citrus fruit. They could be converted to their aglycones, namely naringenin
43
and hesperetin (Chen et al., 2018). PMFs, existing exclusively in citrus fruits, are a
44
unique class of flavonoids with two or more methoxyl functional groups (Li, Lo & Ho,
45
2006). The diversity of PMFs could be contributed to the multiple substituents of the
46
aromatic ring like hydrogen, hydroxyl and methoxyl groups. A number of studies have
47
reported that citrus flavonoids possess various beneficial biological functions such as
48
anticancer (Surichan, Arroo, Ruparelia, Tsatsakis & Androutsopoulos, 2018),
anti-49
inflammatory (Liu, Han, Zhao, Zhao, Tian & Jia), antiatherosclerosis (Kenji, Natsumi,
50
Tai-Ichi & Toshihiko, 2013), antioxidation (Sundaram, Shanthi & Sachdanandam,
51
2015), anti-viral (Dai et al., 2019), neuroprotection (Chitturi, 2019), among others.
52
Notably, the chemical structures dramatically determine the bioactivities, and different
53
substituents could lead to significant bioactivity variation. For example, hydroxylated
54
PMFs (OH-PMFs), which are formed with hydroxyl groups replacing methoxyl groups
55
or hydrogen of PMFs, exhibit stronger bioactivities than their corresponding parent
56
compoundsdepending on the structural requirements for optimal active sites (Duan et
57
al., 2017; Li, Hong, Guo, Hui & Ho, 2014; Zheng et al., 2013).However, in most cases,
58
citrus flavonoid analogs exist simultaneously in real samples. It is thus necessary to
5
develop quick and efficient methods for simultaneous differentiation of citrus
60
flavonoids.
61
Many methods have been established successfully to analyze citrus flavonoids, such
62
as HPLC-UV (Han, Kim & Lee, 2012; Sayuri, Suwa, Fukuzawa & Kawamitsu, 2011),
63
HPLC-electrochemical detection (ECD) (Li, Pan, Lai, Lo, Slavik & Ho, 2007; Zheng
64
et al., 2015), ultra-performance liquid chromatography (UPLC) (Fayek, 2019; Zhao,
65
2017), LC-MS (Cho, Su, Sun, Mi & Hong, 2014; Lin, Li, Ho & Lo, 2012), and GC-MS
66
(Stremple, 2015). HPLC-UV was the most widely used method, especially for
67
quantitative analyses, and the limit of detection (LOD) was reported to be as low as
68
0.02 μg/mL for naringenin (Lin, Hou, Tsai, Wang & Chao, 2014). In our previous study,
69
HPLC-ECD was established as a sensitive and selective technique with lower LOD
70
values of 0.8-3.7 ng/mL OH-PMFs (Zheng et al., 2015).UPLC benefits from a shorter
71
run time than HPLC which can achieve the detection of 16 flavonoids with LODs less
72
than 0.72 μg/mL within 9 min (Zhao, 2017).LC-MS is one of the most common
73
analytical methods with the separation capabilities of HPLC and structural
74
characterization power of mass spectrometry (MS) (Lin et al., 2012; Zheng et al., 2013).
75
It has been used to separate and analyze citrus flavonoids from various matrix with
76
LOD value of 0.02-0.23 μg/mL for six PMFs and six OH-PMFs simultaneously (Lin et
77
al., 2012). Besides, GC-MS is another common analytical method and has been also
78
used for citrus flavonoid analysis (Stremple, 2015).Although the above methods can
79
analyze citrus flavonoids sensitively and effectively, they all have certain limitations.
6
For instance, HPLC methods are time-consuming, and require complex and rigorous
81
pretreatment; ECD is only effective for compounds with oxidation-reduction property;
82
UPLC is expensive due to the requisite instrument and agents, and difficult to realize
83
on-site detection; MS is also expensive on account of the instrumentation and
84
demanding due to the strict run conditions for the operator; while GC-MS requires a
85
complex derivatization process for citrus flavonoids.
86
Surface-enhanced Raman spectroscopy (SERS) has been proven to be an efficient
87
analytical tool due to its rapid analytical speed, high sensitivity, signal fingerprinting
88
capabilities, and non-destructive properties (Wen & Lu, 2016). The Raman signals
89
could be significantly enhanced due to an electromagnetic field induced by the surface
90
plasmon resonance and chemical interactions between analyte and substrate (Reguera,
91
Langer, Jimenez & Liz-Marzan, 2017). In the past few years, SERS has been widely
92
used in different fields, such as materials science, various engineering disciplines,
93
medical science, food science and so on (Zheng & He, 2014). Recent studies have also
94
proven the capacity of SERS for the characterization of citrus flavonoids (Ma, Xiao &
95
He, 2016; Zhang et al., 2018; Zheng, Fang, Cao, Xiao & He, 2013).However, it remains
96
difficult to differentiate citrus flavonoid analogs in real samples by virtue of their
97
similar chemical structures, as well as interference of other components in the complex
98
matrix. Thin-layer chromatography (TLC) and high performance TLC (HPTLC) are
99
common separation techniques. Although HPTLC is more stable and accurate than TLC,
100
and has been reported as an ideal method for fingerprinting studies of plant samples
7
(Meier & Spriano, 2010; Mikropoulou, Petrakis, Argyropoulou, Mitakou, Halabalaki
102
& Skaltsounis, 2019; Oellig, Schunck & Schwack, 2018), TLC is more commonly used
103
with several notable advantages, such as low cost and simplicity. However, TLC is
104
limited in its use for quantitative analysis due to relatively low accuracy. The
105
combination of TLC and SERS allows separation and subsequent spectral detection of
106
chemical species from complex matrices, and multiple successful examples of its use
107
have been reported (Germinario, Garrappa, Dambrosio, Werf & Sabbatini, 2018; Zhu,
108
Chen, Han, Yuan & Lu, 2017).
109
In this study, TLC-SERS was developed to achieve simultaneous, sensitive and
110
accurate detection of 14 citrus flavonoids (Fig. 1A) for the first time. In order to obtain
111
better separation and detection efficiency, two-dimensional (2D) TLC was carried out.
112
The chromatographic elution profile of 14 citrus flavonoids on TLC and characteristic
113
signatures of SERS spectra were also systematically studied. This study has the
114
potential to further advance the rapid and efficient determination of different flavonoids
115
in the citrus industry, as well as other applications for functional foods.
116
2 Materials and methods
117
2.1 Reagents and chemicals 118
Vanillin, concentrated sulfuric acid (18.4 M), acetic acid, ethanol, petroleum ether
119
(PE), acetone (AT), dichloromethane (DCM), methanol (MT), ferric chloride (FeCl3),
120
and hydrochloric acid (11.7 M) were of analytical grade and purchased from Sinopharm
121
Chemical Reagent Co., Ltd (Beijing, China). Acetonitrile (ACN), tetrahydrofuran (THF)
8
and trifluoroacetic acid (TFA) were of HPLC grade bought from Fisher Scientific.
123
Normal phase TLC plates (250 μm layer) were bought from Merk kGaA (Darmstadt,
124
Germany). Silver nitrate (99%) and zinc (99%) were bought from Eastern Chemical
125
Works (Shanghai, China). Silver (Ag) dendrites were prepared through a displacement
126
reaction involving zinc and silver nitrate according to our previously published method
127
(He et al., 2013). Tangeretin (1) and nobiletin (3) were purchased from Quality
128
Phytochemicals LLC (Edison, NJ, USA). 5-demethyltangeretin (2),
3′-129
demethylnobiletin (4), 4′-demethylnobiletin (5), 3′,4′-didemethylnobiletin (6),
5-130
demethylnobiletin (7), 5,3′-didemethylnobiletin (8), 5,4′-didemethylnobiletin (9) and
131
5,3′,4′-tridemethylnobiletin (10), were obtained by multi-steps synthesis we have
132
reported before (Lin et al., 2012; Zheng et al., 2015). Naringenin (11), hesperetin (12),
133
naringin (13) and hesperidin (14) were purchased from ACROS Organics (New Jersey,
134
USA). All their purities were up to 98% (HPLC), and their chemical structures have
135
been elucidated by MS and NMR spectra (Zheng et al., 2013).Ultrapure water was
136
further purified from deionized water using a Milli-Q system (Millipore, Bedford,
137
USA).
138
2.2 TLC separation of 14 citrus flavonoid analogs 139
Compounds 1-12 were dissolved in methanol to 5 mM, and gradient-diluted to 2.5,
140
1.0, 0.5, 0.1, and 0.05 mM were used for LOD determination on the TLC plate.
141
Meanwhile, compounds 13 and 14 were prepared in a series of concentration at 1, 0.5,
142
0.1, 0.05, and 0.01 mM. Two rapid in-situ visualization methods were applied here. The
9
first utilized UV fluorescence at excitation wavelengths of 254 nm and 365 nm. The
144
second utilized two different TLC visualization reagents. The general visualization
145
reagent contained 1% vanillin in ethanol with several drops of concentrated sulfuric
146
acid. The special visualization reagent for compounds with a phenolic hydroxyl group
147
was prepared with 3% FeCl3 dissolved in 0.5 M hydrochloric acid solution. Various
148
elution systems (DCM: MT= 10: 1, 15: 1, 20: 1, 30: 1 and 50: 1; PE: AT= 8: 2, 7: 3, 6:
149
4, 5: 5, and 4: 6) were conducted. The elution systems of DCM: MT= 20: 1 and PE:
150
AT= 6: 4 performed relatively high separation efficiency for 14 compounds in 1D TLC
151
separation. In order to achieve efficient separation, 2D TLC analysis through two
152
elution systems (DCM: MT at 20: 1 and PE: AT at 6: 4) was carried out. 1% acetic acid
153
in solution was produced in the DCM: MT system to improve the diffused zone shape.
154
2 µL of the mixture was loaded onto the bottom-right of thin liquid chromatography
155
plates (8×8 cm2) and eluted with DCM: MT= 20: 1 containing 1% acetic acid, then
156
rotated to the right and eluted with PE: AT= 6: 4. The time for 2D TLC separation was
157
about 5 min. The retention factor (Rf) value was calculated by measuring the location
158
of each spot (dc, distance from the origin of the plate to the center of the eluted spot)
159
and the distance from the origin to the solvent front (ds). The Rf value was calculated
160
from the dc/ds ratio. The color and LOD value for each sample were also recorded.
161
2.3 SERS detection after TLC separation 162
After 2D TLC separation, each spot of a citrus flavonoid from the final TLC plate
163
was stripped and put into microcentrifuge tubes with 100 μL methanol. After
10
centrifugation (3000 rpm, 2 min), the supernatant was evaporated under vacuum and
165
dissolved in 10 μL methanol in preparation for detection. The time for these procedures
166
was about 3 min. Meanwhile, the substrate method for SERS analysis reported in our
167
previous study was used here (Ma et al., 2016). In brief, 5 μL of Ag dendrites were
168
deposited onto a glass slide first and air-dried. Then, 2 μL of test sample solution was
169
deposited on the dried Ag for Raman measurement after drying. SERS detection was
170
performed on a DXR Raman microscope (HORIBA), facilitated with a 514 nm
171
excitation laser and a 50× objective confocal microscope (2 μm spot diameter and 5 cm
-172
1 spectral resolution). The measured condition for each sample was as follows: 3 mW
173
of laser power, 50 μm slit width for 10 s integration time. Five spots were chosen
174
randomly for each sample. SERS spectra were collected and analyzed through LabSpec
175
Application software and TQ Analyst software (v8.0, Thermo Fisher Scientific),
176
respectively. Data pre-processing algorithms through second-derivative transformation
177
and smoothing were employed to remove the baseline shift, reduce spectral noise, and
178
separate overlapping bands. Discriminant analysis of the SERS spectra was determined
179
by principal component analysis (PCA), obtained according to Ward’s algorithm within
180
1100-1800 cm-1. Partial least-squares (PLS) analysis was used to quantitative analysis
181
to predict the sample amount.
182
2.4 Validation of the TLC-SERS method 183
The PLS model was evaluated by correlation coefficient (R), root-mean-square error
184
of calibration (RMSEC), and the root-mean-square error of prediction (RMSEP). The
11
linear ranges were determined when R was above 0.9544, with different samples of
186
various concentrations distributed between 30–350 μM. The limit of quantitation (LOQ)
187
value was determined as the lowest concentration among the linear range, with the ratio
188
of 10: 3 to limit of detection (LOD) value. Recovery rates of the extraction and detection
189
method were obtained by analyzing known amounts of standard flavonoids (50 and 100
190
μM, respectively). Precision of detection was determined from the three batches at 50
191
and 100 μM flavonoid concentration, and expressed as RSD (%, relative standard
192
deviations).
193
2.5 HPLC-UV analysis of 14 citrus flavonoids 194
All the 14 compounds were dissolved in methanol at a final concentration of 1 mM
195
for the following HPLC analysis. The Ultimate 3000 Series HPLC system (Thermo
196
Scientific, USA) consisted of a double ternary gradient pump (DGP-3600), and an
auto-197
sampler (WPS-3000 SL/TSL). Instrument control and data processing were performed
198
with Chromeleon® 7. Ascentis RP-Amide reversed-phase HPLC column (15 cm×4.6
199
mm id, 3 μm) (Sigma-Aldrich, MO, USA) using gradient elution with the mobile phase
200
A: 75% water, 20% ACN and 5% THF; the mobile phase B: 50% water, 40% ACN and
201
10% THF (pH values of both mobile phases were adjusted to 3.00 using TFA) (Zheng
202
et al., 2015). The optimal elution gradient program was as follows: 0-5.0 min, 10-50%
203
B; 5.0-35.0 min, 50% B; 35.0-40.0 min, 100% B;and 40.0-45.0 min, 10% B followed
204
by a 5 min equilibrium time using the initial gradient between individual runswith 1
205
mL/min flow rate and 10 μL injection volume (Zheng et al., 2015). An equimolar
12
mixture of all 14 compounds at 50 μM was used for HPLC analysis. The UV-vis
207
scanning for these compounds were set from 190-500 nm using DAD detector. The
208
wavelength range was divided artificially into two parts, including band I (300-400 nm)
209
and band II (220-280 nm), caused by the cross-conjugate system with cinnamoyl group
210
and benzoyl group, respectively. Indeed, 280 nm and 330 nm are characteristic
211
absorbance wavelength for flavonoids. Here, calibration curves were constructed with
212
serial dilutions (0.1, 0.5, 1, 5, 10, 20, 40, 80 and 160 μM) for each component in the
213
test solutions under 280 nm for compounds 1-14.
214
2.6 Real sample preparation and detection using TLC-SERS and HPLC-UV 215
Three real samples (orange juice, fresh orange peel, and mice fecal sample fed with
216
compound 7) were prepared for TLC-SERS and HPLC-UV analysis. For the fresh
217
orange juice sample (sample 1), 1 mL of Gannan navel orange juice was taken for later
218
flavonoids extraction. An equivalent volume of methanol was added to dissolve and
219
extract flavonoids under ultrasonic bath (80 Hz, 10 min) for three times and combined.
220
After centrifugation (3000 rpm, 5 min), the supernatant was dried under vacuum, and
221
finally dissolved in 100 μL of methanol for further analysis. Using the same extraction
222
process, 1 g of orange peel (sample 2) and fecal sample from CF-1 male mice fed with
223
nobiletin supplementation (500 ppm) for 1 week (sample 3) were also used for
224
flavonoids extraction, which were finally dissolved in 100 μL methanol for further
225
analysis. For TLC-SERS analysis, the components of flavonoids contained in each
226
sample were analyzed by Rf value and SERS characteristic peaks, and the content was
13
calculated according to the standard curve in PLS analysis. For HPLC-UV analysis, the
228
qualitative and quantitative analysis were carried out based on the retention time,
UV-229
vis spectroscopy, and standard curve. The detection ability of TLC-SERS for
230
flavonoids in real samples was evaluated by comparing accuracy, standard variance,
231
and detection time with HPLC-UV.
232
2.7 Data analysis 233
All analyses for SERS and HPLC were performed in triplicate at least, and the results
234
were presented as means ± standard deviation of three independent experiments.
235
3 Results and discussion
236
3.1 TLC separation and analysis of 14 citrus flavonoids 237
3.1.1 Separation of citrus flavonoids on normal-phase TLC plate 238
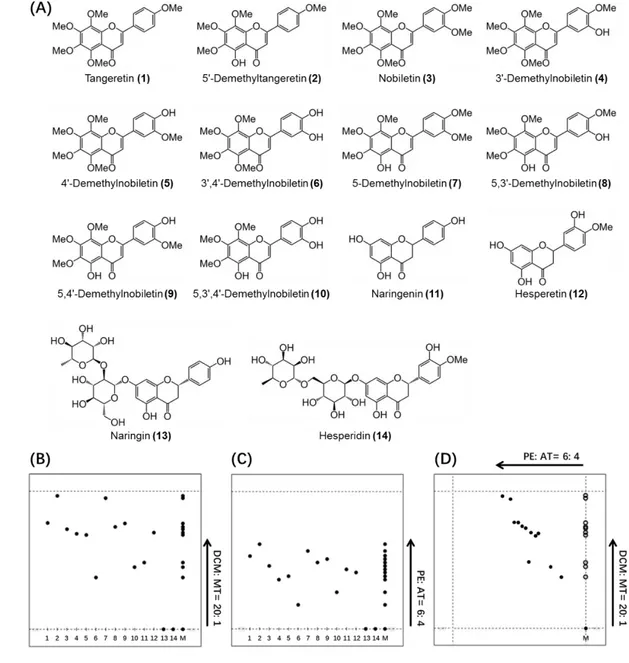
Were simultaneously separated 14 citrus flavonoids (Fig. 1A) on normal-phase TLC
239
plates, various elution systems were conducted initially as a screen. As a result, the
240
systems of DCM: MT at 20: 1 and PE: AT at 6: 4 were chosen as the optimal conditions
241
with relatively high separation efficiency. 1% acetic acid was produced in the DCM/MT
242
system to eliminate a slight observed tailing effect. Under this condition, the Rf values
243
of these citrus flavonoids were from 0 to 0.97 with the sequence as following: 2 (0.97)
244
≈ 7 (0.95) > 1 (0.77) ≈ 9 (0.77) > 8 (0.74) ≈ 3 (0.73) > 12 (0.70) ≈ 4 (0.69) ≈ 5
245
(0.68) > 11 (0.48) > 10 (0.45) > 6 (0.38) > 13 (0) ≈ 14 (0) (Table 1). The Rf values
246
could reflect the polarity of the compounds to a large extent, from which it could be
247
speculated that more hydroxyl functional groups present on the B ring, the more polar
14
it is relatively (6 vs 4 vs 3, 10 vs 8 vs 7, 5 vs 3, and 9 vs 7) (Wojtanowski & Mroczek,
249
2018; Hvattum & Ekeberg, 2003). Interestingly, the demethylation of the 5′ position
250
methoxyl made the compound more hydrophobic which might be due to the formation
251
of an intra-molecular hydrogen bond between the hydroxyl and the adjacent 4-ketone
252
carbonyl groups (2 vs 1, 7 vs 3, 8 vs 4, 9 vs 5, and 10 vs 6) (Wojtanowski & Mroczek,
253
2018). Although some could be separated significantly, compounds 2 and 7, 3 and 8, 1
254
and 9, as well as compounds 4, 5, and 12 could not be separated from each other
255
efficiently (Fig. 1B). Since the Rf value may vary in different elution systems, another
256
system composed of mixed aprotic solvents was also tested to achieve better separation.
257
Improved separation of compounds 2 (0.62) and 7 (0.57), 1 (0.53) and 9 (0.51), 3 (0.46)
258
and 8 (0.48), and 4 (0.36), 5 (0.38), and 12 (0.42) was achieved with the elution using
259
PE: AT= 6: 4 (Fig. 1C). However, it was still not efficient enough. Therefore, 2D-TLC
260
with the two elution systems above was further carried out. As a result, all compounds,
261
except compounds 13 and 14 could be separated efficiently and differentiated,
262
demonstrating the high efficiency of the 2D-TLC separation for simultaneous
263
separation of multiple citrus flavonoids (Fig. 1D).
264
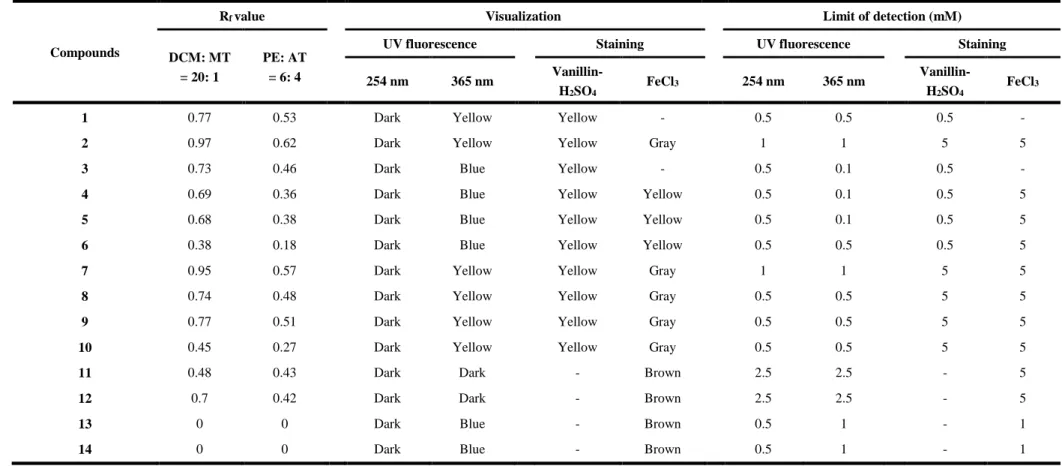
3.1.2 Visualization and LOD values of citrus flavonoids on TLC plate 265
UV fluorescence (254 nm and 365 nm) and visual staining (vanillin-H2SO4 and
266
FeCl3-HCl) were used here. All showed similar UV fluorescence response under 254
267
and 365 nm due to their shared flavonoid skeletal structure. As shown in Table 1, all
268
of the compounds exhibited the same inactivity under excitation at 254 nm, shown as a
15
dark spot. Under 365 nm excitation, flavonoids with C5-OMe on the A ring
270
(compounds 1, 3, 4, 5, and 6) and flavanone aglycones (compounds 13 and 14) reacted
271
as a bright spot, while the other flavonoids (compounds 2, 7, 8, 9, 10, 11 and 12)
272
exhibited no activity at the emissions screened as a dark spot. The LOD of the 14
273
compounds under 254 nm fluorescence ranged from 0.5 to 2.5 mM, while 0.1 to 2.5
274
mM under 365 nm. For visual staining, all the PMFs and OH-PMFs exhibited yellow
275
color, while flavanones cannot be detected by vanillin-H2SO4 stain. These results
276
demonstrated the necessity of CH=CH at C2 for differentiation. As shown in Table 1,
277
only flavonoids with hydroxyl groups could be detected by FeCl3 visual staining, and
278
the color was in proportion to the number and position of hydroxyl groups in the
279
polyphenol. Flavones with C5-OH exhibited darker color (compounds 2, 7-10 vs 4-6),
280
which indicated that the hydroxyl group at C5 site plays a major role in FeCl3 visual
281
staining. It might be attributed to the stronger reducing ability of hydroxyl group at C5
282
site. Compounds 13 and 14 had a lower LOD value (1 mM) under FeCl3 visual staining
283
compared to other compounds (5 mM), which might be due to the presence of more
284
hydroxyl groups. All the features could be used to identify and differentiate different
285
citrus flavonoids.
286
3.2 SERS qualitative and quantitative detection after TLC separation 287
3.2.1 Qualitative detection of citrus flavonoids by TLC-SERS 288
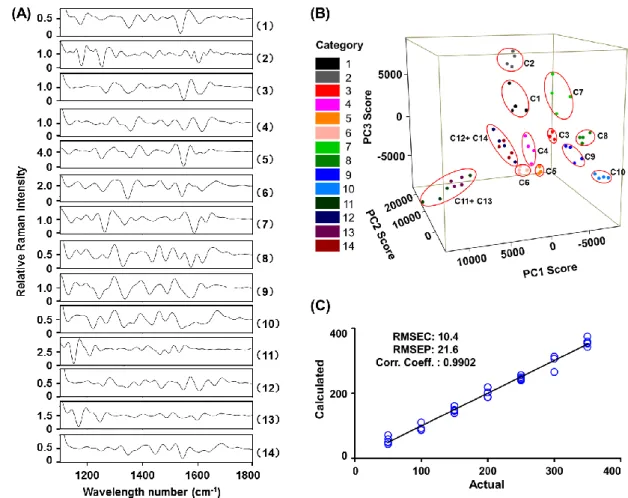
Second-derivative transformation was applied to average raw SERS spectra (N= 5)
289
to separate overlapping bands and remove baseline shifts, which makes characteristic
16
peaks in SERS spectra easily recognizable (Fig. 2A) (Ma et al., 2016; Zhang et al.,
291
2018; Zheng et al., 2013).In general, most of the citrus flavonoids showed similar
292
spectra below 1000 cm-1 owing to the similar skeletal structure. The characteristic peaks
293
were mainly at 1550-1650 cm-1 (assigned to C=O stretch) and 1100-1500 cm-1
294
(assigned to different O-H bend) (Table S1) (Huang & Chen, 2018; Sanchez-Cortes &
295
Garcia-Ramos, 2000; Zaffino, Bedini, Mazzola, Guglielmi & Bruni, 2016). In
296
accordance with chemical structures, the 14 flavonoids could be divided into four
297
categories as tangeretin analogs (compounds 1 and 2), nobiletin analogs (compounds
298
3-6), 5-demethylnobiletin analogs (compounds 7-10), and flavanone analogs
299
(compounds 11-14) through SERS spectra. The bands at 1650-1700 cm-1, contributed
300
from C(H)-C(H), could significantly distinguish the flavanones from the other three
301
analogs. The flavonoids with two substituent groups on their B ring possessed marked
302
bands at 1330-1430 cm-1, whichbelonged to OH bend (ip), C3′-OH and C4′-OH bend
303
(ip), and could differentiate nobiletin and 5-demethylnobiletin analogs from tangeretin
304
analogs. For tangeretin analogs, the 1542 cm-1 peak was mainly from the C=O stretch
305
in combination with ring quinoidal stretches of compound 1, with a 1577 cm-1 peak for
306
compound 2. The peaks of C-H bend could also be used to distinguish compounds 1
307
(1458 cm-1) and 2 (1443 and 1537 cm-1). Nobiletin analogs with a methoxyl group on
308
C5 had SERS bands at 1330-1350 cm-1 corresponded to the C-H bend (ip), and it could
309
be obviously distinguished from 5-demethylnobiletin analogs through bands at
1350-310
1375 cm-1 of OH bend (ip) C5 hydroxyl, as well as 1130-1150 cm-1 of 5-OH bend. The
17
appearance of bands at 1400-1450 cm-1 of C3′-OH and C4′-OH bend (ip) could be
312
considered as the characteristic peaks for each compound. For flavanone analogs, the
313
band at 1221 cm-1 belonged to v(C-H) of CH3 could be used to distinguish hesperetin
314
analogs (compounds 12 and 14) from naringenin analogs (compounds 11 and 13).
315
However, using SERS alone, it is difficult to differentiate glucosides and the
316
corresponding aglycones such as compounds 11/13 and 12/14, respectively. Due to the
317
working separation of TLC, an efficient detection was possible for all compounds
318
except 11/13 and 12/14 with the combination of TLC and SERS. PCA was further used
319
to verify the discrimination ability of SERS. The four kinds of analogs (tangeretin,
320
nobiletin, 5-demethylnobiletin, and flavanone analogs) clustered together (Fig. 2B).
321
The PCA results demonstrated that the potential capacity of SERS to distinguish
322
different citrus flavonoids even those of similar chemical structure.
323
3.2.2 Quantitative analysis of citrus flavonoids by TLC-SERS 324
During the quantitative analysis, the SERS signal intensity was observed to increase
325
along with the concentration from 30 to 350 μM. The peaks at 1604, 1636, 1553, 1559,
326
1555, 1546, 1631, 1620, 1629, 1609, 1126, 1550, 1131 and 1546 cm-1 were chosen for
327
LOQ and PLS analysis of compounds 1-14, respectively. As shown in Table 2, the
328
LOQ values for compounds 1-4 and 8 were 50 μM, which were slightly higher than the
329
other compounds (30 μM). Based on these, the LOD could be determined as about 16.7
330
μM for compounds 1-4 and 8, and 10 μM for the others, which were 6-500 times lower
331
than those determined by TLC visualization. The quantification ability of the method
18
was further investigated by PLS. The relationship between the predicted concentration
333
and actual concentration with R, RMSEC and RMSEP was found to be 0.9544-0.9962,
334
5.5-32.8 and 12.9-39.6, respectively. The relatively low value for RMSEC and RMSEP,
335
and high value for R (close to 1), demonstrated the reliability of SERS for quantitative
336
analysis using the PLS calibration curve based on the characteristic peaks (Fig. 2C). In
337
short, TLC-SERS detection had lower LOD values for flavonoids than other normal
338
TLC visualization methods. At the same time, fingerprinting was used prior to TLC for
339
qualitative analysis. With the combination of TLC and SERS, simultaneous separation
340
and detection of all the 14 citrus flavonoid analogs could be achieved. For TLC-SERS
341
method, recovery rates of the extraction and detection method ranged from 91.5 to
342
121.7 with RSD ≤ 20.8 for all 14 flavonoids at 50 and 100 μM (Table 2), indicating
343
that influences from extraction to quantitation was unneglectable, but still acceptable.
344
The precision was expressed as RSD between 1.5% and 11.8%, which demonstrated
345
the good reproducibility of the method established in this study. Additionally,
TLC-346
SERS showed the potential to be a rapid and efficient method for analysis of citrus
347
flavone analogs from complex matrices based on the efficient separation of TLC and
348
the high sensitivity of SERS.
349
3.3 HPLC-UV analysis of 14 citrus flavonoids 350
3.3.1 HPLC separation of citrus flavonoids 351
HPLC has been considered as the golden standard analytical method for a wide array
352
of chemical compounds. In order to evaluate the established TLC-SERS method, 14
19
citrus flavonoids were ran simultaneously on HPLC. As a result, all the compounds
354
could be separated under the tested elution gradient profile except for compounds 1 and
355
11 (Fig. 3A). Similar to Rf value, the retention time could also be used to speculate the
356
polarity of the 14 compounds. As one would expect, substituent groups including the
357
group type (hydroxyl or methoxyl group) and position (5-, 3′-, and/or 4′-position) had
358
an observed effect on the retention time. In general, demethylation increased the
359
polarity, and 3′-demethylation was more effective than 4′-demethylation (compounds
360
4/5 and 8/9). In addition, compounds became more polar after C3′H substitution by
-361
OMe (compounds 1/3). However, demethylation at C5 caused an obvious decrease of
362
the polarity, which might be due to the formation of an intra-molecular hydrogen bond
363
between hydroxyl and the adjacent 4-ketone carbonyl (2 vs 1, 7 vs 3, 8 vs 4, 9 vs 5, and
364
10 vs 6). The results were roughly consistent with TLC analysis, despite that the polarity
365
sequence of a few compounds were not coincident with each other. This might due to
366
the different absorption capacity between compounds and chromatographic matrix
367
(Eric, 2008). Quantitative analysis was also carried out via absorption at 280 nm. As
368
shown in Table S2, all the 14 citrus flavonoids had good linear relationships in the
369
range of 5-160 μM with R values higher than 0.9995. The LOD values were 1.5 μM for
370
compounds 7 and 10, and 0.3 μM for others, indicating higher sensitivity of HPLC for
371
the 14 flavonoids in contrast with TLC-SERS. Although various elution systems were
372
attempted, compounds 1 and 11 still could not be separated simultaneously.
373
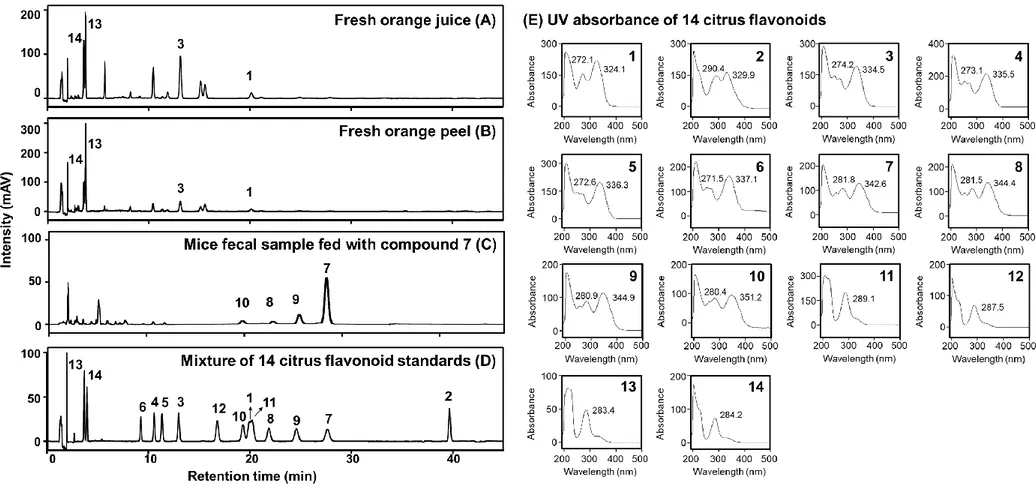
3.3.2 UV adsorption of 14 citrus flavonoids 374
20
The UV adsorption spectra from 190 nm to 500 nm were also investigated to
375
differentiate 14 citrus flavonoids (Fig. 3E). They could be divided artificially into two
376
parts: band I (300-400 nm) and band II (220-280 nm), which were caused by the
cross-377
conjugate system with the cinnamoyl group and benzoyl group, respectively. Generally,
378
both band I and II were exhibited in PMFs and OH-PMFs UV spectra, while only band
379
II was present for flavanones due to the lack of conjugation of cinnamoyl. In detail, the
380
higher the degree of oxygen substitution on ring B, the higher the red shift of band I (1,
381
2 vs 3-10). Substituents of -OH/-OMe made the band I red-shift which might due to the
382
p-π conjugation between the substituents and benzoyl. Furthermore, the
electron-383
donating effect of -OH was stronger than -OMe, as a result, red shift was also caused
384
by demethylation (4 vs 5 vs 6, and 7 vs 8 vs 9). However, the effects of demethylation
385
positions on the red-shift phenomena were different. Demethylation at C5 made band I
386
red shift the most, followed by 4′-demethylation, and then 3′-demethylation. As for
387
band II, 5-demethylation led to red shift while demethylation at 3′- and 4′- position led
388
to blue shift. Moreover, the band II changed from a single peak to cross peak if there
389
were two or more oxygen substitutions on ring B (1, 2 vs 3-10). For flavanone analogs,
390
band I disappeared due to the lack of cinnamoyl conjugation system. Thus, band II was
391
used as characteristic absorption band for PMFs UV analysis. Although the UV
392
absorption features differs from each other depending on the chemical structures, it is
393
difficult to be used for the identification of different compounds without standards. In
21
this respect, TLC-SERS might be preferred for the simultaneous analysis of flavonoids
395
in real samples.
396
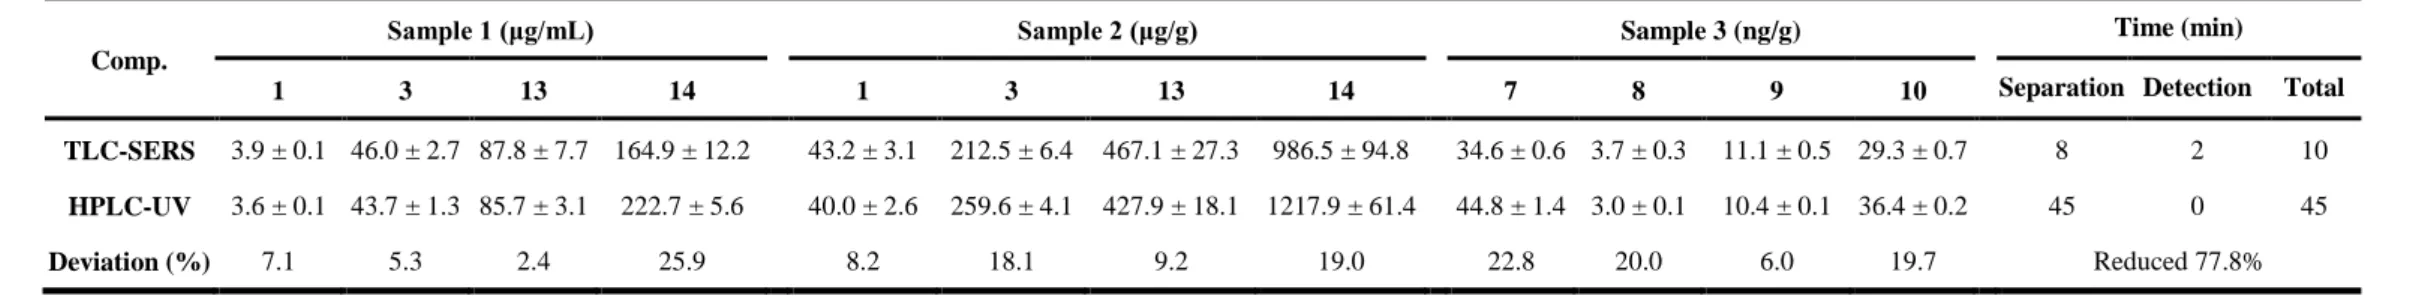
3.4 Determination of citrus flavonoids in real samples 397
Three real samples which might contain multiple citrus flavonoids were used here to
398
further evaluate the efficiency of the established TLC-SERS method. For orange juice
399
sample, the extracts were analyzed with 2D TLC according to the above conditions,
400
and three main spots were screened on TLC plates with similar Rf values to compounds
401
1, 3, 13/14 respectively. Then, the separated compounds were subjected to further
402
qualitative and quantitative analyses based on the SERS characteristic peaks and PLS
403
calibration curves. They were confirmed to be compounds 1, 3, 13 and 14 with the
404
contents of 3.9, 46.0, 87.8 and 169.4 μg/mL, respectively (Table 3), which were
405
consistent with a previous report for dried citrus peel extraction research (Zhang et al.,
406
2019).Similarly, compounds 1, 3, 13 and 14 were also detected in the orange peel
407
sample (sample 2) with the contents of 43.2, 212.5, 467.1 and 986.5 μg/g, respectively.
408
For sample 3, depending on the Rf value, four compounds were recognized and
409
determined to be compounds 7-10—the in vivo metabolites of 5-demethylnobiletin
410
(Zheng et al., 2013). The “fingerprint” information from SERS spectra further
411
confirmed the four components with the concentrations of 34.6, 3.7, 11.1, and 29.3 ng/g,
412
respectively. The citrus flavonoids contained in the three samples were also analyzed
413
through HPLC-UV. As shown in Table 3, the results were consistent with TLC-SERS
414
with a deviation within 2.4% and 25.9%, which indicated that the detection efficiency
22
of the established TLC-SERS method for citrus flavonoids was comparable to a
“gold-416
standard” analytical method, HPLC-UV. Considering that the total analytical time for
417
TLC-SERS was only about 10 minutes (5 min for TLC separation, 3 min for sample
418
recovery after TLC separation, and 2 min for SERS detection), but up to 45 minutes for
419
HPLC analysis, the TLC-SERS method established here could be a preferred method
420
for rapid, sensitive, and efficient simultaneous detection of citrus flavonoids or other
421
functional components from complex samples. This method could be applied for the
422
rapid, sensitive and efficient simultaneous detection of citrus flavonoids even other
423
components from real samples, for example functional components from fruits and
424
vegetables, the content and yield of functional components during extraction or
425
processing, and metabolites and health markers in biological experiments and so on.
426
4 Conclusion
427
In summary, TLC-SERS was established for simultaneous detection of 14 citrus
428
flavonoids for the first time. It was proven that 2D TLC eluted with DCM: MT at 20: 1
429
and PE: AT at 6: 4, could achieve efficient separation for most, if not all, of the target
430
compounds. SERS with “fingerprint” properties was further used to differentiate and
431
identify each compound after TLC separation. As a result, TLC-SERS was successfully
432
established to characterize and distinguish all the 14 citrus flavonoids with similar
433
chemical structures and physicochemical properties, which exhibited significantly
434
higher sensitivity (LOD values 10.0-16.7 μM) than TLC analysis (LOD values 0.1-5.0
435
mM). More importantly, the detection efficiency for citrus flavonoids from real samples
23
was comparable to HPLC with low deviation (2.4-25.9%). Along with short analytical
437
time, the TLC-SERS method established here could be a promising method to achieve
438
simultaneous, sensitive and accurate detection of flavonoids in real samples. It would
439
further advance the rapid and efficient determination of different flavonoids in citrus
440
industry, as well as other applications in functional foods.
441
Conflicts of interest
442
The authors declare no competing financial interest.
443
Acknowledgements
444
The authors would like to acknowledge the financial support provided by National
445
Natural Science Foundation of China (Nos. 31428017). We also appreciate the financial
446
support from Agricultural Science Innovation Program (S2019XK02) and Elite Youth
447
Program of Chinese Academy of Agricultural Sciences.
448
Supporting information
449
HPLC-UV quantitative results of 14 citrus flavonoids and their corresponding modes
450
of 14 citrus flavonoids on SERS spectra.
24
References
452
Chen, T., Su, W., Yan, Z., Wu, H., Zeng, X., Peng, W., Gan, L., Zhang, Y., & Yao, H.
453
(2018). Identification of naringin metabolites mediated by human intestinal
454
microbes with stable isotope-labeling method and UFLC-Q-TOF-MS/MS. Journal
455
of Pharmaceutical and Biomedical Analysis, 161, 262−272.
456
https://doi.org/10.1016/j.jpba.2018.08.039.
457
Chitturi, J. S., & Kannurpatti, S. (2019). Beneficial effects of kaempferol after
458
developmental traumatic brain injury is through protection of mitochondrial
459
function, oxidative metabolism, and neural viability. Journal of Neurotrauma, 36,
460
1264−1278.https://doi.org/10.1089/neu.2018.6100.
461
Cho, H. E., Su, Y. A., Sun, C. K., Mi, H. W., & Hong, J. T. (2014). Determination of
462
flavonoid glycosides, polymethoxyflavones, and coumarins in herbal drugs of
463
citrus and poncirus fruits by high performance liquid chromatography–electrospray
464
ionization/tandem mass spectrometry. Analytical Letters, 47, 1299−1323.
465
https://doi.org/10.1080/00032719.2013.871548.
466
Dai, W., Bi, J., Li, F., Wang, S., Huang, X., Meng, X., Sun, B., Wang, D., Kong, W.,
467
Jiang, C., & Su W. (2019) Antiviral efficacy of flavonoids against Enterovirus 71
468
infection in vitro and in newborn mice. Viruses, 11, 625−638.
469
https://doi.org/10.3390/v11070625.
470
Duan, L., Dou, L. L., Yu, K. Y., Guo, L., Baizhong, C., Li, P., & Liu, E. H. (2017).
471
Polymethoxyflavones in peel of Citrus reticulata 'Chachi' and their biological
25
activities. Food Chemistry, 234, 254−261.
473
https://doi.org/10.1016/j.foodchem.2017.05.018.
474
Eric, L. (2008). Overview of the retention in subcritical fluid chromatography with
475
varied polarity stationary phases. Journal of Separation Science, 31, 1238−1251.
476
https://doi.org/10.1002/jssc.200800057.
477
Fayek, N. M. F., M. A., Abdel, A. R., Moussa, M. Y., Abd-Elwahab, S. M., & Tanbouly,
478
N. D. (2019). Comparative metabolite profiling of four citrus peel cultivars via
479
ultra-performance liquid chromatography coupled with
quadrupole-time-of-flight-480
mass spectrometry and multivariate data analyses. Journal of Chromatographic
481
Science, 57, 349−360.https://doi.org/10.1093/chromsci/bmz006.
482
Germinario, G., Garrappa, S., Dambrosio, V., Werf, I. D. V. D., & Sabbatini, L. (2018).
483
Chemical composition of felt-tip pen inks. Analytical and Bioanalytical Chemistry,
484
410, 1079−1094.https://doi.org/10.1007/s00216-017-0687-x.
485
Han, S., Kim, H. M., & Lee, S. (2012). Simultaneous determination of
486
polymethoxyflavones in Citrus species, Kiyomi tangor and Satsuma mandarin, by
487
high performance liquid chromatography. Food Chemistry, 134, 1220−1224.
488
https://doi.org/10.1016/j.foodchem.2012.02.187.
489
Huang, C. C., & Chen, W. (2018). A SERS method with attomolar sensitivity: a case
490
study with the flavonoid catechin. Mikrochimica Acta, 185, 120−128.
491
https://doi.org/10.1007/s00604-017-2662-9.
492
Hvattum, E., & Ekeberg, D. (2003). Study of the collision-induced radical cleavage of
26
flavonoid glycosides using negative electrospray ionization tandem quadru-pole
494
mass spectrometry. Journal of Mass Spectrometry, 38, 43−49.
495
https://doi.org/10.1002/jms.398.
496
Kenji, O., Natsumi, H., Tai-Ichi, S., & Toshihiko, H. (2013). Polymethoxyflavonoids
497
tangeretin and nobiletin increase glucose uptake in murine adipocytes.
498
Phytotherapy Research, 27, 312−316.https://doi.org/10.1002/ptr.4730.
499
Li, S., Hong, W., Guo, L., Hui, Z., & Ho, C. T. (2014). Chemistry and bioactivity of
500
nobiletin and its metabolites. Journal of Functional Foods, 6, 2−10.
501
https://doi.org/10.1016/j.jff.2013.12.011.
502
Li, S., Lo, C. Y., & Ho, C. T. (2006). Hydroxylated polymethoxyflavones and
503
methylated flavonoids in sweet orange (Citrus sinensis) peel. Journal of
504
Agricultural & Food Chemistry, 54, 4176−4185.https://doi.org/10.1021/jf060234n.
505
Li, S., Pan, M. H., Lai, C. S., Lo, C. Y., Slavik, D., & Ho, C. T. (2007). Isolation and
506
syntheses of polymethoxyflavones and hydroxylated polymethoxyflavones as
507
inhibitors of HL-60 cell lines. Bioorganic and Medicinal Chemistry, 15,
508
3381−3389.https://doi.org/10.1016/j.bmc.2007.03.021.
509
Lin, S. P., Hou, Y. C., Tsai, S. Y., Wang, M. J., & Chao, P. D. L. (2014). Tissue
510
distribution of naringenin conjugated metabolites following repeated dosing of
511
naringin to rats. BioMedicine, 4, 1−6. https://doi.org/10.7603/s40681-014-0016-z.
512
Lin, Y. S., Li, S., Ho, C. T., & Lo, C. Y. (2012). Simultaneous analysis of six
513
polymethoxyflavones and six 5-hydroxy-polymethoxyflavones by high
27
performance liquid chromatography combined with linear ion trap mass
515
spectrometry. Journal of Agricultural & Food Chemistry, 60, 12082−12087.
516
https://doi.org/10.1021/jf303896q.
517
Liu, Z., Han, Y., Zhao, F., Zhao, Z., Tian, J., & Jia, K. (2019). Nobiletin suppresses
518
high-glucose-induced inflammation and ECM accumulation in human mesangial
519
cells through STAT3/NF-κB pathway. Journal of Cellular Biochemistry 120,
520
3467−3473.https://doi.org/10.1002/jcb.27621.
521
Ma, C., Xiao, H., & He, L. (2016). Surface-enhanced Raman scattering characterization
522
of monohydroxylated polymethoxyflavones: SERS behavior of monohydroxylated
523
polymethoxyflavones. Journal of Raman Spectroscopy, 47, 901−907.
524
https://doi.org/10.1002/jrs.4932.
525
Meier, B., & Spriano, D. (2010). Modern HPTLC–a perfect tool for quality control of
526
herbals and their preparations. Journal of AOAC International, 93, 1399−1409.
527
https://doi.org/10.1093/jaoac/93.5.1399.
528
Mikropoulou, E. V., Petrakis, E. A., Argyropoulou, A., Mitakou, S., Halabalaki, M.,
529
Skaltsounis, L. A. (2019). Quantification of bioactive lignans in sesame seeds using
530
HPTLC densitometry: Comparative evaluation by HPLC-PDA. Food Chemistry,
531
288, 1−7.https://doi.org/10.1016/j.foodchem.2019.02.109.
532
Oellig, C., Schunck, J., & Schwack, W.Determination of caffeine, theobromine and
533
theophylline in Mate beer and Mate soft drinks by high-performance thin-layer
534
chromatography. Journal of Chromatography A, 1533, 208−212.
28 https://doi.org/10.1016/j.chroma.2017.12.019.
536
Reguera, J., Langer, J., Jimenez, A. D., & Liz-Marzan, L. M. (2017). Anisotropic metal
537
nanoparticles for surface enhanced Raman scattering. Chemical Society Reviews,
538
46, 3866−38856.https://doi.org/10.1039/c7cs00158d.
539
Sanchez-Cortes, S., & Garcia-Ramos, J. V. (2000). Adsorption and chemical
540
modification of phenols on a silver surface. Journal of Colloid and Interface
541
Science, 231, 98−106.https://doi.org/10.1006/jcis.2000.7101.
542
Sayuri, I. T., Suwa, R., Fukuzawa, Y., & Kawamitsu, Y. (2011). Polymethoxyflavones,
543
synephrine and volatile constitution of peels of citrus fruit grown in Okinawa.
544
Japanese Society for Horticultural Science, 80, 214−224.
545
https://doi.org/10.2503/jjshs1.80.214.
546
Stremple, P. (2015). GC/MS analysis of polymethoxyflavones in citrus oils. Journal of
547
Separation Science, 21, 587−591.
https://doi.org/10.1002/(SICI)1521-548
4168(19981101)21:11<587::AID-JHRC587>3.0.CO;2-P.
549
Sundaram, R., Shanthi, P., & Sachdanandam, P. (2015). Tangeretin, a polymethoxylated
550
flavone, modulates lipid homeostasis and decreases oxidative stress by inhibiting
551
NF-κB activation and proinflammatory cytokines in cardiac tissue of
552
streptozotocin-induced diabetic rats. Journal of Functional Foods, 16, 315−333.
553
https://doi.org/10.1016/j.jff.2015.03.024.
554
Surichan, S., Arroo, R. R., Ruparelia, K., Tsatsakis, A. M., & Androutsopoulos, V. P.
555
(2018). Nobiletin bioactivation in MDA-MB-468 breast cancer cells by
29
cytochrome P450 CYP1 enzymes. Food & Chemical Toxicology, 113, 228−235.
557
https://doi.org/10.1016/j.fct.2018.01.047.
558
Wen, L., & Lu, X. (2016). Determination of chemical hazards in foods using
surface-559
enhanced Raman spectroscopy coupled with advanced separation techniques.
560
Trends in Food Science & Technology, 54, 103−113.
561
https://doi.org/10.1016/j.tifs.2016.05.020.
562
Wojtanowski, K. K., Mroczek, T. (2018). Study of a complex secondary metabolites
563
with potent anti-radical activity by two dimensional TLC/HPLC coupled to
564
electrospray ionization time-of-flight mass spectrometry and bioautography.
565
Analytica Chimica Acta, 1029, 104−115. https://doi.org/10.1016/j.aca.2018.03.066. 566
Zaffino, C., Bedini, G. D., Mazzola, G., Guglielmi, V., & Bruni, S. (2016). Online
567
coupling of high-performance liquid chromatography with surface-enhanced
568
Raman spectroscopy for the identification of historical dyes. Journal of Raman
569
Spectroscopy, 47, 607−615.https://doi.org/10.1002/jrs.4867.
570
Zhang, H., Cui, J., Tian, G., Christina, D. C., Gao, W., Zhao, C., Li, G., Lian, Y., Xiao,
571
H., & Zheng, J. (2019). Efficiency of four different dietary preparation methods in
572
extracting functional compounds from dried tangerine peel. Food Chemistry, 289,
573
340−350.https://doi.org/10.1016/j.foodchem.2019.03.063.
574
Zhang, Y., Zhao, C., Tian, G., Lu, C., Li, Y., He, L., Xiao, H., & Zheng, J. (2018).
575
Simultaneous characterization of chemical structures and bioactivities of
citrus-576
derived components using SERS barcodes. Food Chemistry, 240, 743−750.
30
https://doi.org/10.1016/j.foodchem.2017.07.103.
578
Zhao, Z. H., S.; Hu, Y.; Yang, Y.; Jiao, B.; Fang, Q., & Zhou, Z. (2017). Fruit flavonoid
579
variation between and within four cultivated citrus species evaluated by
UPLC-580
PDA system. Scientia Horticulturae, 224, 93−101.
581
https://doi.org/10.1016/j.scienta.2017.05.038.
582
Zheng, J., Bi, J., Johnson, D., Sun, Y., Song, M., Qiu, P., Dong, P., Decker, E., & Xiao,
583
H. (2015). Analysis of 10 metabolites of polymethoxyflavones with high sensitivity
584
by electrochemical detection in high-performance liquid chromatography. Journal
585
of Agricultural & Food Chemistry, 63, 509−516.https://doi.org/10.1021/jf505545x.
586
Zheng, J., Fang, X., Cao, Y., Xiao, H., & He, L. (2013). Monitoring the chemical
587
production of citrus-derived bioactive 5-demethylnobiletin using surface enhanced
588
Raman spectroscopy. Journal of Agricultural & Food Chemistry, 61, 8079−8083.
589
https://doi.org/10.1021/jf4027475.
590
Zheng, J., & He, L. (2014). Surface-enhanced Raman spectroscopy for the chemical
591
analysis of food. Comprehensive Reviews in Food Science & Food Safety, 13,
592
317−328.https://doi.org/10.1111/1541-4337.12062.
593
Zheng, J., Song, M., Dong, P., Qiu, P., Guo, S., Zhong, Z., Li, S., Ho, C. T., & Xiao, H.
594
(2013). Identification of novel bioactive metabolites of 5-demethylnobiletin in
595
mice. Molecular Nutrition & Food Research, 57, 1999−2007.
596
https://doi.org/10.1002/mnfr.201300211.
597
Zhu, Q., Chen, M., Han, L., Yuan, Y., & Lu, F. (2017). High efficiency screening of
31
nine lipid-lowering adulterants in herbal dietary supplements using thin layer
599
chromatography coupled with surface enhanced Raman spectroscopy. Analytical
600
Methods, 9, 1595−1603.https://doi.org/10.1039/C6AY03441A.
32
Figure captions
602
Fig. 1 (A) Chemical structures of 14 major citrus flavonoids; (B) TLC separation eluted
603
with DCM: MT= 20: 1 containing 1% acetic acid; (C) TLC separation eluted
604
with PE: AT= 6: 4; (D) 2D separation eluted with DCM: MT= 20: 1 containing
605
1% acetic acid and PE: AT= 6: 4 subsequently (Rf, retardation factor value;
606
DCM, dichloride methylene; MT, methanol; PE, petroleum ether; AT, acetone;
607
M, mixtures of compounds 1-14).
608
Fig. 2 SERS analysis (1100-1800 cm-1) after TLC separation of 14 citrus flavonoids.
609
(A) The second-derivative SERS spectra; (B) PCA discrimination; (C) PLS
610
analysis (compound 3 as an example).
611
Fig. 3 HPLC profiles (UV detector, 280 nm) offresh orange juice sample (A), fresh
612
orange peel sample (B), mice fecal sample fed with compound 7 (C) and mixture
613
of 14 citrus flavonoid standards (D), and UV absorbance (190-500 nm) of 14
614
citrus flavonoids after HPLC separation (E).
615
Table 1 Rf value, visualization color and limit of detection of 14 citrus flavonoids on
616
TLC plate (Rf, retardation factor value; DCM, dichloride methylene; MT,
617
methanol; PE, petroleum ether; AT, acetone).
618
Table 2 Limit of quantitation, linearity, recovery rate and detection accuracy of
TLC-619
SERS analysis for 14 citrus flavonoids.
620
Table 3 Determination of citrus flavonoids in three real samples using TLC-SERS and
621
HPLC-UV methods (fresh orange juice sample, fresh orange peel sample, and
622
mice fecal sample fed with compound 7, respectively).
33
624
Fig. 1 (A) Chemical structures of 14 major citrus flavonoids; (B) TLC separation eluted
625
with DCM: MT= 20: 1 containing 1% acetic acid; (C) TLC separation eluted
626
with PE: AT= 6: 4; (D) 2D separation eluted with DCM: MT= 20: 1 containing
627
1% acetic acid and PE: AT= 6: 4 subsequently (Rf, retardation factor value;
628
DCM, dichloride methylene; MT, methanol; PE, petroleum ether; AT, acetone;
629
M, mixtures of compounds 1-14).
34
631
Fig. 2 SERS analysis (1100-1800 cm-1) after TLC separation of 14 citrus flavonoids.
632
(A) The second-derivative SERS spectra; (B) PCA discrimination; (C) PLS
633
analysis (compound 3 as an example).
35
Fig. 3 HPLC profiles (UV detector, 280 nm) of fresh orange juice sample (A), fresh orange peel sample (B), mice fecal sample fed with compound
635
7 (C) and mixture of 14 citrus flavonoid standards (D), and UV absorbance (190-500 nm) of 14 citrus flavonoids after HPLC separation
636
(E).
36
Table 1 Rf value, visualization color and limit of detection of 14 citrus flavonoids on TLC plate(Rf, retardation factor value; DCM, dichloride
638
methylene; MT, methanol; PE, petroleum ether; AT, acetone).
639
Compounds
Rf value Visualization Limit of detection (mM)
DCM: MT = 20: 1
PE: AT = 6: 4
UV fluorescence Staining UV fluorescence Staining
254 nm 365 nm Vanillin-H2SO4 FeCl3 254 nm 365 nm Vanillin-H2SO4 FeCl3
1 0.77 0.53 Dark Yellow Yellow - 0.5 0.5 0.5 -
2 0.97 0.62 Dark Yellow Yellow Gray 1 1 5 5
3 0.73 0.46 Dark Blue Yellow - 0.5 0.1 0.5 -
4 0.69 0.36 Dark Blue Yellow Yellow 0.5 0.1 0.5 5
5 0.68 0.38 Dark Blue Yellow Yellow 0.5 0.1 0.5 5
6 0.38 0.18 Dark Blue Yellow Yellow 0.5 0.5 0.5 5
7 0.95 0.57 Dark Yellow Yellow Gray 1 1 5 5
8 0.74 0.48 Dark Yellow Yellow Gray 0.5 0.5 5 5
9 0.77 0.51 Dark Yellow Yellow Gray 0.5 0.5 5 5
10 0.45 0.27 Dark Yellow Yellow Gray 0.5 0.5 5 5
11 0.48 0.43 Dark Dark - Brown 2.5 2.5 - 5
12 0.7 0.42 Dark Dark - Brown 2.5 2.5 - 5
13 0 0 Dark Blue - Brown 0.5 1 - 1
14 0 0 Dark Blue - Brown 0.5 1 - 1
37
Table 2 Limit of quantitation, linearity, recovery rate and detection accuracy of TLC-SERS analysis for 14 citrus flavonoids.
641
Linearity Recovery rate Precision
50 μM 100 μM 50 μM 100 μM Comp. LOD (μM) Conc. range (μM) RMSEC RMSEP Correlation coefficient Recovery rate RSD (%) Recovery rate RSD (%) RSD (%) RSD (%) 1 16.7 50−200 14.3 31.2 0.9690 113.4 12.7 100.4 2.5 11.8 6.4 2 16.7 50−350 20.0 39.6 0.9859 107.2 15.4 112.5 7.9 7.6 8.9 3 16.7 50−350 10.4 21.6 0.9902 121.7 12.6 104.8 3.2 6.9 7.0 4 16.7 50−350 32.8 34.0 0.9546 107.7 3.9 96.5 5.7 6.6 7.2 5 10 30−200 5.5 19.6 0.9960 110.9 14.7 105.3 15.8 1.5 6.8 6 10 30−300 19.9 17.9 0.9821 106.1 20.8 113.2 1.8 6.0 4.3 7 10 30−350 19.4 25.8 0.9877 102.9 19.9 97.4 15.0 5.7 9.2 8 16.7 50−200 17.4 36.6 0.9545 91.5 8.0 98.5 4.3 6.5 9.6 9 10 30−150 11.6 27.6 0.9544 114.8 1.4 94.2 13.6 4.6 6.6 10 10 30−300 16.6 26.6 0.9879 111.0 17.6 117.3 8.3 8.9 5.0 11 10 30−300 9.3 12.9 0.9962 110.5 18.9 95.6 7.3 2.5 5.5 12 10 30−250 9.8 18.8 0.9940 118.7 12.1 99.2 15.4 9.2 5.8 13 10 30−300 17.6 18.8 0.9862 102.0 9.6 102.8 5.2 6.7 6.5 14 10 30−300 17.7 13.1 0.9851 116.6 18.3 104.8 7.9 8.6 9.0 642
38
Table 3 Determination of citrus flavonoids in three real samples using TLC-SERS and HPLC-UV methods (fresh orange juice sample, fresh orange peel sample,
643
and mice fecal sample fed with compound 7, respectively).
644
645
Comp.
Sample 1 (μg/mL) Sample 2 (μg/g) Sample 3 (ng/g) Time (min)
1 3 13 14 1 3 13 14 7 8 9 10 Separation Detection Total
TLC-SERS 3.9 ± 0.1 46.0 ± 2.7 87.8 ± 7.7 164.9 ± 12.2 43.2 ± 3.1 212.5 ± 6.4 467.1 ± 27.3 986.5 ± 94.8 34.6 ± 0.6 3.7 ± 0.3 11.1 ± 0.5 29.3 ± 0.7 8 2 10
HPLC-UV 3.6 ± 0.1 43.7 ± 1.3 85.7 ± 3.1 222.7 ± 5.6 40.0 ± 2.6 259.6 ± 4.1 427.9 ± 18.1 1217.9 ± 61.4 44.8 ± 1.4 3.0 ± 0.1 10.4 ± 0.1 36.4 ± 0.2 45 0 45