HAL Id: hal-00917950
https://hal.inria.fr/hal-00917950
Submitted on 12 Dec 2013
HAL is a multi-disciplinary open access
archive for the deposit and dissemination of
sci-entific research documents, whether they are
pub-lished or not. The documents may come from
teaching and research institutions in France or
L’archive ouverte pluridisciplinaire HAL, est
destinée au dépôt et à la diffusion de documents
scientifiques de niveau recherche, publiés ou non,
émanant des établissements d’enseignement et de
recherche français ou étrangers, des laboratoires
Emmanuel Riou, Erven Rohou, Philippe Clauss, Nabil Hallou, Alain Ketterlin. PADRONE: a
Plat-form for Online Profiling, Analysis, and Optimization. DCE 2014 - International workshop on Dynamic
Compilation Everywhere, Jan 2014, Vienne, Austria. �hal-00917950�
A
PADRONE: a Platform for Online Profiling, Analysis, and Optimization
Emmanuel Riou, Inria Erven Rohou, Inria
Philippe Clauss, Universit´e de Strasbourg, Inria Nabil Hallou, Inria
Alain Ketterlin, Universit´e de Strasbourg, Inria
PADRONE is new platform for dynamic binary analysis and optimization. It provides an API to help clients design and develop analysis and optimization tools for binary executables. PADRONE attaches to running applications, only needing the executable binary in memory. No source code or debug information is needed. No application restart is needed either. This is specially interesting for legacy or commercial applications, but also in the context of cloud deployment, where actual hardware is unknown, and other applications competing for hardware resources can vary. We describe the infrastructure of PADRONE, and show that its profiling overhead is minimal. We illustrate its use through two examples. In the first one, we show how we measure the performance of the hotpot of benchmark. In the second one, we replace the hotspot of a function by an optimized version, while the program runs. We believe PADRONE fits an empty design point in the ecosystem of dynamic binary tools.
1. INTRODUCTION
Most of the studies on automatic code optimization have focused on source-to-source transformation tools. Sophisticated techniques have been developed for some classes of programs, and rapid progress is made in the field. However, there is a persistent hiatus between software vendors having to distribute generic programs, and end-users running them on a variety of hardware platforms, with varying levels of optimization opportunities. The next decade may well see an increasing variety of hardware, as it has already started to appear particularly in the embedded systems market. At the same time, one can expect more and more architecture-specific automatic optimization techniques.
Moreover, many “old” executables are still being used although they have been orig-inally compiled for now outdated processor chips. Although most current processors are ensuring backward compatibility, these codes are obviously not taking advantage of new computing resources that appeared in recent processor chips.
All this argues for binary-to-binary optimizing transformations enabling to take ad-vantage of current computing resources when re-compiling source codes cannot be con-sidered. Such transformations can be applied either statically, i.e., before executing the target code, or dynamically, i.e., while the target code is running.
Dynamic optimization is mostly addressing adaptability to various architectures and execution environments. When deploying an application in the cloud, the executable file may be handled by various processor architectures providing varying levels of opti-mization opportunities. Anticipating numerous different adapted binary versions can-not be a general solution. Acan-nother point is related to interactions between applications sharing common hardware, where adaptation may be required to adapt to the varying availability of the resources. Finally, most code optimizations have a basic cost that has to be overcome by the gain they provide. Depending on the input data processed by the target code, an optimizing transformation may be or not profitable. One may argue about the use of programming language virtual machines as an alternative answer to these issues. However, this would enforce the re-writing of every program, while exe-cution time performance is generally more difficult to address with virtual machines, compared to native binary code.
Fig. 1. Analysis and Optimization with PADRONE
In this paper, we show some recent progresses in profiling and analyzing running executable codes using our software framework that can be attached to any running process, in order to collect relevant information or to switch the control flow to some op-timized code version. The analysis is run as a separated process, thus minimizing the instrumentation overhead. As an optimization example, we use our tools to automat-ically substitute binary code which has been originally vectorized for SSE processor units with AVX code. Since the main difference is related to the size of the vector reg-isters (from 128 bits in SSE to 256 bits in AVX), such a code transformation potentially doubles the speed-up due to vectorization.
2. INFRASTRUCTURE 2.1. General Presentation
PADRONE is a library that provides an API. Clients developed with PADRONE are, in spirit, similar to gdb. A user can attach to an already running process, set breakpoints, define callbacks. After the process has been operated upon, PADRONE can detach and let the process run at full speed. The advantage of such an operating mode is the ability to leave the bulk of the analysis (or optimization) work to a different process. On a multicore system, the target process and PADRONE-initiated processes are likely to be scheduled by the operating system on distinct cores.
PADRONE is designed to work in a production environment, i.e., it makes absolutely no assumption about the running program: no debug information is needed, the run-ning program can be stripped (and have no symbol table). Of course, no source code is needed, since PADRONE must be able to handle legacy applications in whatever shape they are available. The PADRONE framework assumes access only to the application binary file and memory space of the process.
PADRONE works on Gnu/Linux systems, and thus takes advantage of existing Linux mechanisms, including the perf event subsystem, the ptrace system call, the virtual /proc file system, or the ELF executable format, as detailed in the following sections. Currently PADRONE aims at optimizing x86 applications, although in the future the framework may evolve and work on other types of processors.
As Figure 1 shows, a typical PADRONE application proceeds in three steps. The first step is profiling. The idea is to observe the running process to see for instance where it spends most of its CPU time, or where some statistics of interest (e.g., IPC, cache misses, etc.) have unexpected values. The second step is the analysis. From the data collected during step one, critical functions and loops can be identified. If needed, a code cache is also created during this step. The code cache is created in the target process address space, and lets PADRONE inject additional or optimized code. The third and last step, the optimization, is usually external to the PADRONE core library, and implemented as separate user code, or even as a separate process (for instance by
A:3
invoking a compiler). Typically, this step creates an optimized version of some code of the application (e.g., hot spots identified during the profiling step). This new code is then injected into the code cache in the target process address space, to be run there and complement or replace the process’ own code. Note that a PADRONE client can repeat the profiling-analysis-optimization cycle as many times as necessary.
PADRONE is actually a toolbox to perform dynamic code modifications. It provides an API which can be used by third party applications to perform specific optimizations. The platform integrates three steps that are usually performed separately, typically with different tools. Sections 3.2 and 3.3 give several examples of PADRONE clients for on-line profiling and optimization tasks. The rest of this section describes the major components of PADRONE.
2.2. Profiling (Linux perf event subsystem)
PADRONE provides a profiling functionality, which is the usual first step if no infor-mation is available on the running process. It could happen that a user already knows what are the hotspots of a program, in which case that step can be skipped.
The profiling step is useful to measure where the program spends most of its CPU time. Indeed, one of the major goals of PADRONE is to identify the process hotspots, rather than trying to blindly optimize the complete running process. A statistical pro-filing is obtained by sampling the state of the running process, typically by probing the program counter of the running process at regular intervals. Each probe provides a sample, and each sample includes the IP (instruction pointer) and a call-chain. The handling of that list of samples is left to the analysis step, for instance to figure out the functions to which these IPs belong, and select the critical functions.
To perform the profiling, PADRONE uses the Linux perf event subsystem kernel interface which appeared in Linux version 2.6.31. That kernel interface has been ini-tially created for the perf profiling tool, which is shipped with the kernel sources. The interface is based on performance counters: any modern processor now includes a PMU (Performance Monitoring Unit) which can be configured via dedicated registers to mon-itor specific hardware events. The actual values are read in other dedicated registers. Those registers (performance counters) can be used to measure for instance the num-ber of executed instructions, numnum-ber of cycles, numnum-ber of cache misses, numnum-ber of branch mispredictions, etc. The kernel interface manages the configuration and read-ing of the registers, and provides a system call called sys_perf_event_open to actually initialize a performance counter. The system call takes as parameter a data structure that indicates what kind of events we want to monitor, for which process (PID),1and whether we want to monitor the whole system or only a specific CPU (in that case a CPU id is passed).
Another important piece of information is the profiling mode, which can be either a counting mode or a sampling mode, as discussed later.2 The call returns a file
de-scriptor from which the client can directly read requested values (e.g. the number of branch mispredictions for a specific process on CPU0). This is the basic mode, or the counting mode. In this mode, it is up to the programmer to decide when to read the values, either on a regular basis or only when the client needs the information.
PADRONE uses the sampling mode in most cases. This mode is dynamic: the in-terface is configured to receive an interrupt every x occurrences of the event we are interested in. The consequence is that there is something to read on the associated
1Permission rights apply: if PADRONE is launched as non-privileged user, only their processes can be
mon-itored.
2
An example is available with the manual page of the system call, available at http://www.man7.org/linux/ man-pages/man2/perf_event_open.2.html
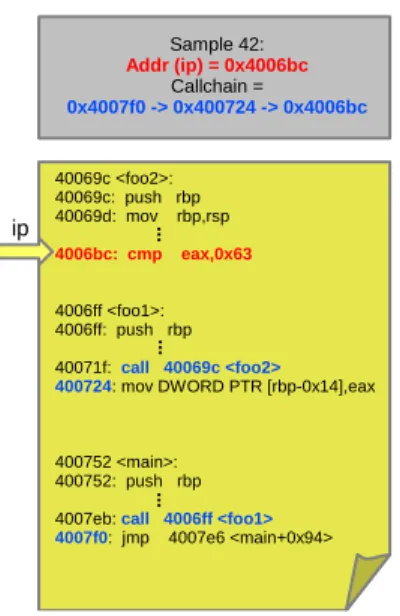
Fig. 2. Profiling sample including a call-chain
file descriptor: that mode can be then easily managed using a poll, or a select. Each time an interruption is raised, a sample is produced including the instruction pointer and call chain at the time the event occurred. Typically, PADRONE’s profiling step uses a PERF_COUNT_HW_CPU_CYCLE type performance counter, in sampling mode: it is therefore informed of the state of the target process every x cycles. Another op-tion of the sampling mode lets one give a frequency, for instance requesting to get at most 1000 samples per second (instead of a sample every x cycles). In this sampling mode, samples are stored by the kernel in a circular buffer. The client gets access to it by mapping (with mmap) the performance counter related file descriptor returned by sys_perf_event_open.
As mentioned, a sample contains the call chain related to the included instruction pointer. Consider the example of Figure 2. The last address of the call chain is the address (ip) of the sample (0x4006bc), and the address just before (0x400724) is the address of the call (the call chain actually provides the return address). The call tar-gets function foo2 where the ip of the sample is. This is how PADRONE retrieves the address of function foo2 (0x40069c), which will be very important for the analysis step. Section 3.1 gives a detailed account of the overhead incurred during the profiling phase, for various values of profiling duration and event frequency.
2.3. Analysis (Finding Critical Functions)
Once the profiling phase is done, PADRONE has a list of instructions pointers avail-able for further analysis. The relative frequencies of occurrence of the addresses give an indication of where the “hottest regions” of the code are. Individual instruction pointers are moderately useful however, most optimization opportunities targeting coarser-grain structures, like functions and loops. PADRONE provides support for both. This sections illustrates function-level analysis.
Indeed functions are often the most convenient abstractions, since they are delim-ited pieces of code activated by a special instruction (call instruction on x86). Conse-quently, it is easy enough to substitute a function by another one. A basic feature of the PADRONE framework is to substitute a critical function with an optimized one, and make sure the optimized version is called instead of the original one. Given an
A:5
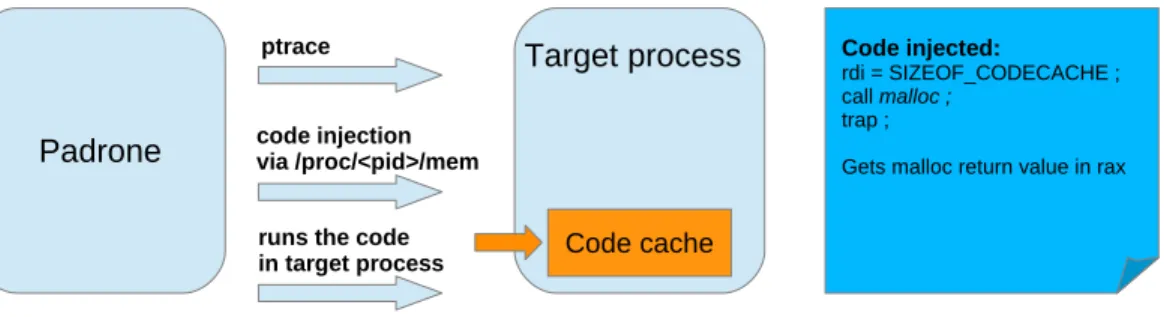
Fig. 3. Code cache creation in target process
instruction pointer, PADRONE is able to detect the containing function. Given profile data, a typical pre-processing step consists in replacing individual instruction pointers with function addresses. This often removes unneeded details, providing data at the right level of abstraction.
However, figuring out the limits of a function is not as easy as it seems. PADRONE can only rely on the binary code of the process (read directly from process address space using /proc/<pid>/mem), with no symbol table or debug information. Even though the entry point of the function is found in the call chain associated with every sample, find-ing the “bottom end” is much more complicated. Function calls end with ret instruc-tions on x86, but these can appear anywhere, once or more times, inside the function body.3A naive linear scanning of the code is clearly insufficient.
Control Flow Graph (CFG).A solution to that function’s limit issue is to build a Con-trol Flow Graph (CFG). The assembly code is used as an intermediate representation of the binary code and the CFG has to be built from this code only. Starting from the address of the first instruction of the function, binary code is disassembled and basic blocks are built along the way. PADRONE follows all possible control flow paths until reaching a ret instruction.4Building the CFG is part of PADRONE’s API, and opens
the way to detailed analysis actions. PADRONE goes further, by building a loop for-est from the CFG. Control flow and loop iterations are central to many performance studies, and PADRONE makes this available to any client.
2.4. Code Cache
The PADRONE API allows the creation of a code cache in the target process memory space. That special memory area is typically used to host optimized versions of pro-cess’s critical functions. It might happen that some functions optimizations are done in place, for instance when an instruction is replaced by another instruction of the same size or smaller (padding instructions would have to be added in that last case). But in most of the cases, functions must be significantly modified, and it would then be very hazardous to do all the modifications in place. The main reason is that one can never be certain that the overwritten code is not the target of a jump elsewhere in the program. Also, a client would be lucky if the modified version of the function is exactly the same size as the original one, leading to all sorts of problems linked to relative offsets in the code. The code cache is the solution to these issues.
PADRONE needs to allocate a buffer in the target process memory heap and manage that buffer, for instance to copy optimized functions into it. Since PADRONE and the target process do not share the same address space, some code must be injected into
3
Tail call elimination also complicates the matter.
4Indirect jumps are currently handled in an unsatisfactory way, and optimized tail calls are considered part
of the callee.
The details of the code cache creation are the following:
(1) PADRONE stops the target process, obtaining the current instruction pointer IP; (2) PADRONE saves the few bytes of code starting at IP, and replaces them with shell
code;
(3) PADRONE relinquishes the process, and calls wait;
(4) execution of the target process resumes, allocating memory for the code cache, and eventually reaching a trap that suspends the process and send a SIGCHILD signal to PADRONE;
(5) PADRONE retrieves relevant registers (typically, rax contains the address re-turned by malloc), restores the original code and IP, and let the process continue normal execution.
The actual code is only slightly more complicated, for technical reasons. Because the code cache is placed in the target process address space and because it must be exe-cutable, mprotect has to set the appropriate properties on the memory area, and this in turn has alignment requirements, which are ensured with the help of posix memalign. Section 3.3 describes an experiments where the code cache is used to hold an opti-mized version of a function of the original program.
3. USING PADRONE
3.1. Measuring Profiling Overhead
Profiling has a cost, but the mechanism just described can make the overhead minimal. To quantify the impact of PADRONE’s attaching, instrumenting, and detaching, we have run several experiments on SPEC CPU-2006 benchmark programs. Run time has been measured when varying two basic quantities:
— the duration of profiling d, in seconds: this is the time during which the Linux ker-nel perf event subsystem is leveraged to obtain performance data about the target process;
— the sampling frequency f , in units per seconds: this is the rate at which performance data is obtained by the client tool.
Our experiments have used durations of 1, 10, and 30 seconds, and sampling frequen-cies of 1 000, 10 000, and 100 000 samples per second. We believe this covers most of the use cases.
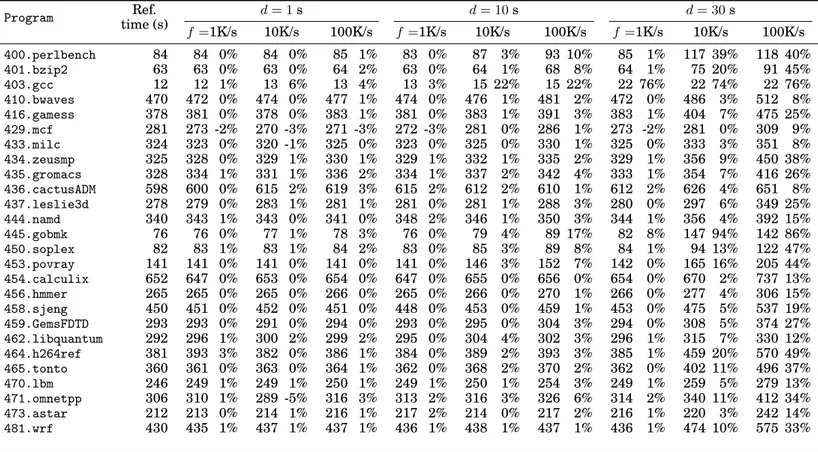
The run times and slowdown appear in the table of Figure 4. For each pair of param-eters, the table shows the execution time, and the slowdown incurred by PADRONE’s profiling. This slowdown is computed relative to a reference execution time, obtained by running the program standalone. As numbers show, the overhead is very small for short durations and reasonably low for reasonable frequencies. It is for instance per-fectly possible to obtain a 10 seconds profile with a frequency of 10000 samples per second.
A:7 Program Ref. time (s) d = 1s d = 10s d = 30s f =1K/s 10K/s 100K/s f =1K/s 10K/s 100K/s f =1K/s 10K/s 100K/s 400.perlbench 84 84 0% 84 0% 85 1% 83 0% 87 3% 93 10% 85 1% 117 39% 118 40% 401.bzip2 63 63 0% 63 0% 64 2% 63 0% 64 1% 68 8% 64 1% 75 20% 91 45% 403.gcc 12 12 1% 13 6% 13 4% 13 3% 15 22% 15 22% 22 76% 22 74% 22 76% 410.bwaves 470 472 0% 474 0% 477 1% 474 0% 476 1% 481 2% 472 0% 486 3% 512 8% 416.gamess 378 381 0% 378 0% 383 1% 381 0% 383 1% 391 3% 383 1% 404 7% 475 25% 429.mcf 281 273 -2% 270 -3% 271 -3% 272 -3% 281 0% 286 1% 273 -2% 281 0% 309 9% 433.milc 324 323 0% 320 -1% 325 0% 323 0% 325 0% 330 1% 325 0% 333 3% 351 8% 434.zeusmp 325 328 0% 329 1% 330 1% 329 1% 332 1% 335 2% 329 1% 356 9% 450 38% 435.gromacs 328 334 1% 331 1% 336 2% 334 1% 337 2% 342 4% 333 1% 354 7% 416 26% 436.cactusADM 598 600 0% 615 2% 619 3% 615 2% 612 2% 610 1% 612 2% 626 4% 651 8% 437.leslie3d 278 279 0% 283 1% 281 1% 281 0% 281 1% 288 3% 280 0% 297 6% 349 25% 444.namd 340 343 1% 343 0% 341 0% 348 2% 346 1% 350 3% 344 1% 356 4% 392 15% 445.gobmk 76 76 0% 77 1% 78 3% 76 0% 79 4% 89 17% 82 8% 147 94% 142 86% 450.soplex 82 83 1% 83 1% 84 2% 83 0% 85 3% 89 8% 84 1% 94 13% 122 47% 453.povray 141 141 0% 141 0% 141 0% 141 0% 146 3% 152 7% 142 0% 165 16% 205 44% 454.calculix 652 647 0% 653 0% 654 0% 647 0% 655 0% 656 0% 654 0% 670 2% 737 13% 456.hmmer 265 265 0% 265 0% 266 0% 265 0% 266 0% 270 1% 266 0% 277 4% 306 15% 458.sjeng 450 451 0% 452 0% 451 0% 448 0% 453 0% 459 1% 453 0% 475 5% 537 19% 459.GemsFDTD 293 293 0% 291 0% 294 0% 293 0% 295 0% 304 3% 294 0% 308 5% 374 27% 462.libquantum 292 296 1% 300 2% 299 2% 295 0% 304 4% 302 3% 296 1% 315 7% 330 12% 464.h264ref 381 393 3% 382 0% 386 1% 384 0% 389 2% 393 3% 385 1% 459 20% 570 49% 465.tonto 360 361 0% 363 0% 364 1% 362 0% 368 2% 370 2% 362 0% 402 11% 496 37% 470.lbm 246 249 1% 249 1% 250 1% 249 1% 250 1% 254 3% 249 1% 259 5% 279 13% 471.omnetpp 306 310 1% 289 -5% 316 3% 313 2% 316 3% 326 6% 314 2% 340 11% 412 34% 473.astar 212 213 0% 214 1% 216 1% 217 2% 214 0% 217 2% 216 1% 220 3% 242 14% 481.wrf 430 435 1% 437 1% 437 1% 436 1% 438 1% 437 1% 436 1% 474 10% 575 33%
Fig. 4. Profiling overhead on SPEC CPU-2006 programs: for every combination of d (duration) and f (sampling frequency), both run time and overhead (as a fraction of reference execution time) are shown. All quantities are rounded to the nearest integer.
W orkshop on Dynamic Compilation Everywhere , V ol. V , No . N , Artic le A, Publication date: J anuary 2014.
padrone_cfg_init(&cfg, &fun_info); err = padrone_cfg_build(&cfg); if (err < 0) goto failure;
padrone_fun_ipc_measure(&fun_info, 10); padrone_profile_destroy(&prof_result); padrone_cfg_destroy(&cfg); failure: padrone_leave(&padrone); return err;
Fig. 5. Performance measurement (IPC) using the PADRONE API
3.2. Performance Analysis
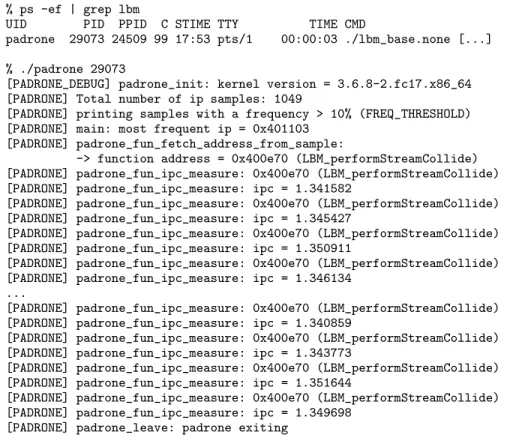
PADRONE can be used for different purposes. One of the examples we give here is the capability to measure the performance (as IPC, or instructions per cycle) of a hot function. As depicted on Figure 6, we monitored the SPEC2006 LBM bench-mark, and used PADRONE to detect a critical function and measure that function’s IPC for 10 successive calls. The code of this client is shown on Figure 5: the call to padrone_fun_ipc_measure is the PADRONE API to capture performance counter values. You can notice in that same code that after having profiled the process and fetched the address of the critical function, we build the CFG of that hot function (padrone_cfg_build). The reason for that is explained in 2.4, i.e., we need to build the CFG to detect the function limit. With that function limit we are able to measure the function’s IPC. The idea is to “trap” the beginning of the function execution, as well as all its possible return instructions. The first instruction of the function is replaced with a trap (after saving original instructions, to be restored before restarting the pro-cess), and we do the same with all the different ret instructions. Since PADRONE is “ptrace-attached” to the monitored process, it is informed of any trap execution. At the first trap PADRONE polls two hardware counters (previously configured as explained in 2.2) to get actual values of the number of cycles and number of retired instructions. The process is restarted, and the next trap signals the end of the function, at which time PADRONE can read again those same hardware counters, in order to compute the IPC.
3.3. Optimization by Function replacement
This section describes another possible usage of PADRONE, namely the replacement, at run time, of a given function by a custom, optimized version. To illustrate this task, we use a small program where the bulk of the work is made of a series of vector addi-tions. The main function is called redstep, it performs N calls to vecadd, which adds two vectors and puts the result in a third vector. Vectors are ultimately stored in raw
A:9 % ps -ef | grep lbm
UID PID PPID C STIME TTY TIME CMD
padrone 29073 24509 99 17:53 pts/1 00:00:03 ./lbm_base.none [...] % ./padrone 29073
[PADRONE_DEBUG] padrone_init: kernel version = 3.6.8-2.fc17.x86_64 [PADRONE] Total number of ip samples: 1049
[PADRONE] printing samples with a frequency > 10% (FREQ_THRESHOLD) [PADRONE] main: most frequent ip = 0x401103
[PADRONE] padrone_fun_fetch_address_from_sample:
-> function address = 0x400e70 (LBM_performStreamCollide) [PADRONE] padrone_fun_ipc_measure: 0x400e70 (LBM_performStreamCollide) [PADRONE] padrone_fun_ipc_measure: ipc = 1.341582
[PADRONE] padrone_fun_ipc_measure: 0x400e70 (LBM_performStreamCollide) [PADRONE] padrone_fun_ipc_measure: ipc = 1.345427
[PADRONE] padrone_fun_ipc_measure: 0x400e70 (LBM_performStreamCollide) [PADRONE] padrone_fun_ipc_measure: ipc = 1.350911
[PADRONE] padrone_fun_ipc_measure: 0x400e70 (LBM_performStreamCollide) [PADRONE] padrone_fun_ipc_measure: ipc = 1.346134
...
[PADRONE] padrone_fun_ipc_measure: 0x400e70 (LBM_performStreamCollide) [PADRONE] padrone_fun_ipc_measure: ipc = 1.340859
[PADRONE] padrone_fun_ipc_measure: 0x400e70 (LBM_performStreamCollide) [PADRONE] padrone_fun_ipc_measure: ipc = 1.343773
[PADRONE] padrone_fun_ipc_measure: 0x400e70 (LBM_performStreamCollide) [PADRONE] padrone_fun_ipc_measure: ipc = 1.351644
[PADRONE] padrone_fun_ipc_measure: 0x400e70 (LBM_performStreamCollide) [PADRONE] padrone_fun_ipc_measure: ipc = 1.349698
[PADRONE] padrone_leave: padrone exiting
Fig. 6. Performance measurements (IPC) of SPEC2006 lbm hot function using PADRONE
arrays of double precision floating point numbers. We have modified the program to print the time taken by a call to redstep, i.e., the time taken by N calls to vecadd (N = 1000 in our experiments).
In this scenario, the original program is legacy. It has been compiled on a machine where SSE vector instructions are available, and the vector addition has been vec-torized accordingly. We then run the same executable on a machine where AVX in-structions are available, leading to a sub-optimal use of resources. The goal of our experiment is to show that, provided an AVX-enabled version of the vecadd function, PADRONE is able to replace a function on the fly.
The corresponding PADRONE client is sketched on Figure 7. The first step (profiling) is similar to the previous example, an detects the program’s critical function (vecadd in our example). The tool then proceeds to replace the function with an optimized version (making full use of AVX hardware). The way the AVX binary version of the function is obtained is out of the scope of this paper which focuses on describing the infrastructure, i.e., we assume the binary code is basically provided by the user (via an array represented by the assembly 64 hw array in Figure 7).
PADRONE’s API provides a function called padrone_cc_insert to insert a bi-nary code into the code cache. It returns the address of this bibi-nary code, which is in our case the address of the optimized version of the critical function. Then padrone_cc_fun_call_replace is used to replace calls to the original function with calls to the optimized version. To achieve this, padrone_cc_fun_call_replace replaces the first instruction of the original function with a trap instruction. Each time the
padrone_cc_create(&padrone, &codecache, CC_ALLOC, fun_info.ip_start, sizeof(assembly_64_hw) + 10);
fun_info.cc_fun_addr = padrone_cc_insert(&codecache, assembly_64_hw, sizeof(assembly_64_hw)); padrone_cc_fun_call_replace(&fun_info, FALSE); padrone_profile_destroy(&prof_result); padrone_cc_finish(&codecache); failure: padrone_leave(&padrone); return err;
Fig. 7. vecadd replacement code using PADRONE API
% ./vecadd-sse ...
redstep: 62 166.92 ms 166.92 ns per iter redstep: 63 165.58 ms 165.58 ns per iter redstep: 64 165.51 ms 165.51 ns per iter redstep: 65 113.10 ms 113.10 ns per iter redstep: 66 89.32 ms 89.32 ns per iter redstep: 67 89.37 ms 89.37 ns per iter redstep: 68 89.78 ms 89.78 ns per iter redstep: 69 89.59 ms 89.59 ns per iter ...
Fig. 8. vecadd replacement
process is stopped in the trap, PADRONE fetches the function’s return address from the stack, to find out the address of the call site, and replace it with a call to the new function in the code cache. This is the quickest way to redirect flow of execution from original function to the optimized one.5
A run of the vecadd-sse program is depicted on Figure 8 (the PADRONE tool invo-cation is not shown). Every line in the output shows the time taken by a call to redstep (and the average time of calls to vecadd, of which there are one hundred). What ap-pears on this figure is the fact that, after a certain numbers of calls, the vecadd function is replaced, leading to a large reduction of execution time for redstep. The 65thcall to
redstep is the phase-transition call: a few first calls to vecadd have used the original version, the next ones have used the new one.
5PADRONE’s API also provides a way to install a code trampoline in original function. This basically
A:11
4. RELATED WORK
This section reviews a number of works in the ecosystem of profiling and dynamic binary tools.
4.1. Profiling Tools
Pin [Luk et al. 2005] is a dynamic binary instrumentation framework developed and supported by Intel. Thanks to a flexible API, the community has developed a rich set of pintools for architecture exploration, emulation, security. Pin always executes from the code cache, and never executes the original code. Instead, we try to minimize the amount of code we modify, executing as much as possible from untouched original code. Pin is also more oriented toward instrumentation and analysis than optimization.
Tiptop [Rohou 2011] is a tool that displays events collected from the hardware per-formance monitoring unit. It is similar to the UNIX utility top and refreshes values at regular time intervals. However, the values are read and displayed at the granularity of the thread, without knowledge of the function or loop, and for rather large intervals (at least tenths of seconds). PADRONE focuses on much finer 3grain intervals, and takes into account the structure of the application (functions and loops). A number of tools that read performance counters have been proposed, including Rabbit6, OProfile7,
libpfm, perfmon28, perf [Carvalho de Melo 2009], or vtune [Intel 2003]. LiMiT [Demme
and Sethumadhavan 2011] is a very recent proposal to reduce the overhead of reading counters, by directly reading machine registers and avoiding the system call.
4.2. Dynamic Binary to Binary Optimizers
ADORE [Chen et al. 2004] also uses hardware counters to identify hotspots and phases. It then optimizes the application for the data cache, and generates helper threads. Dynamo [Bala et al. 2000] and DynamoRIO [Bruening 2004] insist on the need for transparency. We address it by keeping all the client and toolbox in a separate address space, and by modifying as little as necessary of the original code. DynamoRIO (and Pin) always execute code only from the code cache, while we dedicate it to newly generated code. We also incur marginal overhead by using the support of the PMU, which is independent of the size and complexity of the monitored code, while those tools rely on instrumentation. Qemu [Bellard 2005] is a fast machine emulator based on dynamic translation, and performing code generation. Valgrind [Nethercote and Se-ward 2007] also builds its on intermediate representation. We chose to only modify the minimum possible and let original code run.
4.3. Auto-vectorization
Several techniques have been proposed to dynamically generate SIMD instructions at run-time. Yardımcı and Franz [Yardımcı and Franz 2008] dynamically vectorize (and parallelize) loops based on a static analysis of the executables. Our approach is purely dynamic. El-Shobaky et al. [El-Shobaky et al. 2009] added automatic vector-ization based on tree pattern matching to a JIT compiler. Nie et al. [Nie et al. 2010] also added auto-vectorization to a Java virtual machine. Nuzman et al. [Nuzman et al. 2011] perform speculative vectorization at the level of the bytecode in the context of split-compilation. The statically generated bytecode is speculatively vectorized in an abstract target-independent form and a JIT compiler materializes the actual param-eters, such as vector length, alignment constraints, and other existing idioms. Clark et al. [Clark et al. 2007] propose to convey SIMD opportunities within standard scalar
6 http://www.scl.ameslab.gov/Projects/Rabbit 7 http://oprofile.sourceforge.net 8 http://perfmon2.sourceforge.net
performance data for compute intensive functions, and replacing a time-consuming function with an optimized version.
PADRONE is still in an early stage of development, and we plan to extend it along several dimensions. Our next research target is to integrate various forms of dy-namic optimization right in the platform (rather than using pre-packaged variants, as in Section 3.3), by leveraging abstract program structures, like functions and loops. PADRONE is already able to recognize these structures, and we think that reasoning at that level of abstraction opens up a whole new range of potential dynamic optimiza-tions. We plan to use PADRONE to explore this space.
REFERENCES
BALA, V., DUESTERWALD, E.,ANDBANERJIA, S. 2000. Dynamo: a transparent dynamic optimization sys-tem. In PLDI. 1–12.
BELLARD, F. 2005. Qemu, a fast and portable dynamic translator. In USENIX ATC, FREENIX Track. 41–46. BRUENING, D. 2004. Efficient, transparent, and comprehensive runtime code manipulation. Ph.D. thesis,
MIT.
CARVALHO DEMELO, A. 2009. Performance counters on Linux. In Linux Plumbers Conference.
CHEN, H., LU, J., HSU, W.-C., AND YEW, P.-C. 2004. Continuous adaptive object-code re-optimization framework. In Advances in Computer Systems Architecture. LNCS Series, vol. 3189. 241–255.
CLARK, N., HORMATI, A., YEHIA, S., MAHLKE, S.,ANDFLAUTNER, K. 2007. Liquid SIMD: Abstracting SIMD hardware using lightweight dynamic mapping. In HPCA. 216–227.
DEMME, J.AND SETHUMADHAVAN, S. 2011. Rapid identification of architectural bottlenecks via precise event counting. In ISCA. 353–364.
EL-SHOBAKY, S., EL-MAHDY, A.,ANDEL-NAHAS, A. 2009. Automatic vectorization using dynamic compi-lation and tree pattern matching technique in Jikes RVM. In ICOOOLPS. 63–69.
INTEL. 2003. Technologies for measuring software performance. White Paper.
LUK, C.-K., COHN, R., MUTH, R., PATIL, H., KLAUSER, A., LOWNEY, G., WALLACE, S., REDDI, V. J.,AND
HAZELWOOD, K. 2005. Pin: building customized program analysis tools with dynamic instrumentation. In PLDI. 190–200.
NETHERCOTE, N.ANDSEWARD, J. 2007. Valgrind: a framework for heavyweight dynamic binary instru-mentation. In PLDI. 89–100.
NIE, J., CHENG, B., LI, S., WANG, L.,ANDLI, X.-F. 2010. Vectorization for Java. In Network and Parallel Computing. LNCS Series, vol. 6289. 3–17.
NUZMAN, D., DYSHEL, S., ROHOU, E., ROSEN, I., WILLIAMS, K., YUSTE, D., COHEN, A.,AND ZAKS, A. 2011. Vapor SIMD: Auto-vectorize once, run everywhere. In CGO. 151–160.
ROHOU, E. 2011. Tiptop: Hardware Performance Counters for the Masses. Research Report RR-7789, IN-RIA. Nov.
YARDIMCI, E.AND FRANZ, M. 2008. Dynamic parallelization and vectorization of binary executables on hierarchical platforms. Journal of Instruction-Level Parallelism 10, 1–24.