Billing the CPU Time Used by System Components on Behalf of VMs
10
0
0
Texte intégral
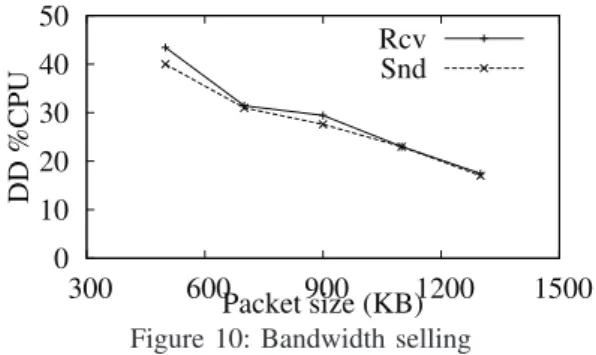
Figure
+2
Documents relatifs