HAL Id: dumas-00747868
https://dumas.ccsd.cnrs.fr/dumas-00747868
Submitted on 2 Nov 2012
HAL is a multi-disciplinary open access
archive for the deposit and dissemination of sci-entific research documents, whether they are pub-lished or not. The documents may come from teaching and research institutions in France or abroad, or from public or private research centers.
L’archive ouverte pluridisciplinaire HAL, est destinée au dépôt et à la diffusion de documents scientifiques de niveau recherche, publiés ou non, émanant des établissements d’enseignement et de recherche français ou étrangers, des laboratoires publics ou privés.
perfusion myocardique par analyse markovienne de la
tomoscintigraphie monophotonique au Thallium deux
cent un : étude clinique preuve de concept à partir de
125 patients
Alix Martin
To cite this version:
Alix Martin. Détection et quantification de l’hétérogénéité spatiale de perfusion myocardique par anal-yse markovienne de la tomoscintigraphie monophotonique au Thallium deux cent un : étude clinique preuve de concept à partir de 125 patients. Human health and pathology. 2011. �dumas-00747868�
AVERTISSEMENT
Ce document est le fruit d'un long travail approuvé par le
jury de soutenance et mis à disposition de l'ensemble de la
communauté universitaire élargie.
Il n’a pas été réévalué depuis la date de soutenance.
Il est soumis à la propriété intellectuelle de l'auteur. Ceci
implique une obligation de citation et de référencement
lors de l’utilisation de ce document.
D’autre part, toute contrefaçon, plagiat, reproduction illicite
encourt une poursuite pénale.
Contact au SICD1 de Grenoble :
thesebum@ujf-grenoble.frLIENS
LIENS
Code de la Propriété Intellectuelle. articles L 122. 4
Code de la Propriété Intellectuelle. articles L 335.2- L 335.10
http://www.cfcopies.com/V2/leg/leg_droi.php
FACULTE DE MEDECINE DE GRENOBLE
ANNEE 2011
Détection et quantification de l’hétérogénéité spatiale
de perfusion myocardique par analyse Markovienne
de la tomoscintigraphie monophotonique au
201Thallium
Etude clinique preuve de concept à partir de 125 patients
THESE
PRESENTEE POUR L’OBTENTION DU DOCTORAT EN MEDECINE
DIPLOME D’ETAT
Alix MARTIN
Née le 9 Novembre 1981 à Chambéry
Thèse soutenue publiquement à la Faculté de Médecine de Grenoble
le 23 septembre 2011
Devant le jury composé de :
Monsieur le Professeur MACHECOURT, président du jury
Monsieur le Professeur VANZETTO, directeur de thèse
Monsieur le Professeur FAGRET
Monsieur le Professeur BAGUET
Monsieur le Docteur RIOU
Liste des Professeurs et Maîtres de Conférences des Universités de la Faculté de Médecine de Grenoble
Professeurs des Universités - Faculté de Médecine de Grenoble - 2011
ALBALADEJO Pierre CLINIQUE D'ANESTHESIE
ARVIEUX-BARTHELEMY Catherine CLINIQUE DE CHIRURGIE ET DE L'URGENCE
BACONNIER Pierre BIOSTATISTIQUES ET INFORMATIQUE MEDICALE
BAGUET Jean-Philippe CLINIQUE DE CARDIOLOGIE
BALOSSO Jacques RADIOTHERAPIE
BARRET Luc CLINIQUE MEDECINE LEGALE
BAUDAIN Philippe CLINIQUE RADIOLOGIE ET IMAGERIE MEDICALE
BEANI Jean-Claude DERMATOLOGIE-VENEREOLOGIE- PHOTOBIOLOGIE ALLERGOLOGIE
BENHAMOU Pierre Yves CLINIQUE ENDOCRINO DIABETO NUTRITION DIABETOLOGIE
BERGER François ONCOLOGIE MEDICALE
BLIN Dominique CLINIQUE CHIRURGIE CARDIAQUE
BOLLA Michel CENTRE COORD. CANCEROLOGIE
BONAZ Bruno CLINIQUE HEPATO-GASTRO- ENTEROLOGIE
BOSSON Jean-Luc DPT DE METHODOLOGIE DE L'INFORMATION DE SANTE
BOUGEROL Thierry PSYCHIATRIE D’ADULTES - PAVILLON D. VILLARS
BRAMBILLA Élisabeth DPT ANATOMIE & CYTOLOGIE PATHOLOGIQUES
BRAMBILLA Christian CLINIQUE DE PNEUMOLOGIE
BRICHON Pierre-Yves CLINIQUE DE CHIRURGIE VASCULAIRE ET THORACIQUE
BRIX Muriel CLINIQUE CHIR. MAXILLO-FACIALE
CAHN Jean-Yves CANCEROLOGIE
CARPENTIER Patrick CLINIQUE MEDECINE VASCULAIRE
CARPENTIER Françoise CLINIQUE URGENCE
CESBRON Jean-Yves IMMUNOLOGIE
CHABARDES Stephan CLINIQUE DE NEUROCHIRURGIE
CHABRE Olivier CLINIQUE ENDOCRINO DIABETO NUTRITION ENDOCRINOLOGIE
CHAFFANJON Philippe CHIRURGIE THORACIQUE, VASCULAIRE ET ENDOCRINIENNE
CHAVANON Olivier CLINIQUE DE CHIRURGIE CARDIAQUE
CHIQUET Christophe CLINIQUE OPHTALMOLOGIQUE
CHIROSSEL Jean-Paul ANATOMIE - FACULTE DE MEDECINE
CINQUIN Philippe DPT D'INNOVATIONS TECHNOLOGIQUES
COHEN Olivier DELEGATION - HC FORUM
COUTURIER Pascal CLINIQUE MEDECINE GERIATRIQUE
CRACOWSKI Jean-Luc LABORATOIRE DE PHARMACOLOGIE
DE GAUDEMARIS Régis DPT MEDECINE & SANTE DU TRAVAIL
DEBILLON Thierry CLINIQUE REA. & MEDECINE NEONATALE
DEMONGEOT Jacques BIOSTATISTIQUES ET INFORMATIQUE MEDICALE
DESCOTES Jean-Luc CLINIQUE UROLOGIE
ESTEVE François GRENOBLE INSTITUT DES NEUROSCIENCES
FAGRET Daniel CLINIQUE DE MEDECINE NUCLEAIRE
FAUCHERON Jean-Luc CLINIQUE DE CHIRURGIE DIGESTIVE ET DE L'URGENCE
FAVROT Marie Christine DPT DE BIOLOGIE INTEGREE / CANCEROLOGIE
FERRETTI Gilbert CLINIQUE RADIOLOGIE & IMAGERIE MEDICALE
FEUERSTEIN Claude GIN
FRANCO Alain CLINIQUE VIEILLISSEMENT ET HANDICAP
FRANCOIS Patrice DPT DE VEILLE SANITAIRE
GARNIER Philippe 59 CHEMIN DE FRANQUIERES - 38330 BIVIERS
GAUDIN Philippe CLINIQUE DE RHUMATOLOGIE
GAY Emmanuel CLINIQUE NEUROCHIRURGIE
GIRARDET Pierre ANESTHESIE REANIMATION
GRIFFER Jacques CHIRURGIE INFANTILE
HALIMI Serge CLINIQUE ENDOCRINO-DIABETO-NUTRITION
HOMMEL Marc CLINIQUE DE NEUROLOGIE
JOUK Pierre-Simon DEPARTEMENT GENETIQUE ET PROCREATION
JUVIN Robert CLINIQUE DE RHUMATOLOGIE - HOPITAL SUD
KAHANE Philippe CLINIQUE DE NEUROLOGIE
KRACK Paul CLINIQUE DE NEUROLOGIE
KRAINIK Alexandre CLINIQUE NEURORADIOLOGIE & IRM
LANTUEJOUL Sylvie DEPARTEMENT D'ANATOMIE ET CYTOLOGIE PATHOLOGIQUES
LE BAS Jean-François CLINIQUE NEURORADIOLOGIE & IRM
LEBEAU Jacques CLINIQUE CHIR. MAXILLO-FACIALE
LECCIA Marie-Thérèse DERMATOLOGIE-VENEREOLOGIE PHOTOBIOLOGIE ALLERGOLOGIE
LEROUX Dominique DEPARTEMENT BIOLOGIE ET PATHOLOGIE DE LA CELLULE
LEROY Vincent CLINIQUE D'HEPATO GASTRO ENTEROLOGIE
LETOUBLON Christian CLINIQUE CHIRURGIE DIGESTIVE & URGENCE
LEVY Patrick PHYSIOLOGIE
LUNARDI Joël BIOCHIMIE
MACHECOURT Jacques CLINIQUE DE CARDIOLOGIE
MAGNE Jean-Luc CLINIQUE CHIRURGIE VASCULAIRE & THORACIQUE
MAITRE Anne MEDECINE DU TRAVAIL
MASSOT Christian CLINIQUE MEDECINE INTERNE
MAURIN Max DEPARTEMENT DES AGENTS INFECTIEUX / BACTERIOLOGIE
MERLOZ Philippe CLINIQUE CHIR. ORTHOPEDIE TRAUMATOLOGIE
MORAND Patrice DPT DES AGENTS INFECTIEUX / VIROLOGIE
MORO-SIBILOT Denis PNEUMOLOGIE - ONCOLOGIE
MOUSSEAU Mireille ONCOLOGIE MEDICALE
MOUTET François CHIR. PLASTIQUE ET RECONSTRUCTRICE ET ESTHETIQUE
PASSAGIA Jean-Guy ANATOMIE
PAYEN DE LA GARANDERIE Jean-François CLINIQUE REANIMATION
PELLOUX Hervé DEPARTEMENT DES AGENTS INFECTIEUX
PEPIN Jean-Louis CLINIQUE PHYSIOLOGIE SOMMEIL & EXERCICE
PERENNOU Dominique SERVICE DE REEDUCATION
PERNOD Gilles CLINIQUE DE MEDECINE VASCULAIRE
PIOLAT Christian CLINIQUE DE CHIRURGIE INFANTILE
PISON Christophe CLINIQUE PNEUMOLOGIE
PLANTAZ Dominique CLINIQUE MEDICALE PEDIATRIQUE
POLACK Benoît BIOLOGIE ET PATHOLOGIE DE LA REPRODUCTION
POLLAK Pierre NEUROLOGIE
PONS Jean-Claude CLINIQUE UNIVERSITAIRE GYNECOLOGIE OBSTETRIQUE
RAMBEAUD J Jacques CLINIQUE UROLOGIE
RIGHINI Christian CLINIQUE O.R.L.
ROMANET J. Paul CLINIQUE OPHTALMOLOGIQUE
SARAGAGLIA Dominique CLINIQUE ORTHOPEDIQUE ET TRAUMATOLOGIE
SCHLATTNER Uwe BIOLOGIE
SCHMERBER Sébastien CLINIQUE O.R.L.
SEIGNEURIN Daniel DPT ANATOMIE & CYTOLOGIE PATHOLOGIQUES
SELE Bernard DPT GENETIQUE & PROCREATION
SESSA Carmine CHIRURGIE THORACIQUE VASCULAIRE
STAHL Jean-Paul CLINIQUE INFECTIOLOGIE
TIMSIT Jean-François CLINIQUE REANIMATION MEDICALE
TONETTI Jérôme CLINIQUE ORTHOPEDIQUE ET TRAUMATOLOGIE
TOUSSAINT Bertrand BIOCHIMIE ET BIOLOGIE MOLECULAIRE
VANZETTO Gérald CLINIQUE DE CARDIOLOGIE
VUILLEZ Jean-Philippe BIOPHYSIQUE ET TRAITEMENT DE L’IMAGE
ZAOUI Philippe CLINIQUE NEPHROLOGIE
Maîtres de Conférences des Universités - Faculté de Médecine de Grenoble – 2011
BOTTARI Serge Département de Biologie Intégrée
BOUTONNAT Jean Département de Biologie et Pathologie de la Cellule
BRENIER-PINCHART M. Pierre Département des agents infectieux Parasitologie Mycologie
BRICAULT Ivan Clinique de radiologie et imagerie médicale
BRIOT Raphaël Pôle Urgence SAMU
CALLANAN-WILSON Mary Génétique IAB
CROIZE Jacques Département des agents infectieux - Micro biovigilance
DEMATTEIS Maurice Clinique de physiologie sommeil et exercice
DERANSART Colin GIN
DETANTE Olivier Clinique de Neurologie
DROUET Christian Département de Biologie et Pathologie de la Cellule
DUMESTRE-PERARD Chantal Immunologie
EYSSERIC Hélène Clinique de Médecine Légale
FAURE Anne-Karen Biologie de la procréation / CECOS - génétique et procréation
FAURE Julien Département génétique et procréation
GARBAN Frédéric Unité clinique thérapie cellulaire
GAVAZZI Gaëtan Clinique médecine interne gériatrique
GRAND Sylvie Clinique de Radiologie et Imagerie Médicale
HENNEBICQ Sylviane Biologie de la procréation
HOFFMANN Pascale Clinique Universitaire Gynécologie Obstétrique
JACQUOT Claude Clinique d'Anesthésie
LABARERE José Département de veille sanitaire
LAPORTE François Département de biologie intégrée
LARDY Bernard Département de biologie et pathologie de la
LARRAT Sylvie Département des agents infectieux
LAUNOIS-ROLLINAT Sandrine Clinique de Physiologie sommeil et exercice
MALLARET Marie-Reine Unité d'Hygiène Hospitalière
MOREAU-GAUDRY Alexandre Département d'innovations technologiques
MOUCHET Patrick Clinique de Physiologie sommeil et exercice
PACLET Marie-Hélène Département de biologie et pathologie de la cellule
PALOMBI Olivier Clinique de neurochirurgie
PASQUIER Dominique Département d'anatomie et cytologie pathologiques
PELLETIER Laurent Centre d'innovation biologique
PAYSANT François Clinique de Médecine Légale
RAY Pierre Biologie de la reproduction Département génétique et procréation
RENVERSEZ J.Charles Département de biologie intégrée - Biochimie et Biologie Moléculaire
RIALLE Vincent Laboratoire TIMC
SATRE Véronique Génétique chromosomique - Département génétique et procréation STANKE-LABESQUE Françoise Laboratoire de Pharmacologie
STASIA Marie-Josée Département de biologie et pathologie de la cellule
TAMISIER Renaud Clinique de Physiologie sommeil et exercice
Monsieur le Professeur Machecourt, Merci pour votre enseignement, tout particulièrement votre science de l’ECG et votre sens absolu du stéthoscope.
Monsieur le Professeur Fagret, Pour votre enthousiasme, votre optimisme et votre humour en toute circonstance.
Monsieur le Pr Vanzetto, Merci de m’avoir confié ce travail, une véritable aventure.
Monsieur le Professeur Baguet Jean Philippe, merci pour ta malice et ta bienveillance.
Monsieur le Dr Laurent Riou Pour ta patience avec deux apprentis docteur…
A ma sœur, ma complice de toujours … mission accomplie !
A Sofia, qui a cru en moi bien avant les autres…
A ma mère, ma locomotive
A mon père, rêveur invétéré
A Marion, parce qu’il est des rencontres qui ne s’expliquent pas
A mon infirmière préférée, qui se reconnaîtra
A Gersende, mon amie d’enfance
A mes grands parents, qui auraient été sacrément fiers
Détection et quantification de l’hétérogénéité spatiale
de perfusion myocardique par analyse Markovienne
de la tomoscintigraphie monophotonique au
201Thallium
SOMMAIRE
I. Introduction ...3
II. Notions préliminaires ...6
1. Notions de traitement de l’image ...7
1.1. Artéfacts ...7
1.2. Fréquences spatiales d’une image - Principe du filtrage ...8
1.3. Filtre de Butterworth : Principes et implications pour l’étude de l’hétérogénéité ...9
2. Notions d’analyse Markovienne...12
III. Travail original...14
Table des abréviations...16
Résumé...17
Introduction ...18
Patients & méthode...20
Population ...20
Acquisition et d’analyse des images...21
Index d’hétérogénéité HI ...21 Analyse statistique...24 Résultats...24 Données de la population...33 Etude d’optimisation ...25 Etude de validation ...29 Relation défect-hétérogénéité...31 Discussion...32
Hétérogénéité de perfusion et dysfonction endothéliale ...32
Performances de la scintigraphie pour le diagnostic d’hétérogénéité de perfusion ...33
Valeur pronostique de l’hétérogénéité de perfusion ...34
Limite de l’étude ...35
Conclusions...44
Références...36
IV. Conclusions ...40
V. Annexes...43
1. Résultats complets des ROC analyses ...44
La rupture d’une plaque athéromateuse intracoronaire et la formation de thrombus qui en découle sont la principale cause des syndromes coronariens aigus (SCA) et des morts subites ischémiques. La composition et la vulnérabilité de cette plaque, plus que son degré de sténose, sont déterminantes dans son évolution vers un SCA. En effet, les plaques jeunes, riches en lipides, inflammatoires, avec chape fibreuse fine, sont plus propices à la rupture que les plaques anciennes et fibreuses. Même si ces dernières évoluent plus fréquemment vers l’occlusion, elles sont en effet moins souvent responsables de SCA, parce qu’elles sont de loin moins nombreuses et volontiers associées à une circulation collatérale protectrice. En conséquent, la large majorité des SCA résulte d’une lésion non obstructive, donc non ischémiante et non détectable par les tests diagnostiques habituels de la maladie coronaire. A ce jour, il n’existe pas de technique utilisable en routine pour le dépistage de ces plaques vulnérables.
Parallèlement, il est établi que la dysfonction endothéliale coronaire constitue un stade précoce de la maladie et est un marqueur de coronaropathie et d’événements cardiaques futurs. Cette dysfonction endothéliale coronaire, contemporaine de la constitution des plaques vulnérables, pourrait donc constituer un outil pronostique pertinent, mais son étude reste confinée à la recherche en l’absence, là encore, de méthodes facilement utilisables en clinique.
Récemment, les Professeurs Gould et Johnson (University of Texas Medical School, Houston) ont démontré la possibilité de mettre en évidence et de quantifier (par tomographie par émission de positons) une hétérogénéité spatiale de perfusion myocardique, laquelle reflèterait une hétérogénéité de vasomotricité coronaire, et donc l’existence d’une dysfonction endothéliale. Leur technique fait appel à une analyse Markovienne de la scintigraphie, reposant sur un modèle mathématique d’étude de l’homogénéité des images. Ce modèle reflète la probabilité que des pixels adjacents soient d’intensité différente, tout en s’affranchissant des anomalies perfusionnelles « conventionnelles », en les considérant comme homogènes, et donc sans influence sur le résultat. L’index d’hétérogénéité (Hi)
ainsi calculé admet pour valeurs extrêmes 0 et 1 ; il se rapproche d’autant plus de 0 que la scintigraphie est hétérogène, la valeur 1 correspondant à une image parfaitement homogène.
Aucune donnée à ce jour n’est toutefois disponible sur la capacité de la tomoscintigraphie monophotonique à mettre en évidence et à quantifier une telle hétérogénéité perfusionnelle myocardique, ni sur l’influence des paramètres de reconstruction de l’image scintigraphique sur cette hétérogénéité.
Parce que le diabète est un modèle clinique de dysfonction endothéliale et un puissant facteur de risque de maladies micro- et macrovasculaires (notamment coronaire) et d’événements cardiovasculaires majeurs, la présente étude a reposé sur la comparaison entre des patients diabétiques à haut risque cardiovasculaire et des sujets contrôles à faible probabilité de maladie coronaire. Elle a eu pour objectifs :
1. de démontrer que la tomoscintigraphie de perfusion au 201Thallium était capable de mettre en évidence des différences d’hétérogénéité de perfusion myocardique entre ces deux populations, tout en déterminant les paramètres de traitement de l’image optimaux (en particulier les filtres utilisés) dans ce but (Etude d’optimisation comportant 60 sujets) ;
2. de valider ces paramètres sur une seconde cohorte de sujets diabétiques et non diabétiques, à la fois en termes diagnostiques (détection de l’hétérogénéité) et pronostiques (survenue d’événements cardiovasculaires à 1 an) (Etude de validation chez 65 sujets).
1. Notions de traitement de l’image
1.1.Artéfacts1
Une image scintigraphique est une représentation de la distribution dans l’espace de la distribution d'un isotope radioactif. Deux phénomènes altèrent la fidélité de cette représentation :
1. un artéfact déterministe - constant et mesurable - provenant du fait que les gamma-caméras, comme tous les appareils d'imagerie, ne sont pas rigoureusement stigmates, c'est-à-dire qu’une distribution ponctuelle de radioactivité ne produit pas une image ponctuelle ;
2. un artéfact stochastique - ou probabiliste - provenant de la physique du processus de désintégration (atténuation, diffusion, …). Il conduit à la présence d'un signal aléatoire parasite ou bruit.
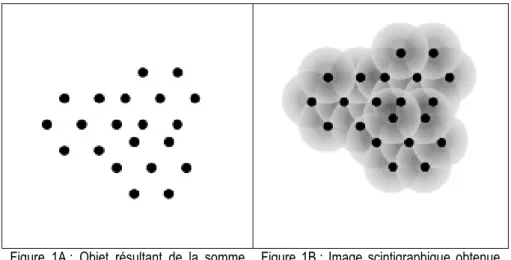
Il en résulte qu’une émission ponctuelle (une «goutte» radioactive) dans le champ d'une gamma-caméra produit une image non ponctuelle constituée d'un hypersignal central entouré d'un halo dont l'intensité décroît avec la distance (autrement dit une «tâche»), constituant un artéfact de représentation de l’objet initial ponctuel.
L’image scintigraphique, obtenue à partir d’une multitude d’émissions ponctuelles, aboutit à la superposition d’une multitude de « taches », si bien qu’au sein de l’image intervient une succession de changements d’intensités (Figure 1A et 1B).
Figure 1A : Objet résultant de la somme d’émissions radioactives ponctuelles.
Figure 1B : Image scintigraphique obtenue du fait de l’astigmatisme de la camera et des phénomènes stochastiques
1.2. Fréquences spatiales d’une image - Principe du filtrage1,2
On appelle fréquences spatiales d’une image les fréquences de changements d’intensités par unité de distance. Les hautes fréquences correspondent à des changements survenant sur des distances très courtes (par ex. de fines lignes rapprochées) tandis que les basses fréquences correspondent à des changements survenant sur de grandes distances (par ex. de larges bandes). Toute image peut donc se définir par un spectre de fréquences spatiales. Une représentation 2D de ce spectre peut être obtenue par transformée de Fourier.
Appliquer un filtre à une image scintigraphique consiste donc à appliquer une sélection mathématique de certaines fréquences « médicalement intéressantes » et à éliminer les fréquences « artéfactuelles » secondaires à l’astigmatisme des gamma-caméras et aux phénomènes radioactifs stochastiques. Ce filtrage mathématique complexe passe le plus souvent par trois étapes :
1- une transformation de l’image initiale en image de fréquences spatiales par transformée de Fourier 2- l’application d’un algorithme mathématique visant à sélectionner les fréquences pertinentes 3- une transformée de Fourier inverse permettant de restituer une image « anatomique » (Figure 2).
Figure 2 : Effet d’un filtre opérant une coupure de fréquences spatiales sur image fréquentielle obtenue par transformée de Fourier à partir de l’image scintigraphique initiale. L’image finale est restituée par une transformée de Fourier inverse après sélection des fréquences spatiales d’intérêt. Cet exemple illustre comment une sélection de fréquence entraine une modification de l’homogénéité de la scintigraphie.
En d’autres termes, filtrer une image, c'est éliminer ou atténuer certains artefacts déterministes ou stochastiques néfastes à l'usage pour lequel l'image a été produite, tout en respectant ses composantes utiles. Cette discrimination signal utile / signal parasite est directement en rapport avec l'usage médical souhaité. Il s'agit donc d'une décision de nature médicale qui dépend de l'acte diagnostique envisagé, des conditions de l'examen et du patient.
Mettre en place une procédure de filtrage nécessite donc :
1 - de déterminer un critère discriminant pour identifier signal utile et signal parasite, 2 - d'imaginer un algorithme capable de s'appuyer sur ce critère pour isoler le signal utile, 3 - enfin de valider ce traitement d’image en termes de pertinence diagnostique.
1.3. Filtre de Butterworth : Principes et implications pour l’étude de l’hétérogénéité de perfusion myocardique2
Le filtre de Butterworth est un des filtres les plus utilisés en cardiologie nucléaire. C’est un filtre linéaire passe-bas, définit par 2 paramètres critiques :
- sa fréquence de coupure (cut-off), exprimée en fraction de la fréquence spatiale maximale de
l’image (par ex. un cut-off de 0.2 signifie un filtrage des fréquences > 20% de la fréquence maximale). Les valeurs habituelles de cut-off en médecine nucléaire s’échelonnent entre 0.2 et 0.8.
- son ordre ou pente de coupure (roll-off) traduisant le caractère plus ou moins progressif de la
coupure des hautes fréquences (Figure 3).
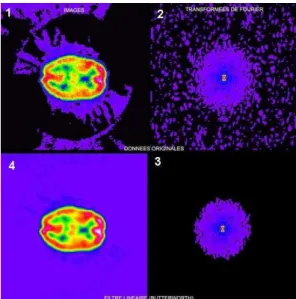
En atténuant les fréquences au-delà de la fréquence de coupure choisie, le filtre supprimera les composantes fréquentielles qui assurent toutes les variations brutales de niveau de gris entre deux pixels (que celles-ci soient du bruit ou des contrastes élevés dans l'image) et effectue donc un lissage de l’image. Plus la fréquence et la pente de coupure de coupure sont élevées, plus l’image apparaitra hétérogène ; inversement, plus elles sont faibles plus l’image apparaitra homogène (Figure 4).
Figure 3 : Représentation graphique d’un filtre Butterworth avec en abscisse les fréquences spatiales et en ordonnée l’intensité en décibels.
*
représente un exemple de fréquence de coupure (cut-off) avec différentes pentes de coupure (roll-off)Figure 4 : Illustration d’un filtrage de type Butterworth : 1 - image initiale, 2 - transformée de Fourier en domaine fréquentiel, 3 - transformée de Fourier après application de l’algorithme de Butterworth, 4 - image finale après soustraction du bruit fond et lissage obtenue par transformée de Fourier inverse.
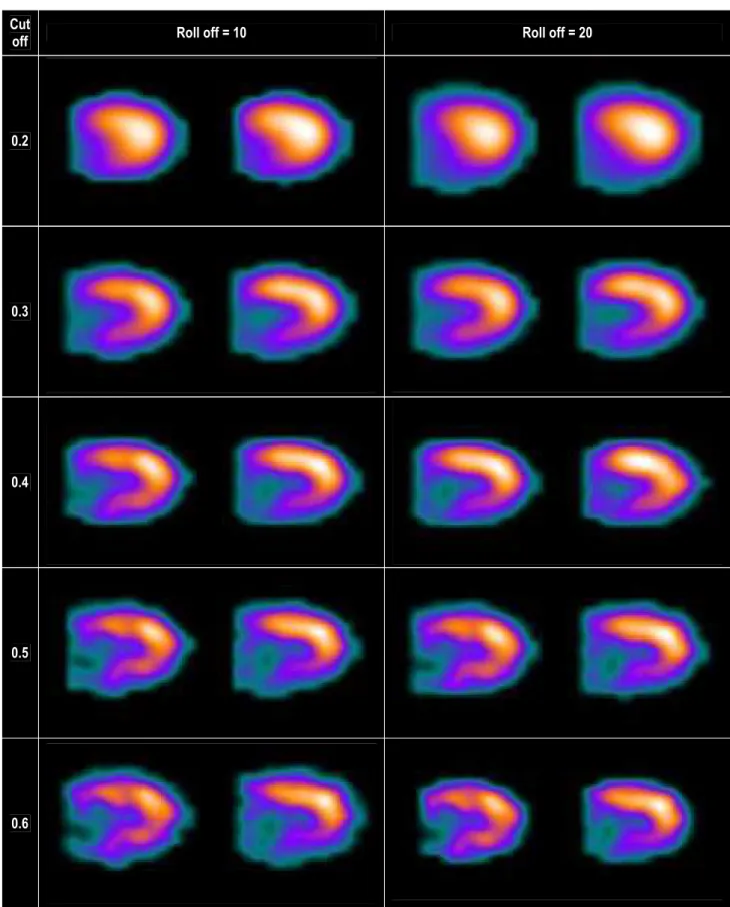
Parce que le type et les paramètres de filtrage influencent directement l’homogénéité et la résolution spatiale de l’image scintigraphique (figure 5), un préalable à l’étude de l’hétérogénéité de perfusion myocardique était donc d’analyser l’influence de ces paramètres sur la valeur de l’index d’hétérogénéité et de déterminer leurs valeurs optimales. Cela été l’objet de notre étude dite « d’optimisation ».
Figure 5 : Effet de différents filtres Butterworth sur l’aspect d’une TSM de perfusion au 201Thallium de stress chez un même
patient
Cut
off Roll off = 10 Roll off = 20
0.2
0.3
0.4
0.5
2. Notions d’analyse Markovienne3
Andreï Andreïevitch MARKOV est un mathématicien russe, né le 14 Juin 1856 à Ryazan et mort le 20 Juillet 1922 à St Petersbourg. Membre de l'école probabiliste russe il est l’inventeur en 1907 des processus, chaînes, et champs qui portent son nom.
Le principe des champs de Markov est que l’on peut calculer la probabilité d’état d’un point inconnu en connaissant uniquement l’état de ses voisins. Cette modélisation permet d’introduire explicitement des interactions à courte portée, et induit implicitement des interactions à plus longue portée par “transitivité”. Cette technique a permis de faire d’énorme progrès dans la reconstitution de documents anciens partiellement effacés et dans le cryptage à visée militaire.
Une autre application classique des champs de Markov est l’analyse des textures fines. Leur intérêt est principalement de pouvoir modéliser des interactions entre pixels par un modèle probabiliste. Cette technique probabiliste complexe est une des méthodes classiques d’analyse automatisée et de caractérisation d’images numériques (variations de contraste, analyse de texture, détection de contours, segmentation, classification etc.) dans des domaines aussi variés que la météorologie, la cartographie par satellite, et l’imagerie médicale.
L’analyse markovienne d’hétérogénéité d’une image caractérise celle-ci en examinant la probabilité (Pd) qu'un pixel avec une intensité donnée (m) ait un pixel voisin d’intensité différente. Un index d’hétérogénéité (Hi) peut ainsi être calculé sur l’ensemble d’une image, et représente schématiquement la probabilité moyenne de différence d’intensité entre des pixels adjacents :
Cet index permet d’exprimer par une valeur quantifiée et unique la notion intuitive d’hétérogénéité. Hi peut avoir des valeurs comprises entre 0 (exclu) et 1 (inclus). Une valeur proche de 0 représente une image avec une forte probabilité que des pixels voisins aient des valeurs d'intensité très différentes, et donc une forte hétérogénéité. Inversement, une valeur proche de 1 traduit une image avec une forte probabilité que des pixels voisins aient des valeurs d'intensité similaires, et représente donc une faible hétérogénéité.
Cette méthode a été appliquée dans notre étude aux images de perfusion myocardique obtenues par tomoscintigraphie au 201Thallium. Hi exprime donc une hétérogénéité de répartition du radio-traceur, qui, selon l’hypothèse proposée récemment par Gould et Johnson, reflèterait une hétérogénéité de perfusion myocardique et donc l’existence d’une dysfonction endothéliale coronaire.
La méthode mathématique de calcul de l’index d’hétérogénéité Hi proposée par ces auteurs permet de s’affranchir des défects perfusionnels sévères (réversibles ou fixes), en pondérant fortement les petites différences d’intensité et en négligeant les fortes différences d’intensité. En effet, la finalité de Hi n’est pas de mettre en évidence de larges défects localisés -facilement observables- mais de révéler et de quantifier de faibles variations perfusionelles répartis sur l’ensemble du myocarde.
Références :
1. Mariano-Goulart D. Traitement des images scintigraphiques. Cours de médecine nucléaire. INSTN. SACLAY, Avril 2011.
2. Lyra M, Ploussi A. Filtering in SPECT Image Reconstruction. International Journal of Biomedical Imaging. 2011, April (In press)
3. Johnson NP, Gould KL. Clinical evaluation of a new concept: resting myocardial perfusion heterogeneity quantified by markovian analysis of PET identifies coronary microvascular dysfunction and early atherosclerosis in 1,034 subjects. J Nucl Med. 2005;46:1427-37.
Detection and Quantification of Myocardial Perfusion Spatial Heterogeneity by Markovian Analysis of 201Thallium Single Photon Emission Tomography: A proof of concept clinical study
Short title: Myocardial perfusion heterogeneity
Key words: Myocardial perfusion imaging - Single photon emission tomography - Coronary artery disease – Diabetes - Perfusion heterogeneity - Markovian analysis
ABREVIATIONS
ACS: acute coronary syndromes AMI: acute myocardial infarction
ARCADIA: Assessment of Risk for CArdiac events in DIAbetes Bq: Becquerel
CAD: coronary artery disease CVE: cardiovascular events ECG: electrocardiogram
HbA1c: A1c glycated haemoglobin HDL: high density lipoprotein Hi: heterogeneity index LDL: low density lipoprotein
MPH: myocardial perfusion heterogeneity MPI: myocardial perfusion imaging MPS: myocardial perfusion scintigraphy PET: positron emission tomography ROC: receiver operating curve
ABSTRACT
Background: Myocardial perfusion heterogeneity (MPH) is a surrogate marker of coronary endothelial dysfunction and of future cardiovascular events (CVE). We addressed the ability of 201Thallium single photon emission tomography (SPECT) to evidence and quantify MPH (MPH index = Hi) based on Markovian analysis of perfusion images.
Methods: 39 diabetic and 21 control patients were included to determine the optimal imaging parameters to assess MPH. A separate cohort of 46 diabetic and 19 control patients was used to validate Hi diagnostic and prognostic values.
Results: Diabetes (p=0.003), Butteworth filter parameters (p=0.0001), and body weight (p=0.002) were associated to Hi variations. Stress images applying a Butterworth filter with cut-off/roll-off values of 0.3/20 offered the best compromise between MPH detection and image quality: Hi=0.53+0.10 in diabetic versus 0.64+0.09 in control patients (p=0.0004); area under the ROC-curve = 0.77+0.06 for identifying diabetic from control subjects. In the validation cohort, Hi was also lower in diabetic (0.55+0.01) than in control subjects (0.66+0.02, p=0.003), and accurately identified the 2 populations with an area under the ROC-curve of 0.78±0.06. At follow-up (13+4 months), CVEs occurred in 4/46 diabetic patients. Hi was 0.41+0.01 in patients with CVEs versus 0.56+0.09 in patients without CVEs (p=0.005). The occurrence of future events was 4/16 (25%) and 0/30 (0%) in patients with Hi<0.50 and Hi>0.50 respectively (p=0.02).
Conclusion: Our results first demonstrate that Markovian analysis of 201Thallium-SPECT stress images (with 0.3/20 Butterworth filter) allows detection and quantification of MPH. This technique seems promising for diagnosis and prognosis purpose in selected high-risk subjects.
INTRODUCTION
Coronary atherosclerotic plaque disruption, with superimposedthrombosis, is the main cause of acute coronary syndromes (ACS) and sudden death [1]. In terms of prognosis, the main questionis therefore why life-threateningthrombosis suddenly complicates atherosclerosis. The composition and vulnerability of atheromatous plaque are the most important determinants of thrombus-mediated ACS [2]. Lipid-rich soft plaques are indeed more dangerous than collagen-richhard plaques because they are prone to ruptureand highly thrombogenic. As a matter of fact, even if the more stenotic and calcified lesions more frequently progress to total occlusion, non-obstructiveplaques lead to coronary occlusiontwice more frequently [1]. First, because smaller plaques by far outnumber obstructive plaques, second, because smallerplaques are more likely to lead to severe ACS in case of abrupt occlusion, as they areless frequently associated with protective collateral circulation. Thus, acute myocardial infarction (AMI) most frequently results from mild to moderate stenoses, which are not detectable by routine tests such as stress ECG, myocardial perfusion imaging, or echocardiography, as they are not responsible for myocardial ischemia [1,3]. So far, a reliable independent and non invasive predictor of plaque rupture has failed to emerge [4].
On the other hand, endothelium plays a critical role in vascular homeostasis by secreting substances both regulating vascular tone, platelet activity, and coagulation, and influencing vascular inflammation, cell migration and proliferation [1,2]. Subjects with coronary artery disease (CAD) and those with risk factors typically demonstrate endothelial dysfunction [5]. Although the extent of this dysfunction appears to correlate with the traditional risk factor “burden,” there is considerable heterogeneity in the magnitude of dysfunction between individuals with similar risk factor profiles [6]. Therefore, endothelial vasodilator function, that reflects the overall impact of these multiple environmental and genetic factors on the vasculature, could potentially serve as a useful diagnostic and prognostic tool as recently demonstrated
by Halcox et al. [3]. In the clinical setting, diabetes is an archetype of changes in microvascular architecture and function, with abnormal capillary permeability, subendothelial matrix fibrosis, and capillary rarefaction, resulting in reduced coronary blood flow reserve, even in the absence of obstructive CAD [7]. Hyperglycaemia also promotes endothelial dysfunction and ventricular hypertrophy, enhances leukocyte adhesion, increases albumin permeability, and impairs fibrinolysis [7], all these mechanisms contributing to macro- and microvascular complications of diabetes.
Myocardial perfusion imaging (MPI) using single photon emission computed tomography (SPECT) is widely used for the diagnosis of CAD [8] and is a powerful predictor of future coronary events [9-11]. The most important predictive variable is the extent of inducible ischemia [12], but other predictors are increased lung uptake of 201Thallium [13], stress-induced ventricular dilatation [14] and left ventricular ejection fraction [15, 16]. Markers of left ventricular dysfunction rather predict cardiac deaths, while ischemia rather predicts ischemic events [16, 17]. Finally, MPI is of incremental prognostic value over clinical, exercise ECG and coronary angiography data, patients with abnormal MPI having a high major event rate (6.7%/year), while normal MPI is associated with good clinical outcome [18]. However, no study has so far specifically assessed the ability of SPECT-MPI to evidence coronary endothelial dysfunction. Conversely, positron emission tomography (PET) is able to evidence such dysfunction [19-22]: in high risk patients, resting coronary flow falls by 10-20% after inhibition of coronary endothelial nitric oxide production, without significant reduction in maximum coronary flow, thereby reflecting altered resting microvascular function [23–26]. Furthermore, endothelial dysfunction assessed by PET is associated with preclinical CAD [27] and future cardiac events [28, 29]. Recently, Gould and Johnson hypothesized that the visually apparent myocardial perfusion heterogeneity (MPH) seen on rest myocardial perfusion PET in some patients could be a manifestation of such coronary microvascular endothelial dysfunction [30].
Considering the potential diagnostic and prognostic interest of MPH as a surrogate marker of endothelial dysfunction, the high prevalence of such dysfunction in diabetic patients, and the absence of data regarding the ability of SPECT-MPI to reflect and quantify MPH, the present study aimed:
1. To demonstrate that 201Thallium-SPECT-MPI was able to evidence and quantify differences in MPH between diabetic patients and subjects with low level of cardiovascular risk factors and low likelihood of CAD, and to determine the optimal imaging parameters for this purpose (“optimization study”).
2. To validate these parameters on a different cohort of diabetic and non diabetic patients in terms of detection of myocardial heterogeneity and of occurrence of future cardiovascular events (“validation study”).
METHODS
Study population
Optimization study: The population consisted in 39 diabetic patients and 21 non diabetic patients with
low likelihood of CAD (control subjects) consecutively referred to the Nuclear Cardiology Laboratory of the University Hospital of Grenoble for detection of myocardial ischemia. Low likelihood of CAD was defined by the association of the 3 following criteria: no or atypical chest pain, pre-test likelihood of coronary artery disease < 5% (base upon age and conventional cardiovascular risk factors, according to the Diamond and Forester criteria), and normal myocardial perfusion SPECT by visual analysis.
Validation study: The population included to subsequently assess the clinical ability of 201
consisted in 48 high-risk patients from the ARCADIA registry. This registry included high risk patients with type 2 diabetes mellitus and satisfying to the following criteria: age below 85 years, no clinical history of CAD, no typical symptoms of angina pectoris, and presence of > 3 out of 13 classical clinical and biological prognostic indicators [31]. The control group consisted in 19 consecutive low-likelihood patients as above defined.
SPECT imaging protocol and analysis
Stress tests and SPECTs were performed according to the routine protocols in use in our institution as previously described [31, 32]. Briefly, at the end of stress (exercise test or dipyridamole injection 0.36 mg/kg over 4 minutes), 3.5 to 5 mCi of 201Thallium were injected intravenously, and initial gated images were recorded 10 minutes later. Three hours after the stress, 1 mCi (37.5 MBq) of 201Thallium was injected at rest with a new gated acquisition 15 minutes later (rest reinjection imaging). Images were acquired using a dual-head rotating digital gamma camera with a 180° circular orbit (32 projections). A uniform imaging pre-treatment for the reconstruction of raw MPI data was applied, and images were reconstructed with a Butterworth filter and reoriented to obtain transaxial sections of the left ventricle according to the three standard cardiac planes (DST-XLI, Sopha Medical, Paris, France). For the optimization study, and in order to assess the optimal image filtering protocol to evidence MPH and to enhance the detection of a potential difference heterogeneity between diabetic and control subjects, 5 different cut-off values (0.2 to 0.6) and 2 different roll-off values (10 and 20) of the Butterworth filter were applied, resulting in 10 sets of images for stress and rest sequences (0.2-10, 0.2-20, 0.3-10, 0.3-20…) for each patient. The optimal filtering reconstruction parameter determined during the optimization study was then applied for the validation study.
Myocardial Heterogeneity Index (Hi)
North-western University, Chicago, Illinois) and an automated analysis was performed as previously described by these authors [19, 33]. A 3-dimensional (3D) restructuring algorithm generated true short- and long-axis views from the transaxial section of the left ventricle initially acquired in 2D tomographic mode to minimize scatter. From circumferential profiles, 3D topographic views of the left ventricle were reconstructed showing relative regional activity distribution divided into lateral, inferior, septal, and anterior quadrant. Each topographic map consisted of 21 slices along the long axis of the left ventricle, every long-axis slice containing 64 radial pixels, representing equal angles around 360°. The 4 quadrant views contained 16 radial pixels each. Therefore, the absolute pixel size was N-by-M, where N is 1/21 of the base-to-apex distance (different for every patient) and M is 360°/64° (same for every patient). Activity was then normalized to the maximum 2% of pixels in the whole heart dataset, and Hi was finally calculated from these images using a Markovian analysis.
Markovian texture or homogeneity analysis characterizes an image by examining the probability that a pixel with a given intensity will have a neighbour with a different intensity, where Pd(m) is the probability that 2 adjacent pixels have intensity values that differ by m. For this study Hi is given by the equation:
Hi = ∑m [1/(1+m)2]Pd(m).
Each pixel can have a maximum of 8 neighbours: above, below, left, right, above left, above right, below left, and below right, where a complete topographic map is like the surface of a cylinder and “wraps” along the radial dimension. Then intensity of the image matrix is normalized to 1000. The basal 4 slices ant apical 2 slices are discarded, to minimize partial volume effect. Pixel with intensity values below 500 are reset to 500 (to eliminate myocardial scar) and pixels with intensity values above 850 are reset to 850, to free the markovian analysis from effects of the highest activity levels of normal myocardium. Theses limits further confine the homogeneity analysis to relative activity values ranging from 50% to
85% of maximum on each SPECT image, thereby the intensity values from 500 to 850 inclusive are scaled into an integer range of 35 levels so that each new intensity represents 1% of the range. That‘s why the homogeneity index is not greatly influenced by severe perfusion defects. Radial pixel size and, hence, heart size does not impact the calculation of the heterogeneity index:
Hi = Pd(0) + ¼ Pd(1) + 1/9 Pd(2) + 1/16Pd(3) + …
Therefore, the heterogeneity index, Hi, expresses as a single number the probability distribution of differences among neighbouring pixel units that is weighted for small differences among neighbouring pixel units with little influence on Hi by large differences due to severe discrete regional defects.
Therefore, Hi can have values between 0 (non inclusive) and 1 (inclusive). A value near 0 represents an image with a high probability that neighbouring pixels have intensity values that differ greatly, and therefore a high level of MPH. Conversely, a value close to 1 represents an image with a high probability that neighbouring pixels have similar intensity values, and therefore depicts a low level of MPH. Hi thus mathematically quantifies the intuitive notion of MPH (Figure 1).
Figure 1A : Schematic representation of the 4 heart quadrants used for heterogeneity analysis
Figure 1B: Examples of topographic maps obtained from myocardial perfusion imaging by the Pr Johnson software.
Statistical analysis
Continuous data are expressed as mean ± standard deviation and discrete data as number (percentage). Comparisons between continuous variables were performed using a Student t-test, a Mann & Whitney, or a Wilcoxon test. Discrete data were compared with an exact Fisher test. A multivariate ANOVA was performed to assess the effect of diabetes, baseline data, and the different filters on Hi values. A receiver operating characteristics (ROC) analysis was used to compare the ability of the different imaging and reconstruction modalities for identifying diabetic from control subjects. A Bland and Altmann analysis was performed to assess differences obtained with the different filtering modalities and to detect a systematical or a proportional bias, reflecting capability to objective mild difference in MPH. Survival curves were computed according to the Kaplan Meier and compared by a Logrank test.
Test were computed using the Statview 5.0 (SAS Institute Inc) and STATA® 10.0 (Timberlake Consultant Limited) software. A p value < 0.05 was considered as statistically significant.
RESULTS
Baseline data
Baseline characteristics of the study population are summarized table 1: control patients were younger than high risk diabetic patients and – by study design – had significantly less cardiovascular risk factors. Diabetic patients were also significatively heavier than control subjects. Only 18% of diabetic patients in the optimization cohort and 19% in the validation cohort had an abnormal thallium SPECT, 13 and 15% respectively having significant myocardial ischemia.
Table 1: Baseline data
Optimization cohort Validation cohort
Diabetic Control Diabetic Control
N 39 21 46 19
Age (Years) 64.5 ± 1.9 54.1± 3.3* 59.9±8.7 53.4±3.4#
Male sex 20 (51) 10 (48) 31 (67) 12 (63)
Weight (Kg) 80.0 ± 15.7 68.9 ± 17.5# 80.5 ± 17.9 70.1 ± 17.2#
Height (m) 1.69 + 0.09 1.71 + 0.11 1.67 ± 0.08 1.72 + 0.12
Body mass index (kg/m2) 28.1 + 6.1 23.6 + 4.1# 28.8 ± 6.0 23.7 + 4.3#
Number of risk factors 3.4 ± 0.2 0.4 ± 0.1# 2.7 ± 0.8 0 ± 0#
Family history of CAD 2 (5) 1 (5) 6 (13) 0 (0)
Active smoking 6 (15) 0 (0) 14 (30) 0 (0)
Dyslipidemia 31 (79) 2 (10)* 26 (57) 0 (0)
Hypertension 30 (77) 3 (14)* 37 (80) 0 (0)
Diabetes 39 (100) 0 46 (100) 0
Duration of diabetes (Years) 12.6 ± 8.3 - 13.9 ± 9.8 -
Microvascular disease 12 (31) 0 (0) 27 (59) 0 (0)
Myocardial perfusion imaging
Normal 28 (72) 21 (100) # 34 (74) 19 (100) #
Abnormal 11 (28) 0 (0) 12 (26) 0 (0)
Values are Number (%) except otherwise indicated. *: P < 0.05 and #: P < 0.01 versus diabetic patients
Optimization study
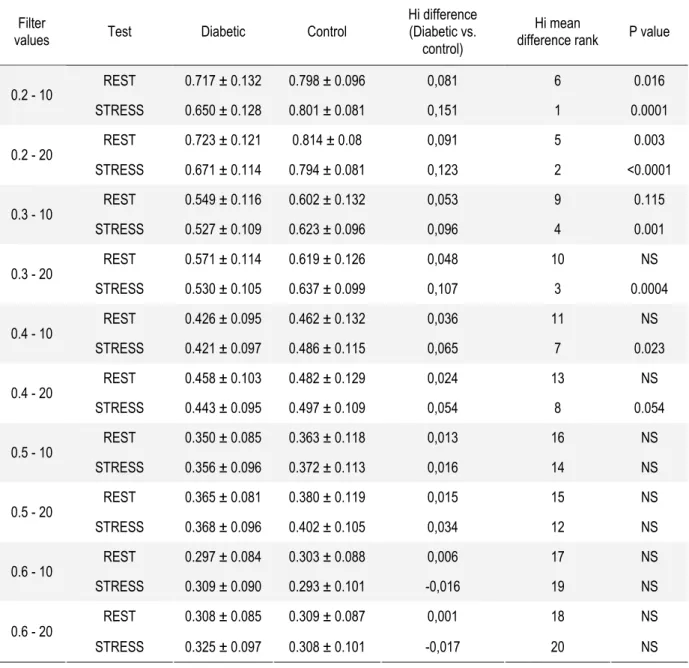
Hi obtained on rest and stress imaging in diabetic and control patients according to the different reconstruction filters applied are summarized table 2 and figure 2. Hi ranged from 0.297 to 0.723 and from 0.293 to 0.814 in diabetic and control subjects respectively. By multivariate analysis, diabetes, the type of filters applied, and weight were the 3 variables independently associated with Hi (p = 0.003, 0.0001, and 0.002 respectively). Hi were significantly lower in diabetic than in control subjects on stress imaging using the 0.2-10, 0.2-20, 0.3-10, 0.3-20, and 0.4-10 filters, and on rest imaging using the 0.2-10 and 0.2-20 filters. Stress Hi measured with the 0.2-10, 0.2-20, and 0.3-20 filters offered the best performances for identifying diabetic and control subjects, with mean differences in Hi of 0.15, 0.12, and
0.11 respectively. By ROC analysis, these 3 imaging modalities were the most performing to discriminate diabetic from control subjects according to Hi, with similar area under the curve of 0.83 ± 0.05, 0.82 ± 0.05, and 0.77 ± 0.06 respectively (NS) (Fig 3).
Table 2 : Hi on rest and stress imaging in diabetic and control patients according to the different filters
Filter
values Test Diabetic Control
Hi difference (Diabetic vs.
control)
Hi mean
difference rank P value
REST 0.717 ± 0.132 0.798 ± 0.096 0,081 6 0.016 0.2 - 10 STRESS 0.650 ± 0.128 0.801 ± 0.081 0,151 1 0.0001 REST 0.723 ± 0.121 0.814 ± 0.08 0,091 5 0.003 0.2 - 20 STRESS 0.671 ± 0.114 0.794 ± 0.081 0,123 2 <0.0001 REST 0.549 ± 0.116 0.602 ± 0.132 0,053 9 0.115 0.3 - 10 STRESS 0.527 ± 0.109 0.623 ± 0.096 0,096 4 0.001 REST 0.571 ± 0.114 0.619 ± 0.126 0,048 10 NS 0.3 - 20 STRESS 0.530 ± 0.105 0.637 ± 0.099 0,107 3 0.0004 REST 0.426 ± 0.095 0.462 ± 0.132 0,036 11 NS 0.4 - 10 STRESS 0.421 ± 0.097 0.486 ± 0.115 0,065 7 0.023 REST 0.458 ± 0.103 0.482 ± 0.129 0,024 13 NS 0.4 - 20 STRESS 0.443 ± 0.095 0.497 ± 0.109 0,054 8 0.054 REST 0.350 ± 0.085 0.363 ± 0.118 0,013 16 NS 0.5 - 10 STRESS 0.356 ± 0.096 0.372 ± 0.113 0,016 14 NS REST 0.365 ± 0.081 0.380 ± 0.119 0,015 15 NS 0.5 - 20 STRESS 0.368 ± 0.096 0.402 ± 0.105 0,034 12 NS REST 0.297 ± 0.084 0.303 ± 0.088 0,006 17 NS 0.6 - 10 STRESS 0.309 ± 0.090 0.293 ± 0.101 -0,016 19 NS REST 0.308 ± 0.085 0.309 ± 0.087 0,001 18 NS 0.6 - 20 STRESS 0.325 ± 0.097 0.308 ± 0.101 -0,017 20 NS
Figure 2 : Box graph depicting Hi calculated from stress images for the different imaging reconstruction protocols in diabetic (white boxes) and control (dark boxes) subjects. For P value, see Table 2.
Figure 3 : ROC analysis depicting the ability of the 3 most performing reconstruction protocol to identify diabetic from control subject base upon Hi measurement.
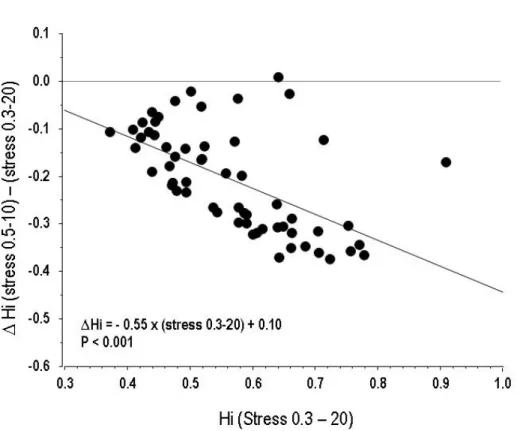
Stress images using the 0.3-20 Butterworth filter (stress 0.3-20) were therefore chosen for the validation study, as it combined a high performance for MPH quantification (without significant difference with 0.2-10 and 0.2-20 filters) and practicability, as it was the one currently used in our Laboratory for MPI. A Bland and Altmann analysis was performed to assess differences between the 0.3-20 filter and the 0.5-10 filter, another filter currently used for MPI: the slope of the regression equation of ∆Hi [i.e., (stress 0.5-20 Hi) – (stress 0.3-10 Hi)] plotted as a function of stress 0.3-20 Hi was -0.55 (p < 0.001), demonstrating a proportional bias between these two filters. This bias reflects a better sensitivity of the 0.3-20 filter to evidence mild levels of MPH (i.e., subjects with Hi close to 1) when compared to stress 0.5-10 (Figure 4).
Figure 4: Graph representing the individual differences between Hi obtained with the 0.3-20 and 0.5-10 Butterworth filters on stress images, plotted as a function of stress 0.3-20 Hi according to the method proposed by Bland and Altmann. This analysis evidence a systematical bias between the two method (slope = - 0.55, p<0.001)reflecting a better capability of the 0.3-20 filter to evidence mild levels of perfusion heterogeneity (i.e., subjects with Hi close to 1) when compared to 0.5-10.
Validation study
In the validation cohort, Stress 0.3-20 Hi was also significantly lower in diabetic than in control subjects (0.55 + 0.01 vs. 0.66 + 0.02 respectively, p = 0.003). This difference remained statistically significant after adjustment on body weight (P < 0.001), confirming the ability of 201Tl-SPECT to evidence higher MPH in diabetic than in control subjects, with a mean difference in Hi of 0.11 + 0.01. Area under the ROC curve for identifying diabetic high-risk from control subjects according to stress 0.3-20 Hi was 0.78 ± 0.06, identical to that found in the optimization study (P=NS).
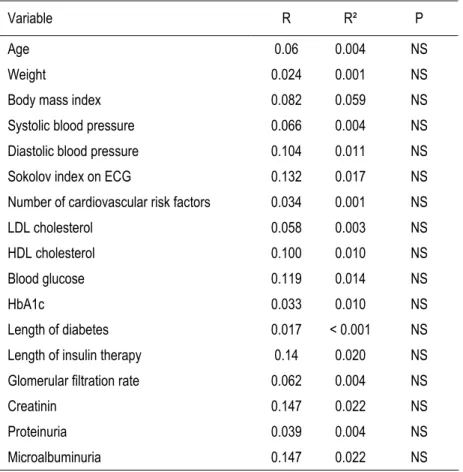
When assessing the potential correlation between stress 0.3-20 Hi and clinical and biological parameters that might be responsible for MPH (i.e., classical risk factors, duration and severity of diabetes, microvascular disease), we found that none of the tested variables significantly correlated with Hi (Table 3).
Table 3: Correlations between Hi and clinical and biological data in high-risk diabetic patients
Variable R R² P
Age 0.06 0.004 NS
Weight 0.024 0.001 NS
Body mass index 0.082 0.059 NS
Systolic blood pressure 0.066 0.004 NS
Diastolic blood pressure 0.104 0.011 NS
Sokolov index on ECG 0.132 0.017 NS
Number of cardiovascular risk factors 0.034 0.001 NS
LDL cholesterol 0.058 0.003 NS
HDL cholesterol 0.100 0.010 NS
Blood glucose 0.119 0.014 NS
HbA1c 0.033 0.010 NS
Length of diabetes 0.017 < 0.001 NS
Length of insulin therapy 0.14 0.020 NS
Glomerular filtration rate 0.062 0.004 NS
Creatinin 0.147 0.022 NS
Proteinuria 0.039 0.004 NS
At a mean follow-up of 13 + 4 months, 4/46 diabetic patients experienced a cardiovascular event (1 fatal MI, 2 ACS followed by coronary angioplasty, and 1 ischemic stroke). Hi was significantly lower in patients with than in patients without event: 0.41 + 0.01 vs. 0.56 + 0.09 (p = 0.005). At a cut-off threshold of 0.50, Hi was able to predict the occurrence of future events with a sensitivity of 100%, a specificity of 71.4%, a positive predictive value of 25%, a negative predictive value of 100%, and an accuracy of 73.9%: 4/16 patients (25%) with Hi < 0.50 experienced such an event compared to 0/30 (0%) for patients with Hi > 0.50 (p = 0.01, Figure 5). Conventional analysis of MPI (i.e., normal or abnormal) was also of prognostic value, event rate being 2.9% (1/34) and 25% (3/12) in patients with a normal and an abnormal perfusion scan respectively (p<0.01) (Figure 5 and 6). Table 4 summarizes the prognostic accuracy of both analyses.
Figure 5 : Kaplan Meier cardiovascular event free survival curves in diabetic patient with Hi > 0.50 (bold line) and < 0.50 (dotted line). Error bar represent 95% confidence intervals. P=0.02
Figure 6: Kaplan Meier cardiovascular event free survival curves in diabetic patient with normal MPI (bold line) and diabetic patients with abnormal MPI (dotted line). Error bar represent 95% confidence intervals. P=0.04. (MPI: myocardial perfusion imaging)
Table 4: Prognostic accuracy of perfusion heterogeneity (defined by Hi < 0.50) and perfusion defects on MPI for the prediction of future cardiovascular events in the 46 diabetic patients of the validation study.
Perfusion Heterogeneity Perfusion defect
Event rate when present 4/16 (25%) 3/12 (25%)
Event rate when absent 0/30 (0%) 1/34 (2.9%)
Sensitivity 1.00 0.75
Specificity 0.71 0.78
Positive predictive value 0.25 0.25
Negative predictive value 1.00 0.97
Prognostic accuracy 0.74 0.78
Positive likelihood ratio 3.5 3.5
Negative likelihood ratio 0.0 0.3
MPH according to results of the SPECT-MPI
Out off the 85 diabetic patients pooled from the optimization and validation studies, MPI was abnormal in 23 (27%) and normal in 62 (73%). Stress 0.3-20 Hi was not statistically different in diabetic patients with normal and abnormal perfusion scan: 0.54 + 0.12 versus 0.52 + 0.11 respectively (P=NS). Conversely, Hi in the pooled control subjects (N = 40) was 0.69 + 0.05, significantly higher than Hi in diabetic subjects both with normal and abnormal MPI (P < 0.001) (Figure 7).
Figure 7: Bow plot depicting Hi values (from Butterworth 0.3/20 stress images) in the 40 control subjects (white box), 62 diabetic patients with normal MPI (gray box), and 23 diabetic patients with abnormal MPI (dashed box) from both optimization and validation studies. (MPI = myocardial perfusion imaging).
DISCUSSION
The main findings of our study are that: 1) a Markovian analysis applied to stress Thallium-201 SPECT myocardial perfusion imaging - reconstructed with a Butterworth filter with cut-off and roll-off values of 0.3 and 20 respectively - allows to evidence quantitative differences in MPH between high-risk diabetic patients and low-risk control subjects; 2) calculation and diagnostic accuracy of Hi is reproducible in two different cohorts of diabetic and control subjects; 3) Hi using a cut-off threshold of 0.50 seems of promising prognostic value for the prediction of future cardio-vascular events in high risk patients.
Spatial MPH and its relation to endothelial dysfunction
Apart from the well known endocardial to epicardial transmural myocardial perfusion gradient, there is also a considerable variability of coronary flow in each myocardial layer under stable normal physiological conditions, and experimental evidence suggests that this spatial perfusion heterogeneity extends down to the level of microcirculation [34]. It has been proposed that this micro-heterogeneity may reflect differences in O2 and substrate supply, and may represent myocardial hibernation at a “local” level [34]. More recently, Gould and co-workers suggested that resting MPH also reflects coronary microvascular dysfunction [19]: in their study, MPH - objectively quantified using Markovian homogeneity analysis of Rubidium-82 PET rest myocardial perfusion imaging - was a powerful independent predictor of mild stress-induced perfusion abnormalities and thus consistent with coronary microvascular dysfunction. Endothelial dysfunction is considered as a marker of vascular disease and represents a link between complex phenomena at the molecular level and vascular pathology of atherosclerosis [35]. It refers to a wide spectrum of coronary vasomotor pathophysiology associated with preclinical and clinical CAD that may involve epicardial arteries or microvasculature, various vasoactive mediators, and different pathophysiological mechanisms [19]. In type 2 diabetes and insulino-resistance, these mechanisms include an increased number of vascular stressors,
pro-inflammatory cytokines, pro-inflammatory markers, and adipocyte-derived adipokines [36]. Diabetes being considered as a human model for endothelial dysfunction, diabetic patients were therefore included in the present study and compared to low cardiovascular risk control subjects for assessing the potential of SPECT-MPI for evidencing MPH as a surrogate of endothelial dysfunction.
Diagnostic value of myocardial SPECT-MPI for assessing MPH
Our study first shows that 201Thallium-SPECT-MPI allows to routinely evidence, analyse, and quantify MPH in man, as we found significant differences in Hi between high-risk diabetic and low-risk control subjects. In addition to confirming the concept of MPH, our results also point out the fact that Hi is greatly influenced by image processing, especially parameters of the Butterworth filters applied for image reconstruction. The Butterworth filter used in our validation study is one of the most common filters applied for clinical MPI. We demonstrated that it also was one of the most performing to evidence Hi differences. Changes in cut-off value from 0.3 to 0.5 and of roll-off values from 20 to 10 resulted in dramatic differences in MPH perception and quantification. The presence of a proportional bias in Hi measurement between these 2 filters (by Bland-Altmann analysis), shows that changes in filters not only affects the absolute value of Hi, but also the sensitivity of image processing for detecting mild MPH. It emphasizes the need for technical uniformisation between nuclear laboratories and even in a single laboratory over time for allowing longitudinal follow-up of patients. Finally, the very similar results found with the 0.3-20 filter in the optimization and validation cohorts suggest that this technique is reproducible.
We also found that stress MPI was more accurate than rest MPI to evidence differences in Hi between diabetic and control subjects. We can hypothesize that in myocardial regions supplied by normally functional vessels, stress mediated flow velocity and endothelial shear stress result in vasodilatation and, subsequently, increase in blood flow and Thallium uptake. As, in opposition, such vasodilator
response is obliterated in regions with local endothelial dysfunction, it is non surprising that stress images better show spatial heterogeneity as a surrogate of endothelial dysfunction. In other words, endothelial dysfunction, even in the absence of macrovascular CAD, may be responsible for reduction in appropriately enhance coronary flow, leading to “local” myocardial ischemia [37].
Gould and co-workers found that PET resting homogeneity index and its rest-to-stress change were powerful predictors of stress-induced perfusion abnormalities, separately from and independently of standard risk factors [19]. We also find that MPH could not solely be explained by individual cardiovascular risk profile, except diabetes. Indeed we did not find any significant correlation between Hi and other conventional risk factors or markers of microvascular disease (such as proteinuria or retinopathy). These results are consistent with the hypothesis that MPH is multifactorial and probably of additive and independent diagnostic and prognostic value for evaluation of microvascular disease in high risk patients. We also demonstrated that patient overweight or obesity - and subsequent potential diffusion artifact – could not explain the differences observed in Hi between diabetic and non diabetic subjects, these difference remaining statistically significant after adjustement on body weight.
Prognostic value of MPH
Several studies support an association between endothelial dysfunction and increased coronary risk [29, 38, 39]. In the study by Schindler & al. for example, attenuated or absent PET flow responses to cold pressure test in patients with angiographically normal coronary vessels were associated with a 32% incidence of coronary events (cardiac death, nonfatal myocardial infraction, acute coronary syndromes, revascularization, and stroke) over 66 months compared with a 4.5% incidence in patients with normal flow response [39]. We also find that MPH was predictive of future cardiovascular events, the positive likelihood being 3.5 in case of Hi < 0.50 and the negative likelihood being 0 in case of Hi > 0.50. Our results also showed that the prognostic value of MPH was similar to that of the presence of
perfusion defects (a well established prognosis marker [17]) with similar prognostic accuracies of 0.74 and 0.78 respectively (P=NS). Our study was not powerful enough to assess whether MPH was of additive prognostic value over the presence of « conventional » perfusion defects. However, the absence of significant difference in Hi between diabetic patients with normal and abnormal SPECT-MPI (0.54 and 0.52 respectively, p=NS), suggests that the pathophysiological information provided by MPH analysis is different from, and therefore incremental over, that offered by conventional perfusion analysis. It is accordingly reasonable to hypothesize that the prognostic information provided by MPH might also be different from and incremental over that of the presence of conventional ischemia. Larger prospective studies are needed to specifically assess this issue.
Study limitations
The present study is a small size pilot study which aimed to prove the concept that SPECT-MPI allowed to evidence and quantify MPH using 201Thallium in diabetic patients when compared to control subjects. It does not allow to extent the present findings to other populations of patients (i.e., non diabetic patients with high cardiovascular risk profile) nor to other radiopharmaceuticals (i.e., sestamibi or tetrofosmin). Whether conventional stress testing or vasodilators (dipyridamole or adenosine) give similar results in terms of detection of MPH also remains to be clarified. Finally, as already mentioned, the future issue to be addressed is the additive diagnostic and prognostic value of MPH over clinical, biological, stress-test, and conventional perfusion imaging data.
Conclusions
Our clinical study confirms the concept of MPH in high-risk diabetic patients and the ability of routine 201Thallium-SPECT-MPI to quantify such heterogeneity, with promising diagnostic and prognostic
perspectives. Larger prospective studies are needed to determine the potential impact of this technique on management and prognosis of patients.
REFERENCES
1. Falk E, Shah PK, Fuster V. Coronary plaque disruption. Circulation 1995;92:657-71
2. Libby P, Theroux P. Pathophysiology of Coronary Artery Disease. Circulation. 2005;111:3481-8 3. Halcox JP, Schenke WH, Zalos G, Mincemoyer R, Prasad A, Waclawiw MA, Nour KR, Quyyumi AA.
Prognostic value of coronary vascular endothelial dysfunction.Circulation. 2002;106:653-8
4. Sharif F, Murphy RT. Current status of vulnerable plaque detection. Cath. Cardiovasc. Interv. 2010;75:135–44
5. Vanhoutte PM. Endothelial dysfunction:the first step toward coronary arteriosclerosis. Circ J. 2009;73:595-601
6. Gould KL, Martucci JP, Goldberg DI & al. Short-term cholesterol lowering decreases size and severity of perfusion abnormalities by positron emission tomography after dipyridamole in patients with coronary artery disease. A potential noninvasive marker of healing coronary endothelium. Circulation. 1994;89:1530-8
7. Aneja A, Tang WH, Bansilal S, Garcia MJ, Farkouh ME. Diabetic cardiomyopathy:insights into pathogenesis, diagnostic challenges, and therapeutic options. Am J Med 2008;121:748-57
8. Underwood SR, Anagnostopoulos C, Cerqueira M et al. British Nuclear Cardiology Society;British Nuclear Medicine Society;Royal College of Physicians of London;Royal College of Radiologists. Imperial College London, Royal Brompton Hospital, London, UK. Myocardial perfusion scintigraphy:the evidence. Eur J Nucl Med Mol Imaging. 2004;31:261-91
9. Brown KA. Prognostic value of thallium-201 myocardial perfusion imaging. A diagnostic tool comes of age. Circulation 1991;83:363–81
10. Gould KL Assessing progression or regression of CAD:The role of perfusion imaging J Nucl Cardiol 2005;12:625-38
11. Brown KA. Prognostic value of myocardial perfusion imaging:state of the art and new developments. J Nucl Cardiol 1996;3:516–37
12. Ladenheim ML, Pollock BH, Rozanski A, et al. Extent and severity of myocardial hypoperfusion as predictors of prognosis in patients with suspected coronary artery disease. J Am Coll Cardiol 1986;7:464–71
13. Gill JB, Ruddy TD, Newell JB, Finkelstein DM, Strauss HW, Boucher CA. Prognostic importance of thallium uptake by the lungs during exercise in coronary artery disease. N Engl J Med 1987;317:1486–9
14. Weiss AT, Berman DS, Lew AS, et al. Transient ischemic dilation of the left ventricle on stress thallium-201 scintigraphy:a marker of severe and extensive coronary artery disease. J Am Coll Cardiol 1987;9:752–9
15. Johnson LL, Verdesca SA, Aude WY, et al. Postischemic stunning can affect left ventricular ejection fraction and regional wall motion on post-stress gated sestamibi tomograms. J Am Coll Cardiol 1997;30:1641–8
16. Sharir T, Germano G, Kang X, et al. Prediction of myocardial infarction versus cardiac death by gated myocardial perfusion SPECT:risk stratification by the amount of stress-induced ischemia and the poststress ejection fraction. J Nucl Med 2001;42:831–47
17. Hachamovitch R, Berman DS, Shaw LJ, et al. Incremental prognostic value of myocardial perfusion single photon emission computed tomography for the prediction of cardiac death:differential stratification for risk of cardiac death and myocardial infarction. Circulation 1998;97:535–43
18. Iskandrian AS, Chae SC, Heo J, Stanberry CD, Wasserleben V, Cave V. Independent and incremental prognostic value of exercise single-photon emission computed tomographic (SPECT) thallium imaging in coronary artery disease. J Am Coll Cardiol 1993;22:665–70
19. Johnson NP, Gould LK. Clinical evaluation of a new concept:resting myocardial perfusion heterogeneity quantified by markovian analysis of PET identifies coronary microvascular dysfunction and early artherosclerosis in 1,034 subjects. J Nucl Med. 2005;46:1427-37
20. el-Tamimi H, Mansour M, Wargovich TJ, et al. Constrictor and dilator responses to intracoronary acetylcholine in adjacent segments of the same coronary artery in patients with coronary artery disease:endothelial function revisited. Circulation 1994;89:45–51
21. Penny WF, Rockman H, Long J, et al. Heterogeneity of vasomotor response to acetylcholine along the human coronary artery. J Am Coll Cardiol 1995;25:1046–55
22. Kuo L, Davis MJ, Chilian WM. Longitudinal gradients for endothelium-dependent and -independent vascular responses in the coronary microcirculation. Circulation 1995;92:518–25
23. Shiode N, Morishima N, Nakayama K, Yamagata T, Matsuura H, Kajiyama G. Flow-mediated vasodilation of human epicardial coronary arteries:effect of inhibition of nitric oxide synthesis. J Am Coll Cardiol 1996;27:304 –10