Science Arts & Métiers (SAM)
is an open access repository that collects the work of Arts et Métiers Institute of
Technology researchers and makes it freely available over the web where possible.
This is an author-deposited version published in: https://sam.ensam.eu Handle ID: .http://hdl.handle.net/10985/10196
To cite this version :
Tales CARVALHO RESENDE, Tudor BALAN, Farid ABED-MERAIM, Salima BOUVIER, Simon-Serge SABLIN - Application of a dislocation based model for Interstitial Free (IF) steels to typical stamping simulations - American Institute of Physics Conf. Proc. - Vol. 1252, p.1339-1346 - 2010
Any correspondence concerning this service should be sent to the repository Administrator : [email protected]
Application of a dislocation based model for Interstitial Free
(IF) steels to typical stamping simulations
T. Carvalho Resende
a, b, c, T. Balan
b, F. Abed-Meraim
b, S. Bouvier
c, S-.S. Sablin
aa
RENAULT, Materials Engineering Department, 1 avenue du Golf, 78288 Guyancourt, France
bLPMM, Arts et Métiers ParisTech, Metz Campus, 4 rue Augustin Fresnel, 57078 Metz, France cLPMTM, 99 avenue J. B. Clément, 93430 Villetaneuse, France
Abstract. With a view to environmental, economic and safety concerns, car manufacturers need to design lighter and safer
vehicles in ever shorter development times. In recent years, High Strength Steels (HSS) like Interstitial Free (IF) steels which have higher ratios of yield strength to elastic modulus, are increasingly used for sheet metal parts in automotive industry to meet the demands. Moreover, the application of sheet metal forming simulations has proven to be beneficial to reduce tool costs in the design stage and to optimize current processes. The Finite Element Method (FEM) is quite successful to simulate metal forming processes but accuracy largely depends on the quality of the material properties provided as input to the material model. Common phenomenological models roughly consist in the fitting of functions on experimental results and do not provide any predictive character for different metals from the same grade. Therefore, the use of accurate plasticity models based on physics would increase predictive capability, reduce parameter identification cost and allow for robust and time-effective finite element simulations.
For this purpose, a 3D physically based model at large strain with dislocation density evolution approach was presented in IDDRG2009 by the authors [1]. This model allows the description of work-hardening’s behavior for different loading paths (i.e. uni-axial tensile, simple shear and Bauschinger tests) taking into account several data from microstructure (i.e. grain size, texture, etc…). The originality of this model consists in the introduction of microstructure data in a classical phenomenological model in order to achieve work-hardening’s predictive character for different metals from the same grade. Indeed, thanks to a microstructure parameter set for an Interstitial Free steel, it is possible to describe work-hardening behavior for different loading paths of other IF steels by only changing the mean grain size and the chemical composition. During sheet metal forming processes local material points may experience multi-axial and multi-path loadings. Before simulating actual industrial parts, automotive manufacturers use validation tools – e.g. the Cross-Die stamping test. Such typical stamping tests enable the evaluation of a complex distribution of strains.
The work described is an implementation [2] of a 3D dislocation based model in ABAQUS/Explicit and its validation on a Finite Element (FE) Cross-Die model. In order to assess the performance and relevance of the 3D dislocation based model in the simulation of industrial forming applications, the results of thinning profiles predicted along several directions and the strain distribution were obtained and compared with experimental results for IF steels with grain sizes varying in the 8-22µm value range.
Keywords: Sheet metal forming, Interstitial Free steels, Dislocation based model, Cross-Die test, Finite Element Method PACS: 46.15.-x
1.
INTRODUCTION
1.1
Background
Common phenomenological models roughly consist in the fitting of functions on experimental results. They only provide crude tools due to the fact that their parameters are unable to predict the work-hardening behavior of other materials from the same grade. Therefore it is vital to use accurate plasticity models based on physics. To reach this goal, the authors proposed a 3D physically based work-hardening model at large strain with dislocation density evolution approach [1]. This model allows the description of the work-hardening behavior for different
loading paths (uni-axial tensile test, simple shear and Bauschinger shear tests until different amounts of true strain) taking into account several data from microstructure (i.e. grain size, texture, etc...).
The predictive character of the model is achieved through a set of physically-based parameters (k1, k2, λ and n0)
which is specific to metals from the same grade, where:
• k1 stands for the dislocation storage rate which results in hardening.
• k2 stands for the dislocation annihilation rate which results in softening.
• λ stands for the dislocation spacing.
• n0 is the critical number of dislocations that have been stopped at the boundary on a given slip band.
This parameter set enables the work-hardening’s behavior prediction of other metals from the same grade by only modifying the mean grain size D and the chemical composition.
2.
MATERIALS
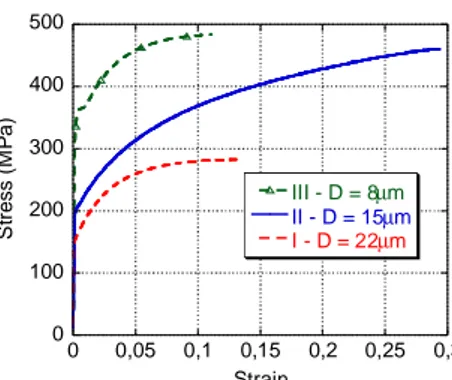
The chemical composition in wt. % and the mechanical properties of the investigated IF steels are presented in Table 1 and Table 2, respectively. Experimental uni-axial tensile tests along rolling direction are presented in
Erreur ! Source du renvoi introuvable..
TABLE 1. Chemical composition of the investigated IF steels (wt. %)
Material C S P Si Mn Cr Mo Ni Cu Al Ti
I 0.007 0.004 0.012 0.006 0.1 0.011 0.008 0.007 0.002 0.036 0.017 II 0.007 0.007 0.049 0.006 0.453 0.01 0.008 0.007 0.007 0.042 0.015 III 0.072 0.008 0.015 0.122 1.063 0.011 - 0.012 0.003 0.036 0.012
TABLE 2. Mechanical properties of the investigated IF steels.
Material Thickness
(mm) 0
Y
(MPa)Rm
(MPa) Ag% A80% 0°
r
(at 20%) ° 45r
(at 20%) ° 90r
(at 20%) n (between 10% and 20%) Mean grain size D (µm) I 0.75 153 282 28.6 51.7 2.28 1.76 2.72 0.25 22 II 0.6 205 355 23 35.8 1.45 1.57 1.95 0.22 15 III 1.62 351 483 15.5 29.7 0.64 1.26 0.96 0.15 83.
EXPERIMENTAL PROCEDURE
3.1
Uni-axial tensile test and Bauschinger simple shear test
In order to obtain initial anisotropy, r-values are determined from uni-axial tensile test specimens cut out at different orientations, 0°, 45° and 90° to the rolling direction of sheet. These tests were realized in quasi-static regime at room temperature with constant strain rate in a tensile machine INSTRON 5582 with an HRD extensometer system piloted by BLUEHILL 2.Bauschinger simple shear tests were realized at equivalent conditions in a SERMEES shear assembly implanted in a tensile machine INSTRON 5587.
All the experimental data used in the present study were pre-processed using home-made MATLAB routines. The stress versus strain experimental curves for uni-axial tensile and Bauschinger simple shear tests were first smoothed in order to filter the various noises due to the acquisition. The second step consisted in removing the elastic part. Indeed, identification and simulations were done in the framework of rigid-plastic behavior.
0 100 200 300 400 500 0 0,05 0,1 0,15 0,2 0,25 0,3 III - D = 8µm II - D = 15µm I - D = 22µm S tr e s s ( M P a ) Strain
FIGURE 1. Experimental uni-axial tensile tests along rolling direction of the investigated IF steels: uni-axial stress vs. logarithmic strain.
3.2
Cross-die test
The die design and blank configuration are shown in Erreur ! Source du renvoi introuvable.. An 800kN drawing hydraulic press is used with a blank holder force of 350kN. The square blank size has been chosen to be 300x300mm. The punch and die radii have values of 20mm and 14mm respectively. Punch, blank holder and die are made of uncoated hardened tool steel. The blanks were lubricated with grease and Teflon. Limited possible drawing depth is around 60mm for the given blanks. Experiments have been performed at a drawing speed of 60mm/s. FIGURE 2 shows a typical drawn blank.
FIGURE 2. Die and blank configuration (left) and Blank specimen after cross tool forming operation (right)
3.3
Strain and thickness measurement
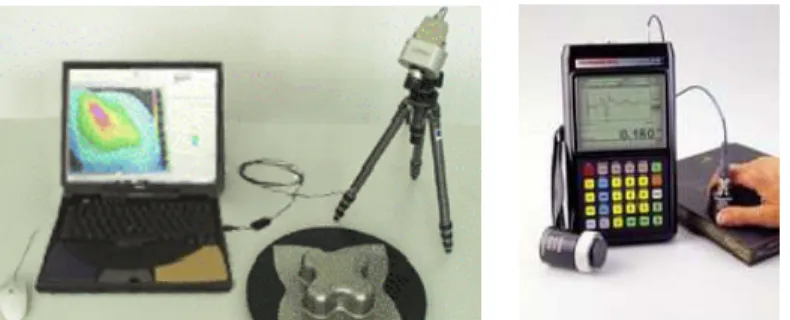
The blanks have been marked with a 2mm dotted pattern (FIGURE 2) and forming analyses have been performed with the ARGUS strain measurement system with strain accuracy of ±1% (FIGURE 3). It measures deformations in deep-drawn parts and calculates material strain using optical measurement techniques. ARGUS processes and visualizes the data gathered in order to obtain an image of the distribution of strains in the measured part.
The material thinning is measured along three directions (i.e. rolling direction RD, diagonal direction DD, transverse direction TD) as depicted in FIGURE 2 with the SOFRANEL thickness measurement system (FIGURE 3). Measurements are done every 10mm. This experimental setup is constituted by an ultrasonic transducer. The transducer is excited by a pulse/receiver (SOFRANEL 25 DL). Thickness is obtained in function of wave’s displacement velocity in the blank. Thickness accuracy is of ±0.01mm.
FIGURE 3. ARGUS equipment (left) and SOFRANEL 25 DL equipment (right)
4.
NUMERICAL PROCEDURE
4.1
Implemented hardening law
The model consists in a combination of isotropic and kinematic hardening contributions. Based on the von Mises criterion, the yield function
f
is given by:(
)
(
0)
0
φ
=
−
−
+
≤
f
σ
X
Y
R
, (1) whereX
denotes the back-stress variable related to kinematic hardening andR
a scalar variable describing the isotropic hardening.Y
0 is the initial yield strength which is a function of the chemical composition and the mean grain size D [3].φ
is a function of the Cauchy stressσ
given by:(
)
3
(
) (
)
´
:
´
2
−
=
−
−
φ
σ
X
σ
X
σ
X
. (2)The evolution equation for the kinematic hardening is given by an Armstrong-Frederick’s saturation law:
p
2
3
=
λ
X
C X
X satD -
C
XX ɺ
, (3)where
C
X andX
sat are material parameters.C
X characterizes the saturation rate ofX
andX
satcharacterizes the saturation value ofX
.D
p stands for the plastic strain rate andλ
ɺ
is the plastic multiplier. Hereafter,( )
stands for an objective derivative.According to [1] and [4], 1 0 2 0
( , ,
)
(
, , ,
,
)
λ
µ
=
=
X satC
f
b n
X
f M
b n D
, (4)where µ stands for the shear modulus, b for the magnitude of the Burgers vector and M is the Taylor factor and takes into account the texture development.
R
=
M
αµ ρ
b
, (5)where α is a constant and ρ is the dislocation density. Dislocation density evolution is given by:
(
1 2)
pd
M k
k
d
ρ
ρ
ρ
ε
=
−
. (6)According to [1] and [5], Eq. 5 is equivalent to a Voce rule in which:
3 2 4 1 2
(
,
)
(
, ,
, , , )
α µ
=
=
R satC
f M k
R
f M k k
b
, (7)where
C
R andR
satare Voce rule’s material parameters,R
sat being the asymptotic value of the isotropic hardening variableR
at infinitely large plastic strain andC
R controls the saturation rate of isotropic hardening.4.2
Work-hardening prediction
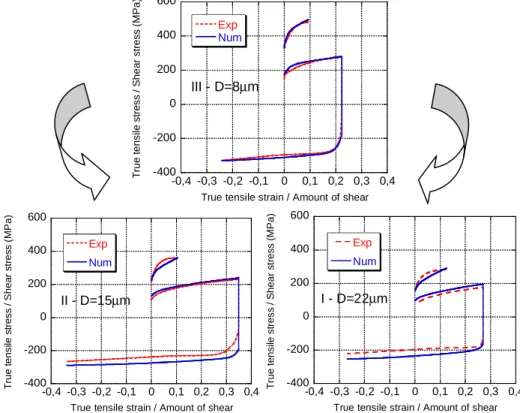
Physically-based parameters (k1, k2, λ and n0) were identified for an IF steel with mean grain size equal to 8µ m
(i.e. Material III). The identification of parameters was carried out on an uni-axial tensile test and a Bauschinger shear test. Then, work-hardening was predicted for other IF steels (i.e. Materials I and II) using the same physically-based parameters as input data and by only modifying the mean grain size D and the chemical composition. Results are given in FIGURE 4.
-400 -200 0 200 400 600 -0,4 -0,3 -0,2 -0,1 0 0,1 0,2 0,3 0,4 Exp Num III - D=8µm
True tensile strain / Amount of shear
T ru e t e n s ile s tr e s s / S h e a r s tr e s s ( M P a ) -400 -200 0 200 400 600 -0,4 -0,3 -0,2 -0,1 0 0,1 0,2 0,3 0,4 Exp Num
True tensile strain / Amount of shear
T ru e t e n s ile s tr e s s / S h e a r s tr e s s ( M P a ) II - D=15µm -400 -200 0 200 400 600 -0,4 -0,3 -0,2 -0,1 0 0,1 0,2 0,3 0,4 Exp Num
True tensile strain / Amount of shear
T ru e t e n s ile s tr e s s / S h e a r s tr e s s ( M P a ) I - D=22µm
FIGURE 4. Identification of a physically-based model described by an isotropic hardening with Voce law and a kinematic hardening with Armstrong and Frederick law (bottom) / Work-hardening prediction using IF steels physically based fitting
FIGURE 4 shows good agreement between theoretical and experimental results. However, the level of predicted stress in reverse loadings is higher (i.e. Materials I and II) although if it tends towards an accurate saturation value. This can be explained by the fact that this model is unable to describe some phenomena observed in reverse loadings consisting in dislocation disintegration followed by the formation of new dislocation walls.
5.
NUMERICAL PROCEDURE
5.1
FE model
The forming simulations have been performed with ABAQUS/Explicit. Due to symmetry, only ¼ of the part and tools have been meshed (FIGURE 5) – applied loads being scaled accordingly. The initial element size is approximately 1.5mm so that the aspect ratio of the elements is close to one. The blank was meshed using 23391 C3D8R elements. A blank size of 150x150mm has been used with a 90kN (≈ 350/4 kN) blank holder force. The friction coefficient is assumed to be 0.05. Drawing depths close to fracture (experiment) have been simulated. Blanks strain levels and thicknesses obtained from simulations are compared with those from experiments.
FIGURE 5. Cross-die FE model
6.
RESULTS AND DISCUSSION
6.1
Comparison between experimental and numerical strain signature
The Forming Limit Curve (FLC) was calculated by a Cayssials-type model [6]. A good representation of the strain signature generated by the Cross-Die test would contribute to achieve good comparison possibilities in order to improve the accuracy of numerical simulations. Andersson et al. [7] obtained an interpretation of the strain zones in this experiment (FIGURE 6). Based on this interpretation, FIGURE 7 reveals that a good agreement between numerical and experimental strain level is obtained for zones 1, 3, 4, 5. However, this model shows a lower capability in predicting possible strain localization that could occur at a critical location (i.e. zone 2). These results are exploited more in details through thickness distribution measurement.
FIGURE 7. Experimental (left) and simulated (right) strain signature for a drawn depth IF steel with mean grain size D=8µm (Material III).
6.2
Comparison between experimental and numerical thicknesses
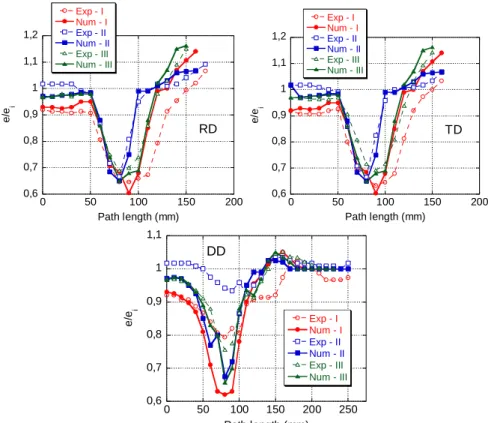
An excellent agreement between numerical and experimental thickness distributions is obtained along RD and TD for Materials II and III. However, it is not the case on DD, especially on a critical location such as zone 2 (i.e. path length ≈ 80mm) (FIGURE 8).
All simulations were performed using an isotropic yield criterion. However, it is well known that IF steels reveal pronounced anisotropic yield surfaces. Thus, the current choice of yield criterion could explain less accurate results for the prediction of thickness distribution along RD and TD for Material I and the discrepancies obtained for DD. Moreover, it is important to note that experimental measurements of thickness near critical locations such as zone 2 are subject to errors due to the difficulty of placing the transducer with accuracy.
0,6 0,7 0,8 0,9 1 1,1 1,2 0 50 100 150 200 Exp - I Num - I Exp - II Num - II Exp - III Num - III e /e i Path length (mm) RD 0,6 0,7 0,8 0,9 1 1,1 1,2 0 50 100 150 200 Exp - I Num - I Exp - II Num - II Exp - III Num - III e /e i Path length (mm) TD 0,6 0,7 0,8 0,9 1 1,1 0 50 100 150 200 250 Exp - I Num - I Exp - II Num - II Exp - III Num - III Path length (mm) e /e i DD
FIGURE 8. Experimental and numerical thickness distribution measured along three directions: rolling direction RD (top left), transverse direction TD (top right) and diagonal direction DD (bottom)
7.
CONCLUSIONS
In this work, a recently developed dislocation-based constitutive model has been implemented in ABAQUS/Explicit. Its parameters have been identified for an IF steel and then directly reused for two different IF steels, by adjusting only the grain size and initial yield stress. Applications to the cross-die stamping test have shown good overall agreement to experiments in terms of strain and thickness distributions. However, some differences appeared in “zone 2” and in the diagonal direction. This is probably due to the (neglected) initial anisotropy, as well as the complex behavior of IF steels after reverse deformation [8]. Thus, future work aims to an extended approach based on the physics of the dislocations [9].
8.
REFERENCES
1. S. Bouvier, T. Carvalho-Resende and S-.S. Sablin, “Work-hardening prediction using a dislocation based model for aluminium automotive alloys”, IDDRG 2009 Conference Proceedings, pp. 197-205.
2. B. Haddag, “Contribution à la modélisation de la mise en forme des tôles métalliques : application au retour élastique et à la localisation”, Ph.D. Thesis, Arts et Métiers ParisTech, 2007.
3. F.B. Pickering, “Structure-Property Relationships in Steels”, in Constitution and Properties of Steels, edited by F.B. Pickering, Materials Science and Technology A 7, 1992, p. 47.
4. C.W. Sinclair, W. J. Poole and Y. Bréchet “A model for the grain size dependent work hardening of copper” Scripta Materialia 55 (2006), pp. 739-742.
5. H. Mecking and Y. Estrin “Microstructure-related constitutive modelling of plastic deformation”, 8th Risø Conference Proceedings (1987) , pp. 123.
6. F. Cayssials, X. Lemoine, “Predictive model of FLC (Arcelor model) upgraded to UHSS steels”, IDDRG 2005 Conference. 7. A. Andersson, P. Thilderkvist, M. Liljengren “Experimental evaluation of strains in the tension-compression using a new tool
geometry, X-Die” Journal of Materials Processing Technology 200 (2008), pp.1-11.
8. S. Bouvier, B. Gardey, H. Haddadi, C. Teodosiu “Characterization of the strain-induced plastic anisotropy of rolled sheets by using sequences of simple shear and uni-axial tensile tests” Journal of Materials Processing Technology 174 (2006), pp. 115-126.
9. E.F. Rauch, J.J. Gracio and F. Barlat “Work-hardening model for polycrystalline metals under strain reversal at large strains” Acta Materialia 55 (2007), pp. 2939-2948.