HAL Id: tel-02316897
https://tel.archives-ouvertes.fr/tel-02316897
Submitted on 15 Oct 2019HAL is a multi-disciplinary open access archive for the deposit and dissemination of sci-entific research documents, whether they are pub-lished or not. The documents may come from teaching and research institutions in France or abroad, or from public or private research centers.
L’archive ouverte pluridisciplinaire HAL, est destinée au dépôt et à la diffusion de documents scientifiques de niveau recherche, publiés ou non, émanant des établissements d’enseignement et de recherche français ou étrangers, des laboratoires publics ou privés.
immune-inspired active classifier, an application to
streaming time series analysis for network monitoring
Fabio Guigou
To cite this version:
Fabio Guigou. The artificial immune ecosystem : a scalable immune-inspired active classifier, an application to streaming time series analysis for network monitoring. Data Structures and Algorithms [cs.DS]. Université de Strasbourg, 2019. English. �NNT : 2019STRAD007�. �tel-02316897�
ÉCOLE DOCTORALE 269
Mathématiques, Sciences de l'Information et de l'Ingénieur
Laboratoire ICube, équipe CSTB
THÈSE
présentée par :Fabio GUIGOU
soutenue le : 18 juin 2019
pour obtenir le grade de :
Docteur de l’université de Strasbourg
Discipline/Spécialité
: Informatique
The Artificial Immune Ecosystem:
a scalable immune-inspired active
classifier
An application to streaming time series analysis
for network monitoring
THÈSE dirigée par :
M. COLLET Pierre Professeur, Université de Strasbourg
M. PARREND Pierre Professeur d’Enseignement Supérieur, ECAM Strasbourg-Europe, HDR
RAPPORTEURS :
M. PASTOR Dominique Professeur, IMT Atlantique
M. MERELO Juan J. Professeur, Universidad de Granada
AUTRES MEMBRES DU JURY :
Contents
Contents 3 List of Figures 7 List of Tables 8 Acknowledgements 9 1 Introduction 111.1 Cloud computing and monitoring . . . 11
1.2 Challenges of Cloud-scale monitoring . . . 13
1.3 Requirements for a monitoring system . . . 14
1.4 Monitoring in nature . . . 15
1.5 Contribution . . . 19
I State of the art
25
2 Domain overview: Network and service monitoring 29 2.1 Network monitoring . . . 302.2 Cloud monitoring . . . 35
2.3 Service level monitoring . . . 38
2.4 Open challenges . . . 38
3 Detection: Anomalies in time series 41 3.1 Challenges of time series . . . 42
3.2 Statistics on raw data . . . 44
3.3 Symbolic methods . . . 47
3.4 Machine learning . . . 61
3.5 Open challenges . . . 67
4 Memory: Instance- and rule-based learning 69 4.1 Artificial Immune Systems . . . 70
4.2 Instance-Based Classifiers . . . 76
4.3 Rule induction systems . . . 78
4.4 Conclusion . . . 80
5.2 Comparison with semi-supervised learning . . . 92
5.3 Active and reinforcement learning . . . 92
5.4 Open challenges . . . 93
II The Artificial Immune Ecosystem
95
6 Overview of the AIE 99 6.1 Immune detection system: Cloud-Monitor . . . 1006.2 Immune tolerance system: ALPAGA . . . 102
6.3 Scalable anomaly detection: SCHEDA . . . 104
6.4 The Artificial Immune Ecosystem . . . 105
7 The immune detection system: Cloud-Monitor 107 7.1 Open problems . . . 108
7.2 Immune detection pipeline . . . 108
7.3 Immune memory . . . 109
7.4 Anomaly detection . . . 111
7.5 Evaluation . . . 112
7.6 Conclusion . . . 116
8 The immune tolerance system: ALPAGA 117 8.1 Open problems . . . 118
8.2 Role of the expert . . . 119
8.3 The meta-algorithm . . . 120
8.4 Evaluation . . . 121
8.5 Conclusion . . . 127
9 Heuristics for scalable anomaly detection: SCHEDA 129 9.1 Open problems . . . 130
9.2 Heuristics . . . 134
9.3 Evaluation . . . 141
9.4 Conclusion . . . 154
10 Evaluation of the AIE 155 10.1 Final model . . . 155
10.2 Evaluation . . . 157
10.3 Requirements evaluation . . . 160
10.4 Conclusion . . . 161
11 Conclusion and roadmap 163 11.1 Contributions of the AIE . . . 164
11.2 Roadmap and perspectives . . . 166
11.3 Conclusion . . . 168 4
Annexe : Résumé 183
Introduction . . . 183
Cloud-Monitor, un détecteur immunitaire . . . 194
ALPAGA, un système de tolérance immunitaire . . . 197
SCHEDA, un détecteur d’anomalies scalable . . . 199
L’écosystème immunitaire artificiel . . . 200
Conclusion . . . 201
List of Figures
2.1 NFV and SDN in ISP datacentres . . . 32
3.1 Dynamic Time Warping computation . . . 45
3.2 SAX encoding of a time series . . . 49
3.3 Recurrent Neural Network . . . 63
3.4 Long Short-Term Memory cell . . . 63
3.5 Gated Recurrent Unit . . . 66
3.6 Minimal Gated Unit . . . 66
5.1 Active Learning position in the Machine Learning landscape . . . 84
5.2 Query by committee . . . 89
6.1 Architecture of Cloud-Monitor . . . 101
6.2 Data flow in Cloud-Monitor . . . 101
6.3 Data flow of basic monitoring and active learning . . . 103
6.4 The AIE as a combination of Cloud-Monitor, ALPAGA and SCHEDA . . . 105
7.1 Cloud-Monitor signature recording . . . 110
7.2 Artificial anomalies introduced in a dummy time series . . . 112
7.3 Example time series . . . 113
8.1 Classifier F-score wrt. training set size . . . 123
8.2 Classifier running time vs. training set size . . . 124
8.3 Classifier performance with and without ALPAGA . . . 125
9.1 CPU time series anomaly . . . 131
9.2 RAM time series anomaly . . . 131
9.3 Anomaly undetected by SAX/Sequitur . . . 133
9.4 SAX/Chaos Game failure mode . . . 133
9.5 Two IT monitoring time series, with the associated autocorrelation plots . . . 136
9.6 Anomaly detection as a compression/reconstruction problem . . . 137
9.7 Join profile matrix and anomaly score . . . 138
9.8 Dirac train-like series with structural anomaly . . . 146
9.9 Euclidean anomaly score computed using different window sizes . . . 147
9.10 Human activity-like series . . . 148
9.11 Example real time series . . . 149
9.12 ROC curves for SCHEDA, ARIMA and the euclidean score . . . 151 7
10.1 Integrated AIE data flow with single database/classifier . . . 156
10.2 User requests generated by the AIE . . . 159
1 Architecture de Cloud-Monitor . . . 195
2 Flux de données dans Cloud-Monitor . . . 196
3 Flux de données pour un système de supervision simple et actif . . . 197
4 L’EIA comme combinaison de Cloud-Monitor, ALPAGA et SCHEDA . . . 200
List of Tables
3.1 Minimal distances between SAX symbols . . . 493.2 Average performance of LSTM and RNN on open datasets . . . 64
3.3 Properties of time series anomaly detection models . . . 68
5.1 Proposed models and properties . . . 98
7.1 Delay before anomaly detection . . . 113
7.2 Overall performance of Cloud-Monitor . . . 114
8.1 Impact of limited expert availability . . . 122
8.2 Classifier F-score vs. training set size . . . 123
8.3 Classifier running time vs. training set size . . . 124
8.4 Results of classifier reuse . . . 125
9.1 ARMA running time against maximum lag . . . 130
9.2 Runtime of anomaly detection algorithms . . . 132
9.3 Complexity of euclidean score approximations . . . 144
9.4 Comparison of euclidean score approximations . . . 149
9.5 Runtime cost of the SCHEDA heuristics . . . 150
9.6 Maximal number of SCHEDA monitors per server . . . 152
9.7 RAM usage of SES vs. time series length . . . 152
10.1 Lookup time for 1-NN search . . . 157
10.2 Performance figures of the AIE . . . 158
10.3 Overall performance of the AIE compared to Cloud-Monitor . . . 159
Acknowledgements
This project would have been impossible from the start without the tremendous effort and involvement of many amazing people. First and foremost, I thank my advisors, Pierre Parrend and Pierre Collet. You both helped me stay on track and gave me so much food for thought – way too much so for a single thesis!
My utmost gratitude goes especially to Pierre Parrend, who followed me most closely. Thanks for the encouragements and the priceless advice. Thanks for all the blunders you pointed out and the structure you gave me. Seeing this manuscript grow and eventually get your approval was a joy!
I would like to specially thank Véronique Legrand, Michel Tyburn and Thierry Coussy for the work they put in creating this opportunity for me. You made the collaboration between IPLine and the ICube lab possible and turned a nice idea into a concrete project.
I thank Professors J.J. Merelo and Dominique Pastor for accepting to be my rapporteurs for this thesis and coming all the way to Strasbourg for my defence. Thanks again to Professor Véronique Legrand for also being part of my jury.
Of course, I thank all my family for their constant support and interest, with a special thought for my grandfather, who never missed an opportunity to discuss my progress and read my publications.
Finally, a very special thank you to Sophie Menneson, who emotionally put me back together more times than I could count.
None of this would have been possible without every single one of you.
Chapter 1
Introduction
1.1 Cloud computing and monitoring
We live in the Cloud era. Our data and applications have left or will soon leave the ubiquitous Personal Computer of the eighties and nineties to migrate into the Cloud. A clear example is that, as of 2018, Microsoft Office 365, the on-line edition of the well-known office suite, was used by 56% of the companies1, thus exceeding the use of desktop version. This new paradigm in application design – with SaaS2 replacing desktop applications and Cloud storage replacing hard drives – also implies a new paradigm in network access and connectivity. People and corporations have become connected, 24 hours a day, and a disruption in Internet access can grind a business day to a halt in a matter of seconds. The success of the Cloud model is paralleled by the mobile computing revolution, which was made possible by the rise of Cloud-hosted services.
This revolution enjoyed a wide media coverage, highlighted with iconic statistics. In October 2016, for the first time, mobile platforms took over desktop computer as the first platform to access the Web3. Furthermore, it has been predicted in 2016 that by 2020, 67% of corporate IT will be running in the Cloud4. Reports show that this prediction was exceeded by 2018, with 77% of businesses running at least one of their applications in the Cloud5. This sketches a new computing landscape leaning heavily on mobile devices and Cloud-based platforms – even in the corporate world.
Though the notion of applications and data belonging “in the Cloud” still appears mysterious to some [Dillon et al., 2010], there is actually a precise definition of Cloud computing. According to NIST, “Cloud computing is a model for enabling ubiquitous, convenient, on-demand network access to a shared pool of configurable computing resources (e.g. networks, servers, storage, applications, and services) that can be rapidly provisioned and released with minimal management effort or service provider interaction” [Mell et al., 2009]. The same document also defined the three levels of Cloud computing:
1https://wire19.com/over-half-of-organizations-have-now-deployed-office-365/
2Software-as-a-Service, the new wave of feature-rich Web applications aimed at replacing traditional desktop
tools such as word processors, CRM or accounting software...
3http://gs.statcounter.com/press/mobile-and-tablet-internet-usage-exceeds-desktop-for-first-time-worldwide 4https://www.forbes.com/sites/gilpress/2016/11/01/top-10-tech-predictions-for-2017-from-idc
5https://www.idg.com/tools-for-marketers/2018-cloud-computing-survey/
• PaaS, Platform-as-a-Service: on-demand provisioning of a runtime environment on top of which applications can be deployed, and
• SaaS, Software-as-a-Service: on-demand access to applications running in the Cloud, with remote processing and storage, generally through a Web browser.
In other words, IaaS provides users with virtual machines and networks, PaaS with application servers and SaaS with applications; all three are accessed via the network. These new ubiquitous access modes put a heavy load on the Internet infrastructure, which has now become more critical than ever. This new criticality makes it all the more important to monitor the network for early signs of failure, congestion, overload or attacks [Alhamazani et al., 2015, Mdini et al., 2017, Ward and Barker, 2014].
Monitoring is the process by which network operators and support teams can be informed in real time of the status and of any potential issue of the network, networking devices, servers and applications they operate. It is a crucial part of the operation of any computing infrastructure of non-trivial size. However, we will see that in spite of the importance of monitoring, especially after the Cloud revolution, solutions in use by hosting companies and Internet Service Providers (ISP) are still rudimentary, and the topic still raises a number of research challenges, partly addressed by a wide community. Before reviewing these challenges and outlining a proposed solution, let us first define monitoring more precisely.
Monitoring can be accomplished by capturing and analysing traffic [Zhou et al., 2018] or traffic metadata [Yuan et al., 2017] or by querying the networking devices for health metrics [Alhamazani et al., 2015, Gupta et al., 2016]. The former are more advanced, but the latter still the most widely used: a simple Google search for “network monitoring tools” typically returns results for Nagios (and its many forks), Cacti, PRTG or Zabbix. These are open source or commercial monitoring suites, all based on active monitoring of networking nodes. Active monitoring means polling, i.e. actively retrieving information, as opposed to passive monitoring where the information is sent to the monitoring nodes as SNMP traps, logs or raw network traffic. Monitoring of the nodes refers to the data being generated by the networking devices themselves, as opposed to traffic capture. These different “flavours” of monitoring serve different purposes and become relevant in different contexts: traffic capture is crucial for security analysis and intrusion detection [Gupta et al., 2016], while passive monitoring is well suited to server monitoring, as servers can run local monitoring agents [Anand, 2012]. Monitoring generic networking devices, however, remains driven by polling, i.e. active monitoring [Chowdhury et al., 2014].
For ISP and IaaS hosts, the most critical aspect is active monitoring at the nodes – generally referred to as “network monitoring” even though it reaches beyond the scope of the network –, which coincides with the current offering in terms of commercial software. Our personal experience in the ISP and hosting industry points to network monitoring, i.e. active monitoring, as the most challenging area for a number of reasons [Ward and Barker, 2014]:
• Most devices in an ISP network can only be monitored actively.
• While security applications have traditionally been heavy on the computational resources, network monitoring is expected to scalable on low-end hardware, i.e. to be extremely lightweight in terms of computational demand.
– though the research community acknowledges the need for deeper analysis of these metrics.
This last point – applying high level analyses on monitoring data at scale – is the subject on which we will focus throughout this thesis.
1.2 Challenges of Cloud-scale monitoring
Recent papers cite a number of challenges in network monitoring [Alhamazani et al., 2015, Mdini et al., 2017, Ward and Barker, 2014, Celenk et al., 2008]:
• Use of machine learning on the monitoring data • Predictive monitoring
• Anomaly detection • Scalability of the analysis
In essence, the main difficulty associated with network monitoring is the intersection of a large volume of incoming data and the need to process it in real time. This makes it extremely difficult to perform any non-trivial analysis on the monitoring data. Typically, the usual monitoring solutions such as those we cited above only compare values to thresholds to determine whether a device is functioning properly or not. Predictive monitoring, i.e. forecasting [Alhamazani et al., 2015], anomaly detection [Mdini et al., 2017] and machine learning [Ward and Barker, 2014], which are viewed as challenges in the monitoring community, all require a significant computational power and dedicated infrastructure [Zhou et al., 2018, Gupta et al., 2016]. Given that the analyses have to be applied at the scale of hundreds of thousands to millions of metrics, even for a relatively small Cloud provider, with a sampling interval between one and five minutes7, the total computational power available to process a single metric is extremely limited.
The first challenge, namely the use of machine learning, is linked to the scalability problem: lightweight machine learning models are rare, and the typical models for time series, like recurrent neural networks [Greff et al., 2017], are among the most expensive models in the whole field of machine learning. The same goes for anomaly detection and predictive monitoring: scalable algorithms, even when not based on machine learning, tend to be costly, especially when long dependencies exist, e.g. the baseline behaviour of the metric is defined over thousands of samples.
The scalability challenge means that a monitoring system capable of analysing millions of time series in real time is fundamentally incompatible with the recent trends in machine learning such as deep learning, which rely on large clusters of dedicated hardware for training and still incur a considerable runtime cost.
6See for example Darktrace, a behavioural intrusion detection system based on Bayesian traffic models
(https://www.darktrace.com)
7Default settings for Nagios: one check every 5 minutes, switching to one per minute if a problem is detected.
Monitoring systems, besides any research problem, have a number of requirements to be considered functional. A system that does not match these requirements will be considered essentially useless. It is important to note that these requirements are not challenges per se; instead, they influence the potential solutions to the research problems found in monitoring. Only a solution matching these requirements can be considered valid.
The first requirement is real-time analysis [Elsen et al., 2015, Zhou et al., 2018, Lin et al., 2016]. This requirement is common in monitoring and not limited to network monitoring: it also holds, for instance, for security monitoring [Zhang and Paxson, 2000], i.e. detecting attacks against an organization. Real-time analysis implies online analysis [Wang et al., 2016b]: the samples must be processed as they are received, in a streaming fashion, and not at rest, when all the data are available [Gupta et al., 2016]. Online operation limits the algorithms that can be used on the streaming data, as not all time series analysis models can function this way [Zhou et al., 2018].
The second requirement is autonomy, i.e. the ability to operate with the smallest possible level of human control [Liotta et al., 2002]. It is quite obvious that a system that will monitor millions of time series should require as little tweaking as possible, and most importantly no specific tuning for each time series. A global sensitivity parameter may be relevant, but no more. This eliminates a number of models that indeed have many parameters that need to be carefully adjusted in order to obtain meaningful results [Keogh et al., 2004].
The third requirement is a low false positive rate [Dastjerdi et al., 2012, Zhang and Paxson, 2000]. False alerts overload network operators, leading to a lack of attention and a higher probability of missing an important alarm. The goal of “advanced” monitoring, i.e. monitoring beyond simple user-defined alerting thresholds, is to achieve a higher detection capability while maintaining a low false positive rate [Wang et al., 2016b].
These are functional requirements: they apply to any monitoring system, be it commercial software or academic research. However the challenges listed above (use of machine learning, anomaly detection, failure prediction and scalability) give rise to another set of requirements for the system we propose. While machine learning can only be considered a tool and not a requirement, we consider the other three as necessary parts of an advanced monitoring system: • Anomaly detection: a metric suddenly changing behaviour can be a better indicator of an ongoing incident than a value exceeding a threshold, even if the metric remains within theoretically acceptable bounds [Ward and Barker, 2014].
• Failure prediction: warning the operators at the earliest possible signs of an anomaly, i.e. before any dangerous behaviour is detected, can prevent incidents before they have an impact [Celenk et al., 2008].
• Scalability: arguably also a functional requirement, scalability means that millions of time series should be analysed in real time, on distributed hardware if necessary; the throughput should be in the order of tens of thousands of data points per minute and per server [Gupta et al., 2016].
To summarize, the requirements for our proposed monitoring system are: • Low CPU and memory footprint, or scalability,
• Anomaly detection, • Failure prediction,
• Low configuration overhead, or autonomy, • Low false alarm rate.
1.4 Monitoring in nature
The starting point of this thesis is that a real-time, distributed, scalable, self-regulated subsystem that monitors the overall system in which it exists, reacts to anomalies and known threats and constantly tries to minimize its monitoring latency while maintaining a low false positive rate already exists in nature. In fact, we argue that this description matches that of the immune system, as it exists in humans and many other animals.
Since the early days of computing, the idea of replicating natural processes to solve complex problems has generated dozens of successful models, which in turn have spawned hundreds of variations. The 1950s already saw the rise of the artificial perceptron [Rosenblatt, 1958] and artificial evolution [Minsky, 1958]; across the years, more natural phenomena were mimicked, simulated and used as metaheuristics: the flocking behaviour of birds [Reynolds, 1987], the path-finding abilities of ants [Dorigo and Gambardella, 1997], the information passing of foraging bees [Pham and Castellani, 2009]... Among these models, the artificial immune systems (AIS) were built around many key concepts and processes of the biological immune system put forward by immunologists, such as the immune network theory [Jerne, 1974] or the negative selection of self-reactive T cells in the thymus [Forrest et al., 1994].
As many other nature-inspired metaheuristics, AIS come in many flavours: any algorithm inspired by the antibody/antigen reaction, the maturation of lymphocytes, the clonal hypermutation of T- and B-cells, or any other immune process, can be labelled as an artificial immune system [Hart and Timmis, 2008]. This leads to a wide variety of models and applications: many unrelated algorithms and theories have been formulated under the umbrella term of artificial immune systems.
Although the AIS community never designed a single, unified metaheuristic, or even a consistent family of algorithms – in the way the neural network family encompasses shallow as well as deep networks, feedforward as well as recurrent, and many different models of neurons: linear, squashing, gated, spiking... –, the expected properties of these algorithms and of the artificial immune systems in general are very consistent; in fact, they closely follow the perceived properties of biological immune systems. In [Aickelin and Cayzer, 2008], they are summarized as follows:
• Error tolerance: a single fault should not have a long-term effect on the behaviour of the immune system.
• Distribution: just as the lymphocytes, through the lymphatic system, are distributed throughout the body, an artificial immune system should have the ability to be distributed across many computation nodes.
• Adaptation: changes in the “immunized” system should be learnt and followed by the immune system, rather than trigger a catastrophic auto-immune reaction.
In [Twycross and Aickelin, 2005], the authors express these properties as the ODISS framework, with ODISS standing for:
• Openness: the immune system and its immunized host interact in a state of dynamic equilibrium.
• Diversity: a vast repertoire of immune cells covers a wide range of possible antigens. • Interaction: the immune system can be modelled as a network of interacting and signalling
immune cells.
• Structure: the immune system is functionally decomposed into distinct subsystems with different roles.
• Scale: the immune system is composed of a large population of simple agents rather than a small population of complex ones.
In a later paper [Twycross and Aickelin, 2007], they describe a slightly different set of properties of the immune system:
• Specificity: an antibody targetting an antigen is only sensitive to that exact antigen. • Diversity: a vast repertoire of immune cells covers a wide range of possible antigens. • Memory: specific antigens, once encountered, leave a trace in the immune system and
trigger a faster and more powerful response on secondary exposure.
• Tolerance: the immune system, while remaining capable of reacting against almost any antigen, does not react against the body itself.
In [Greensmith et al., 2010], Greensmith proposes the dendritic cells as a basis for artificial immune systems, citing the following properties:
• Decentralization: the immune system does not have a central decision or coordination point; instead, the various immune cells interact locally.
• Robustness/error tolerance: errors made by a single individual, i.e. a single immune cell, do not propagate through the system and have no real impact on its overall behaviour. Of course, the core processes of the immune system such as anomaly detection, sometimes formulated as non-self detection, and memory, are generally not stated as properties: they are rather the use case for an AIS, and the natural function of the immune system. Thus, just as we formulated requirements for a monitoring system, we can propose requirements for an artificial immune system:
• Decentralization/scalability: the immune system, because it only relies on local interactions, can scale almost indefinitely. In computing terms, it scales horizontally, without single point of failure.
• Memory: objects that would not trigger an immune reaction can be made to cause one. This is the inverse of tolerance, and the principle behind vaccination: unknown pathogens causing damage and triggering a late reaction after first exposure are remembered and the secondary response is much more intense and rapid than the first.
• Tolerance: objects that would otherwise trigger an immune reaction can be tolerated, i.e. the immune reaction can be suppressed.
• Adaptation: when the monitored system (the body, a data stream...) changes, the immune system is able to silence the global auto-immune reaction that this change would trigger. Adaptation is similar to tolerance applied along the time axis.
A point often missed in the literature is that, to follow the natural immune system, these properties should be applied in real time: adaptation is meaningless if the whole history of the system/body is known in advance. The immune memory also evolves during the lifetime and cannot be reduced to a mere set of detectors generated at one point in time, e.g. during a hypothetical training phase.
The AIS community is unique in that it is extremely close to the immunologists: following the works of Jerne [Jerne, 1974], researchers like Varela and Bersini [Bersini and Varela, 1990, Bersini, 2002, Cutello et al., 2004] have explored both sides of the field, and their models have contributed to the development of artificial immune systems as well as the understanding of the biological immune systems themselves. The works of Greensmith [Greensmith and Aickelin, 2009] on the dendritic cell algorithm are as much a computational device as a model of a biological process. The danger theory put forward by Matzinger [Matzinger, 1994, 2002], an immunologist, has been studied and introduced in the AIS by Aickelin [Aickelin and Cayzer, 2008] only a few years after its inception.
Unfortunately, the AIS community tends to have a pessimistic view of the field, highlighting its inadequacy to real-world problems [Freitas and Timmis, 2003, 2007] and sometimes naïve view of immunity [Matzinger, 2002, Bersini, 2002], at odds with the current biomedical research. The vital questions for the AIS community are: can AIS actually implement the desired properties of immune systems? And can they scale to real-world problems as well as neural networks or evolutionary algorithms do?
A pragmatic view of the issue, introduced in two grounding papers by Freitas and Timmis [Freitas and Timmis, 2003, 2007], is that one should focus on the properties of the immune system instead of the processes, and follow a problem-oriented approach, with real-world constraints and domain-specific evaluations.
One important proof the AIS community has made over the years is that various facets of biological immunity, and therefore various properties, are best modelled by different algorithms [de Castro and Von Zuben, 2001, Forrest et al., 1997, De Castro and Von Zuben, 2002, Aickelin and Cayzer, 2008], which are discussed in detail in Section 4.1; the logical conclusion is that, in order to verify any set of immune properties, multiple algorithms must work together. This would turn the artificial immune system, from a family of metaheuristics, into a meta-algorithm integrating a number of these metaheuristics, with different AIS-like algorithms modelling, for instance, the innate immune system, the adaptive immune system and the interactions between the two [Greensmith and Aickelin, 2009].
This “ecosystemic” approach is developed in depth in Chapter 6. In essence, we show that, once we admit that various components – i.e. systems, or algorithms – should be used to model different properties of the immune system, the original AIS, as designed in the 1990s and 2000s, are inappropriate tools, and that a set of specialized algorithms is preferable, both in terms of performance – as measured either in CPU and memory cost or in accuracy – and of understanding of the overall ecosystem. Therefore the AIE becomes a framework in which task-specific algorithms can be plugged to provide the desired properties, with the AIE specifying the interactions and communications between these algorithms.
The central argument of this thesis is that the requirements of the artificial immune system are compatible with those of monitoring systems, and that a model compatible with both sets of requirements yields an efficient monitoring system, and at the same time a valid artificial immune system model. The test case for the AIE is the monitoring of a Cloud provider network, which challenges the requirements of artificial immune systems. It entails monitoring hundreds of thousands of time series (scalability) in real time in order to detect potential failures (anomaly detection), screen them for false alarms (tolerance), record the failure modes for earlier detection (memory) and alert the support team when a failure is detected. These roles map onto the immune properties the following way:
• Anomaly detection: unknown patterns trigger an alarm, • Memory: known failure signals trigger an alarm,
• Tolerance: known rare patterns do not trigger an alarm,
• Adaptation: obsolete signals are purged to prevent false alarms.
These properties can be verified by a number of different algorithms or sets of algorithms. The AIE does not define which algorithm is used for which function, but how the models providing these properties interact. The choice of algorithms is domain-specific, depending on the data. In this thesis, it will be guided by the requirements for monitoring systems that are not directly expressed in immune systems:
• Low CPU and memory footprint, • Real-time analysis,
• Low configuration overhead, • Low false alarm rate.
Most importantly, let us remember the wise words of Andrew Watkins and Jon Timmis [Watkins and Timmis, 2004] about their Artificial Immune Recognition System, which are true for any nature-inspired model: “Immune-inspired is the key word. We do not pretend to imply that AIRS directly models any immunological process, but rather AIRS employs some components that can metaphorically relate to some immunological components.” Neither do we claim the AIE to be a biologically plausible model. It is, however, plausible in the world of artificial immune systems, insofar as it is based on the same metaphors, as embodied by the properties defined above.
1.5.1 Objectives
The striking resemblance between monitoring and immune systems, in terms of their goal and some of their properties – or desirable properties – is the starting point of this thesis. Our hypothesis is that adding the algorithmic blocks to provide the properties of immune systems to existing monitoring systems can address at least some of the challenges described by the community. We ask the following questions: can an immune system-like algorithmic design solve some of the problems of monitoring systems? In particular, can it reach the required level of accuracy, failure prediction and autonomy to compete with state-of-the-art approaches, while retaining a limited footprint in terms of computational power and memory?
These questions should be read in the context of the requirements expressed for monitoring systems:
• Accuracy is measured by the false positive rate and the new failure modes that can be detected with respect to a threshold-based system.
• Failure prediction is intended as reaction time before an alerting threshold is crossed, i.e. before the actual failure occurs.
• Autonomy is understood as the ability to function without human intervention, e.g. fine parameter tuning.
We show in Chapter 2 that these are the research challenges of the monitoring community. The statistics and machine learning communities bring models that may be suited to answer these challenges, yet remain to be benchmarked against them. The immune inspiration also brings a notion of memory that, to the best of our knowledge, can be modelled by many algorithms but has never been formalized as such. Likewise, the notion of tolerance has not been explored as such by the machine learning community.
Our objectives are to derive, adapt or design algorithms to model the immune properties described in the previous section. We expect the resulting artificial immune-like system to fulfil the requirements of monitoring systems better than traditional methods, mostly because of the extremely limited resources available per time series. This endeavour raises a number of questions that have not been solved in the literature:
• Can anomaly detection in time series be feasible at the scale of network monitoring and in real time with a small computational budget?
• Can an immune-like form of memory provide failure prediction, or at least, as in the biological immune system, make the reaction to already encountered pathogens, i.e. failure modes, faster?
• How can a system designed to detect anomalies and failures be made tolerant to rare patterns, the same way the immune system tolerates foreign elements in the body such as the intestinal flora?
The objective of the Artificial Immune Ecosystem is to answer these questions, and it will be challenged along these axes. Note that they reflect the key immune properties that were highlighted before; these properties will be the target of the benchmarks performed on the AIE.
This thesis brings three main improvements to the state of the art, which are summarized in Section 11.1 of the final chapter. They cover the following topics:
• Monitoring process and architecture: the Cloud-Monitor model adds anomaly detection and failure prediction to traditional monitoring systems at a computational overhead that does not hinder scalability.
• Active learning: the ALPAGA model uses the output of a binary classifier as a heuristic for active learning, i.e. training a model with a human in the loop, which allows for false positive filtering.
• Anomaly detection: the SCHEDA models approximate the euclidean anomaly score in periodic time series at an extremely low computational cost. We also show that they outperform the euclidean score in terms of accuracy.
SCHEDA makes Cloud-Monitor scalable, while ALPAGA filters its false positives based on expert feedback. The system thus constructed forms the Artificial Immune Ecosystem, or AIE, and is expected to exhibit the core immune properties of anomaly detection, memory and tolerance.
1.5.3 Outline
This thesis is organized in two parts. Part I reviews the current literature in order to find the right models to build an artificial immune ecosystem. It also identifies the perceived shortcomings of these models and the remaining challenges that will require new algorithms to be designed. This part is outlined as follows:
Chapter 2 reviews the field of network monitoring. It presents the various communities involved in monitoring and the research associated with each specific area: network security, virtual machines and service level monitoring. This review expands the challenges we already discussed, in particular advanced analytics at scale, and presents the current advances in solving these challenges. The literature shows a trend of integrating Big Data tools such as Apache Spark Streaming8 into the new monitoring frameworks; however, these techniques and tools are not yet applied to the time series obtained by active monitoring. Instead, they are used on flow metadata, which are snapshots of the system at a given time, without context. Machine learning also remains largely unused.
Chapter 3 covers anomaly detection models for time series data. In particular, it focuses on streaming data, online algorithms and scalability. The literature is extremely rich and covers a wide variety of methods, but also shows a number of limitations. The challenges of scalable algorithms that can operate online, in real time, on the type of time series obtained by monitoring systems, are not solved by any current model. In particular, the long-term dependencies observed in monitoring time series defeat auto-regressive models and recurrent neural networks. From this study, we conclude that a new algorithm is required to handle the specific characteristics of the time series obtained in network monitoring, namely the long, multi-scale patterns they exhibit and the potential for anomalies to happen at any of these scales.
8https://spark.apache.org/streaming
a large overlap: a failure in a system can be predicted either by detecting an anomaly in a metric of this system or by noticing that the considered metric follows a pattern that has, in the past, led to a failure; both approaches are known as failure symptom monitoring [Salfner et al., 2010]. The second definition, however, is extremely similar to the notion of memory in immune systems. In this chapter, we review models that may be applied to the problem of creating an immune repertoire, or a pattern classifier. In particular, the literature shows that instance-based classifiers, i.e. entirely data-driven classifiers that do not build models, are the best suited for such a task. The most efficient of them are nearest neighbours classifiers, which are more efficient and more precise than traditional artificial immune systems or rule-based systems such as Learning Classifier Systems (LCS).
Classifiers can not only be supervised or unsupervised, there also exist families of semi-supervised models that use unlabelled test samples as well as labelled ones to predict the categories of new testing samples. Given that the immune memory is the mechanism that enables both the fast secondary reaction of the immune system and its tolerance [Matzinger, 1994], the nearest neighbour classifier implementing the function of immune memory must be able to recognize a failure symptom (memory) as well as an erroneous reaction (tolerance). However, this last function requires erroneous reactions to be somehow detected as such. In the context of monitoring, we propose that the users, i.e. the network operators and IT support staff, could tag alerts as true or false alarms. The immune memory classifier would then receive these labels in real time and adjust its behaviour in consequence. This approach of classifier training is called active learning [Tong and Chang, 2001, Veeramachaneni et al., 2016]. Chapter 5 investigates the models of active learning and use scenarios. We find, however, that active learning lacks the real-time component in many evaluations, and instead is only compared to supervised learning in terms of the number of labelled samples necessary to reach a similar accuracy to traditional models.
Part II of this thesis describes the proposed AIE model. The AIE is an immune-inspired classifier that fulfils the requirements of monitoring systems. As such, it addresses some of the open problems highlighted in Part I, in particular the challenges of network monitoring. It also proposes new algorithms for active learning and time series anomaly detection, which are required in the model. These contributions as well as the overall AIE are evaluated in the context of Cloud network monitoring and against the requirements of immune systems and monitoring systems. This part is organized as follows:
Chapter 6 proposes a high-level view of the artificial immune ecosystem. It describes the individual subsystems that form the ecosystem itself and their interactions, as well as the properties of each of them. It also presents the immune metaphor on which the AIE is based; in particular, how the AIE models the innate and adaptive immune systems as three different processes that map to the functioning of a monitoring system:
• Innate immunity provides coarse-grained detection of a broad range of pathogens. It maps to the ability of monitoring systems, based on thresholds, i.e. domain knowledge, to detect severe, “obvious” malfunctions.
• Acquired immunity provides fine-grained detection of both known and unknown pathogens – though known pathogens are detected faster and trigger a stronger immune response. The detection of unknown pathogens maps to anomaly detection [Greensmith et al., 2005].
an anti-virus or intrusion detection system.
Chapter 7 describes a simple AIE model that verifies some of the key immune properties, namely anomaly detection and memory. We call this first model Cloud-Monitor [Guigou et al., 2015]. It is evaluated in the context of a monitoring system. We show that the added ability of detecting potential failures based on novelty, i.e. new behaviour, and past failures, leads to faster detection times. Though this finding supports our initial hypothesis that immune-inspired models can be the basis of monitoring systems, we also find that, without any feedback loop, the false positive rate becomes so high as to threaten its usability. This is expected, as Cloud-Monitor does not model immune tolerance. It also confirms the importance of this property.
To filter these false alerts, a second block is added to the AIE. It wraps the immune detection system and allows false alerts to be detected and filtered. As such, it provides immune tolerance. Chapter 8 proposes ALPAGA (Actively Learnt Positive Alert GAteway) [Guigou et al., 2017b], a methodology based on the active learning paradigm to use feedback given by experts to distinguish between true and false alarms. ALPAGA is based on the notion that a monitoring alarm can be labelled by the network operators as corresponding to a real incident or a simple false positive, and that the associations of fragments of time series and labels can be used to train a classifier. Said classifier can then filter future alarms and discard those that are predicted to be false.
We benchmark several families of algorithms to determine the best candidates for the role of false alarm filters: neural networks, Bayesian filters, decision trees, nearest neighbour and support vector machines. Given that alarms are a rare phenomenon, with at most one or two occurring per month in typical time series, this classifier must be able to work with very small datasets. Experiments show that in these conditions, instance-based classifiers such as nearest neighbour classifiers perform best in terms of accuracy and computational load. Comparing the accuracy of a monitoring system generating alerts without filter and filtered by ALPAGA, we show that nearest neighbour models and decision trees perform better than the raw monitoring system, and support vector machines, neural networks and Bayesian classifiers perform worse or on par with the unfiltered alerting system. Interestingly enough, this shows that the algorithms best suited to provide immune tolerance are also those that best model immune memory. This fact opens the possibility to use a single memory for the secondary reaction and the immune tolerance. Not only does it make the model simpler, it also corresponds to the actual way the biological immune system works: by building a repertoire of memory T- and B-cells.
A crucial process in this monitoring immune system is anomaly detection. The time series obtained by monitoring have a number of properties that can be readily observed by simply plotting them and have been investigated in other fields, such as electrical power usage [Espinoza et al., 2005, Keogh et al., 2004]. Typically, the patterns present in these series are multi-scale, nested and non-linear [De Chaves et al., 2011], with strong periodic daily and weekly structures. As we show in Chapter 3, this type of long-term dependency defeats learning models such as recurrent neural networks and the multiple complex patterns makes random process models, e.g. auto-regressive moving average models, unusable.
Chapter 9 describes a set of heuristics that allow anomaly detection to be performed online, in real time, on monitoring time series. We show that these heuristics, which we call SCHEDA for Sampled Causal Heuristics for Euclidean Distance Approximation, are good predictors of the
outliers – naïve in the sense that its computational cost makes it essentially useless for long time series [Keogh et al., 2005] – perform similarly on monitoring data. SCHEDA, however, is scalable to hundreds of thousands of series on a single server.
Thus Cloud-Monitor provides memory for secondary reaction, ALPAGA adds tolerance and SCHEDA allows for scalability and anomaly detection. All these algorithms work online, in real time. The last property, autonomy, is evaluated in the context of the full AIE.
Chapter 10 describes and evaluates the complete AIE integrating the Cloud-Monitor immune detection system, using SCHEDA for anomaly detection, and a nearest neighbour classifier shared between the failure database of Cloud-Monitor (immune memory) and the ALPAGA filter that eliminates false alerts (immune tolerance). The benchmarks are performed against a simple monitoring system, a monitoring system with an ALPAGA filter and Cloud-Monitor alone. The relevant metrics are execution time, false alarm rate and missed alarm rate, with various sensitivity tunings and a variable amount of feedback to train ALPAGA.
We show that the AIE performs significantly better than any combination of its subsystems and maintains a runtime cost compatible with the requirements of monitoring systems. By verifying the property of autonomy, it also fulfils all the requirements of artificial immune systems. The results of the experiments on the AIE validate the hypothesis that immune and monitoring systems are compatible, and that the former can solve some of the challenges of the latter. We further claim that by providing a strong use case for an artificial immune system and novel ideas from immunology that were not present in the monitoring community, the AIE makes AIS relevant while building a strong basis for future monitoring suites.
Chapter 11 concludes this work, summarizes its salient contributions and opens up perspectives on further improvements on the AIE model.
Part I
• Low CPU and memory footprint, • Real-time analysis,
• Anomaly detection, • Failure prediction,
• Low configuration overhead, • Low false alarm rate.
Our approach in this thesis is to use the metaphor of the immune system to design a model verifying these requirements. We propose to model failure prediction as a form of immune memory and to consider low false alarm rate as the role of immune tolerance. We showed in Section 1.4 that anomaly detection, memory and tolerance were core processes of immune systems, the remaining requirements that are specific to monitoring systems are low CPU and memory cost, real-time analysis and low configuration overhead. These properties will guide us through the literature to identify the strengths and weaknesses of the current models providing repectively:
• Anomaly detection in time series, • Memory, and
• Tolerance.
The first chapter of this review is dedicated to the application domain of the AIE: network monitoring. It highlights the current challenges faced by the community, the approaches taken to solve these challenges and the recent trends in the field. Through this literature review, we try to answer the following questions:
• How can anomaly detection scale to millions of time series? • Which architecture is required to support such scalability?
• How will the scale of the problem influence the design methodology of our model? The second chapter covers anomaly detection, which is a large class of problems: point anomalies can be detected as points lying outside of a statistical distribution, and structural anomalies, also known as behavioural anomalies, can be generated by normal-looking activity occurring at an abnormal point in time, e.g. a regular pattern of activity detected during a week-end [Chandola et al., 2009]. During the last two decades, research has spawned numerous approaches to this problem, with different strengths and weaknesses and different trade-offs. The question we try to answer is: given our requirements and the challenge of scalability, what are the existing models suitable for anomaly detection in a monitoring system, or how should one be designed?
The third chapter considers immune memory. Immune memory models are typically instance-based, i.e. based on a set of vectors similar to the training set rather than a model built around it, with negative instances for negative selection [Forrest et al., 1994] and positive
also directly based on the training samples, without any real model built on top of it; they are the simplest algorithms that can be derived in this model-free paradigm. We also study the literature on condition-action systems, i.e. systems learning to perform specific actions based on detected patterns, which share common characteristics with artificial immune systems by matching a representation of an environment with a population and, on a positive match, triggering the action associated with the matched agent. These models are alternatives to the AIS for multi-agent modelling.
Finally, the fourth chapter focuses on tolerance, and the existing models that can provide it. In particular, we study active learning. Active learning is a way to train a classifier – any classifier that can work with small training sets – incrementally. It is generally implemented in one of three ways: by using internal metrics of the classifier, by training a committee of classifiers, or by using an external heuristic unrelated to the classifier. By incrementally training filters through time, it creates a meaningful interaction between the AIE and its users, i.e. an interaction that takes place in real time and allows the network operators and support staff to correct the behaviour of the system. The questions we try to answer are:
• Can active learning be used to filter false alarms from a monitoring system?
• If so, which models are the most suitable for time series and monitoring systems, i.e. taking into account the scalability challenge?
• Otherwise, how can an active learning model be designed to provide tolerance to an immune monitoring system?
Chapter 2
Domain overview: Network and service
monitoring
While this constitutes quite a digression from the academic argument, we must first acknowledge that the phrase “Monitoring sucks” is quite popular in the sysadmin world – for valid reasons. System and network monitoring still relies on old technologies and protocols, mainly ICMP (as embodies by the ubiquitous ping command) and SNMP1. These protocols are not designed for efficient collection of advanced metrics and are severely limited in any non-trivial scenario. The large ecosystem of tools, from open-source collections of scripts to integrated enterprise products, have seldom scaled to the demand of large service providers in terms of performance, support for decentralized agents, independent operation of datacentres or data quality. A lot of configuration still has to be performed by hand; the monitoring data are stored in lossy formats (see RRDtool as a popular round-robin, flat-file database used in monitoring suites such as Cacti, Nagios and many of their forks, in the open-source world; a variant is used in PRTG2 on the commercial side). While circular buffers implementing subsampling of historical data are great for viewing performance graphs during debug sessions, they are utterly useless if the data are to be used for pattern mining, anomaly detection or forecasting. These systems also fail to provide a centralized, API-enabled view, while at the same time ensuring that network outages between a central server and distributed probes does not compromise data collection. Mostly, probes are unable to operate on their own, and the only way to achieve partition tolerance is to deploy multiple instances in parallel, which implies giving up a unified view of the network. Lastly, behavioural analysis, in the form of anomaly detection or pattern extraction, is completely absent from the industrial monitoring world: a failure is detected when a script returns a value superior – or inferior – to a threshold, with no regard to context.
What led to this state of things, as far as we understand from the plethora of tools and projects, both free and commercial, is the following: the world split between companies using IT services, and monitoring their infrastructure, which may scale to a few hundred or even a few thousand devices, and companies providing IT services and monitoring not only their infrastructure, but also their customers’ – which brings the count somewhere between tens and hundreds of thousands of devices, and millions of metrics. The former have historically used open-source solutions, Nagios being the historic leader, whereas the latter have either
1Simple Network Management Protocol, designed in the late 1980s and early 1990s to provide a unified
language for device management; almost exclusively used today to poll various metrics for monitoring.
2Pässler Router Traffic Grapher
developed their own solutions in-house or purchased the high-end commercial ones, which are typically unaffordable for small and medium businesses. However the increasing dependency of all types of business on their IT infrastructure has led to the emergence of small providers and the increase in the size of the IT service of larger companies, creating a new type of actor: small structures managing big networks. These actors are typically too small for large scale commercial solutions and too big for hand-configured, partially sysadmin-patched, centralized, poorly scalable free solutions. These new companies have new requirements that are yet to be addressed, leaving them with inadequate tools.
On the academic side, it can be argued that the topology of problems that must be addressed in network monitoring is often on the edge between research and engineering, and that the purely scientific topics such as time series analysis are researched in a multitude of domains, from health [Wei et al., 2005] to seismology [Zhu et al., 2018], and seldom get a chance to be considered in the realm of network monitoring, let alone integrated in monitoring solutions. Furthermore, the current trend towards deep and recurrent neural networks, which are heavyweight models, is not well-aligned with the requirements of network monitoring, in particular low computational cost and low configuration overhead [Greff et al., 2017].
The scientific literature has evolved in time, with contributions in the 1990s and 2000s focusing on monitoring as a new field, tackling problems such as polling methods, scheduling and distribution, and most research in the 2010s dealing with the new challenges brought forth by the explosion of the Cloud computing paradigm, both in terms of scale and security. In particular, the rise of SDN3 [da Silva et al., 2016, de la Cruz et al., 2016] and the concern over distributed attacks [da Silva et al., 2016, Zaalouk et al., 2014] has opened new challenges, while the new Big Data tools have provided new ways of dealing with them [Macit et al., 2016].
This chapter is a review of this broad spectrum of the literature.
2.1 Network monitoring
When researching the literature in the domain of network monitoring, two different understandings of the term emerge: monitoring of the network itself, and of the devices using the network. Monitoring of the network itself entails packet capturing via technologies such as OpenFlow or port mirroring. Network security is often the pursued goal, with applications such as intrusion or DoS (Denial-of-Service attacks) detection. This branch of network monitoring keeps expanding as the technologies underpinning today’s networks, e.g. SDN or SD-WAN4.
Many research projects have been carried out in this field, such as OrchSec [Zaalouk et al., 2014], which uses OpenFlow as a data provider to detect DoS attacks in real time. Commercial products, while rare, also exist; an example is Darktrace5, which builds Bayesian models of network traffic in a LAN to detect various sorts of threats propagating from machine to machine, such as viruses, that induce a change in traffic patterns.
3Software-Defined Networking, a way of abstracting the hardware and connectivity into elementary functions
and flows that are easier to manage.
4Software-Defined Wide Area Network, an extension of SDN to inter-site and global networking. 5https://www.darktrace.com
2.1.1 Early research
The scientific contributions up to the mid-2000s were mostly aligned with the state of the industrial art in terms of technologies used and problems studied: polling used SNMP and ICMP and the problems were about scheduling and distribution. The problem of scalability and monitoring of large networks across different routing domains is addressed in [Hanemann et al., 2005] in the form of a decentralized, hierarchical architecture separating the user interface layer, service layer and measurement layer. The lowest layer, measurement, handles the collection of metrics; the service layer handles the transformation, aggregation and protection of said metrics, and the interface layer allows users to interact with the system. This model decouples collection, analysis and presentation of the metrics and allows a monitoring system to scale horizontally by distributing each function across multiple servers.
In [Brutlag, 2000], as early as 2000, a simple anomaly detection scheme is proposed and integrated in RRDtool, a popular flat-file database used to store time series data. The technique used is based on forecasting: the time series is decomposed using the Holt-Winters method [Brockwell and Davis, 2016] and the prediction error is measured. Whenever that error is out of the confidence interval of the model, an anomaly is detected. This model is of course not perfect: it requires tuning, lacks theoretical grounding and proper evaluation, but accurately reflects the concerns at that specific point in time.
In [Liotta et al., 2002], the problem of statically configured pollers and their inadequacy when dealing with large, dynamic networks is approached in a multi-agent paradigm. Instead of configuring monitoring agents on specific hosts, they propose a mobile agent that can move from host to host and discover the topology of the network. These agents are able to query network informations from the routers, clone themselves and move across the network; therefore, the deployment of new agents and the monitoring of new devices is automatic. While this approach to complex topology and scale is interesting, it assumes that any node on the network is able to become a poller, i.e. can run the monitoring agent, which has implications in terms of security and provisioning (the agent needs to be able to connect to a node, install its code there and ensure that all required software libraries are present).
In [Cranor et al., 2003], Gigascope, a streaming database is proposed for real-time query processing. It addresses the limitations of traditional databases or storage back-ends when dealing with high volumes of data that require complex processing by translating queries into optimized task-specific executables that read and write the monitoring data and query results as real-time streams. Such stream processors can be chained for complex tasks or factoring of common subtasks. A SQL-like query language is proposed as the base of the system. Note that today’s Hadoop map-reduce [Shvachko et al., 2010] and Apache Spark frameworks share a number of common features with Gigascope, though they are more generic in nature. Hence the problems known today as Big Data were already part of the monitoring landscape in the early 2000s.
2.1.2 Monitoring software-defined networks
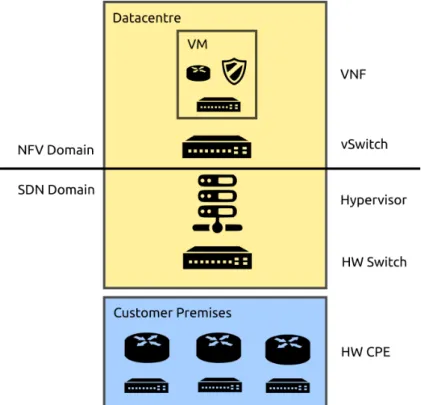
Recent trends in monitoring, as far as academic research is concerned, has shifted towards supporting new networking technologies, such as Network Function Virtualization (NFV) [Palmisano et al., 2017], and using monitoring to pilot the network, e.g. using traffic engineering [Yuan et al., 2017]. These new axes show a tendency to move away from the technical
Figure 2.1 – Network Function Virtualization and Software-Defined Networking in ISP datacentres implementation of monitoring towards a more ecosystemic view, where monitoring is just a subcomponent of a larger, mostly autonomous environment.
This new direction can be partially explained by the ongoing paradigm change in the networking world, with the leading edge of the industry moving away from the traditional proprietary boxes – dedicated routers, switches, firewalls... – and towards fully virtualized network “functions” implemented as virtual machines on x86 or ARM hardware. A function, in this case, is typically a well-defined subset of the functionalities provided by a dedicated appliance: BGP dynamic routing, VLAN tag swapping, flow control based on IP addresses and ports (i.e. basic firewalling), but also more advanced features, including some that are harder to implement in hardware: intrusion detection, anti-spam, DDoS protection, anti-virus, but also reporting, real-time dashboards and graphs generation... Figure 2.1 shows the domain of application of NFV and SDN in ISP networks.
NFV goes hand in hand with SDN and SD-WAN, both of which provide a device-independent way of specifying flows across the LAN or WAN, but also of auditing said flows and collect a number of statistics about them. In [Chowdhury et al., 2014], the authors propose PayLess, a monitoring solution based on OpenFlow, one of the main components of SDN, to poll performance metrics from switches and expose them through a REST6 API. Applications of this framework include customer billing, intrusion detection, quality of service management and failure detection.
The introduction of SDN and OpenFlow for metrics collection has also led the community to design better approaches to traffic engineering: when anomalies are detected in a particular flow
6REpresentational State Transfer, HTTP-based API that uses hypertext semantics to operate on arbitrary
due to a failure of one of the switches in its path, new mechanisms are proposed to recompute a path and reroute the affected flows. In [de la Cruz et al., 2016], a failure detection module is proposed for the open source SDN controller OpenNetMon, which forces the instant rerouting of flows passing through a failing switch. Here failure detection is performed by individual flow sampling.
2.1.3 Advanced monitoring
While this integration work is necessary to monitor networks based on newer technologies, it does not solve the anomaly detection problem, and especially the issue of anomaly detection at scale, i.e. on every single metric polled from each device. Failure metrics in PayLess are only metrics polled from the devices, not results of data analysis.
One implementation of anomaly detection on monitoring metrics is CFEngine by Burgess et al.. In [Burgess, 2002, 2006], they propose approaches for adaptive computer systems that include time series anomaly detection. In particular, they model time as a cylinder, and univariate time series as two-dimensional, each point having a n coordinate modelling the period to which it belongs and a τ coordinate corresponding to its offset within a period. Thus time is expressed as:
t = nP + τ (2.1)
This representation allows a rolling estimate of the mean and standard deviation to be computed at constant τ, thus modelling the variation interval of each point within a period. Typically, a period is chosen to represent the equivalent of a week. These estimates are updated in such as way as to discount older samples and keep the model up-to-date with changes in the time series.
While this approach is robust and lightweight, it has to maintain a model (mean and standard deviation) of each time series over a full period. More importantly, it only exploits a single period in the time series. To deal with events happenning at shorter time scales, additional tests have to be used, such as the Leap-Detection Test (LDT) [Begnum and Burgess, 2007], which builds a local model of the time series and detects changes at the scale of about 10 time steps. Using two different models also means having two different, independent sources of alerting in a monitoring system.
One further step toward advances analyses is the NetQRE framework introduced in [Yuan et al., 2017]. NetQRE provides a high-level language to manipulate metrics and execute actions based on the results of these manipulations. While the intended use of this language is to specify policies that are to be executed in real-time, in particular with respect to quality of service and traffic engineering, it implements a generic business rule engine for real-time data streams of network events. From a scalability standpoint, it can monitor the traffic of a 10 Gbps line on a single server, which is typical of small datacentres scenarios. However, the fact that it operates on raw packets and has no notion of historical data beyond the concept of a stream – typically a TCP session, beginning with a SYN packet and ending with a FIN – scopes it outside our domain of application.
In [Zhou et al., 2018], the problem of high-volume, high-velocity analysis of streaming data is explored using the Apache Spark Streaming framework. Spark Streaming allows computations to be distributed across a cluster of nodes and carried out in real time. A cluster of 5 servers