This is an Accepted Manuscript, which has been through the Royal Society of Chemistry peer review process and has been accepted for publication.
Accepted Manuscripts are published online shortly after
acceptance, before technical editing, formatting and proof reading. Using this free service, authors can make their results available to the community, in citable form, before we publish the edited article. We will replace this Accepted Manuscript with the edited and formatted Advance Article as soon as it is available.
You can find more information about Accepted Manuscripts in the author guidelines.
Please note that technical editing may introduce minor changes to the text and/or graphics, which may alter content. The journal’s standard Terms & Conditions and the ethical guidelines, outlined in our author and reviewer resource centre, still apply. In no event shall the Royal Society of Chemistry be held responsible for any errors or omissions in this Accepted Manuscript or any consequences arising from the use of any information it contains.
Accepted Manuscript
rsc.li/soft-matter-journal
Soft Matter
www.softmatter.org ISSN 1744-683X PAPER Jure Dobnikar et al. Rational design of molecularly imprinted polymersVolume 12 Number 1 7 January 2016 Pages 1–314
Soft Matter
This article can be cited before page numbers have been issued, to do this please use: J. Faivre, G. Sudre, A. Montembault, S. Benayoun, X. Banquy, T. Delair and L. David, Soft Matter, 2018, DOI:
1 Article type: Full Paper
Bioinspired Microstructures of Chitosan Hydrogel Provide Enhanced Wear Protection
Jimmy Faivre, Guillaume Sudre, Alexandra Montembault, Stéphane Benayoun, Xavier Banquy*,Thierry Delair, Laurent David*
J. Faivre, G. Sudre, A. Montembault,Prof. T. Delair, Prof. L. David
Université de Lyon, Université Claude Bernard Lyon 1, CNRS, IMP, UMR 5223, 15 Boulevard Latarjet, F-69622, Villeurbanne, France
*E-mail: laurent.david@univ-lyon1.fr
J. Faivre , Prof. X. Banquy
Canadian Research Chair in Bioinspired Materials, Faculty of Pharmacy, Université de Montréal, Montréal, Qc, Canada
*E-mail: xavier.banquy@umontreal.ca
Prof. S. Benayoun
Laboratoire de Tribologie et Dynamique des Systèmes, UMR 5513 CNRS, Ecole Centrale de
Lyon, 36 Avenue Guy de Collongue, 69134 Ecully Cedex, France
Soft
Matter
Accepted
Manuscript
2 [Abstract]
We describe the fabrication of physical chitosan hydrogels exhibiting a layered structure. This bilayered structure, as shown by SEM and confocal microscopy, is composed of a thin dense superficial zone (SZ), covering a deeper zone (DZ) containing microchannels orientated perpendicularly to the SZ. We show that such structure favors diffusion of macromolecules within the hydrogel matrix up to a critical pressure, σc, above which channels were
constricted. Moreover, we found that the SZ provided a higher wear resistance than the DZ which was severely damaged at a pressure equal to the elastic modulus of the gel. The coefficient of friction (CoF) of the SZ remained independent of the applied load with µSZ =
0.38 ± 0.02, while CoF measured at DZ exhibited two regimes: an initial CoF close to the value found on the SZ, and a CoF that decreased to µDZ = 0.18 ± 0.01 at pressures higher than
the critical pressure σc. Overall, our results show that internal structuring is a promising
avenue in controlling and improving the wear resistance of soft materials such as hydrogels.
Soft
Matter
Accepted
Manuscript
3 1. Introduction
Hydrogels scaffolds are receiving a growing interest in tissue engineering since they can advantageously combine cytocompatible polymers with a high amount of water, therefore, mimicking living tissues1. These materials have been used as scaffolds for cartilage2, 3, bone4,
or nervous tissue repair5. In addition, they can be used as artificial skin6, 7, or as carriers for
drug delivery of active molecules8-10. These applications emerge from their tunable chemical
properties, their multi-scale microstructure (porosity, crystallinity, macromolecular network topology), and their adjustable mechanical and physical properties (viscoelasticity, toughness, permeability11, 12).
The design of tissue-mimicking hydrogels for a specific application depends on the choice of raw material (natural polymers or biocompatible synthetic polymers) and the gelation technique. A useful concept for hydrogel design is bio-inspiration: to take advantage of naturally-occurring chemical and physical architectures for manipulating physical, mechanical and biological behaviors13, 14. This material development strategy leads to the concept of
hydrogel materials as “decoys for biological media”3. The methods used to induce structuring
within hydrogels at different length scales are themselves of great interest. The common structuring methods include freeze or vacuum-casting, layer-by-layer deposition, templating, 3D-printing, and self-assembly, which are used depending on the polymer nature and/or the solvent13, 15. Despite the significant number of reports demonstrating the intimate relationship
between hydrogels microstructure and macroscopic properties, very few reports have focused on the control of the tribological properties, especially wear resistance. This lack of fundamental knowledge has hampered the use of structured hydrogels in many biomedical applications such as joint replacement. In the present study, we demonstrate that the generation of bioinspired microstructures in physical chitosan hydrogels dramatically allows
Soft
Matter
Accepted
Manuscript
4
to control their lubrication and wear resistance. Chitosan hydrogels are especially suitable for cartilage repair since they are excellent for 3D-chondrocyte growth and proliferation2, 3, 16, and
for cartilage substitutes17, 18. In this paper, we focus on the impact of the hydrogel structuring
on their transport and mechanical properties and more specifically on hydrogel/hydrogel tribological properties to understand and rationalize the effects of the multi-scale structure on wear resistance.
Soft
Matter
Accepted
Manuscript
5 2. Results
2.1 Structure of chitosan hydrogels
The "one-pot" fabrication process (see Experimental Section) facilitates the manufacturing of chitosan physical gels with controlled architecture (Fig. 1). The process allows obtaining a two-layered structure as depicted in figure schematic 1A. During the gelation process, the
Figure 1. Structural understanding of physical chitosan hydrogels. (A) Scheme of gel disk, cross-sectional view of chitosan gels owning or not macro-channels, and optical micrographs of hydrogel disks. SEM pictures of chitosan hydrogels after CO2 supercritical drying as a function of chitosan concentration showing (B) the superficial zone (top view) exhibiting a dense structure and (C) the deep zone (bottom view) of hydrogels showing macro-porosity. (D) CLSM and SEM pictures of a
cross-section of 1.5 %w/w chitosan gel showing aligned channels perpendicularly to superficial zone.
40 kDa Dextran-FITC was added to the gel solution to visualize the gel structure by CLSM.
Soft
Matter
Accepted
Manuscript
6
acidic chitosan solution in direct contact with the basic solution quickly forms a dense gel membrane19 forming the superficial zone (SZ) of the gel (Fig 1B). Directly following the
formation of the SZ, the middle zone (MZ) of the gel exhibits perpendicularly aligned channels (capillaries) of 10-25 µm in diameter (Fig. 1 C-D) depending on the gel concentration. These channels were found to be densely packed throughout the gel thickness from the upper part of the MZ down to the deep zone (DZ) (Fig 1C). The size of the channels decreased with increasing chitosan concentration, Cp, from 20 µm at 1.5 %w/w chitosan gel to
10 µm for 2.5 %w/w chitosan gel and no apparent channels were observed in the 5 %w/w
chitosan gel (Fig. 1C). To gain more insights on the structure of the bilayered hydrogel, vertical slices of 1.5 %w/w chitosan gel, parallel to the channels, were imaged by confocal
microscopy and SEM (Fig. 1D). The MZ exhibits vertically aligned channels while the SZ appeared as a dense layer of about 100 µm in thickness. Throughout the MZ and DZ, the distribution of the channel diameters was bimodal (Fig. 1D). In the vicinity of the membrane (upper region of the MZ), a majority of 5 µm channels and few 20 µm channels were observed. In deeper regions (DZ), the channels appeared larger with a diameter ranging between 20 and 40 µm. At a finer size scale, in order to measure the nanoporosity of the gels, we quantified the diffusion coefficient of dextran-FITC probes embedded in the gel by fluorescent recovery after photobleaching (FRAP). When the probe size is close to the mesh size of the gel or internal gel porosity, its diffusion is expected to be significantly lowered (see the fluorescent probes sizes in table S1). The mesh size for 1.5 %w/w and 2.5 %w/w chitosan
gels were measured in the SZ and MZ and they ranged between 40 and 80 nm while the porosity of the 5 %w/w hydrogels ranged between 10 and 40 nm (Fig. S1).
2.2 Poroelastic properties of structured chitosan hydrogels
Soft
Matter
Accepted
Manuscript
7
Figure 2. (A) Diffusion coefficients of 40kDa Dextran-FITC embedded in chitosan gels as a function of normal stress (error bars represents standard deviations of n=5 independent measurements). (B)
Characteristic creep times, τ1 and τ2,as a function of applied normal. (C) Comparison of the gel critical
pressure, σc, between Dynamic Mechanical Analysis and Confocal Laser Scanning Microscopy. (D)
Schematic and SEM micrographs of 2.5% w/w chitosan hydrogel nano- and micro- porosity (basal
view) evolution under stress: (D1) unloaded gel with open channel and normal trellis-like structure, (D2) normally loaded gel (σ = 5 kPa) showing channel constriction, and (D3) normally loaded gel (σ = 50 kDa) showing channel and trellis constriction.
To gain more insight into the fluid transport properties inside the gels under normal stress, we performed a series of FRAP experiments at different applied normal loads. A normal load was applied by depositing a weight on top of the gel immersed in a 40 kDa dextran-FITC fluorescent buffer.
Soft
Matter
Accepted
Manuscript
8
At rest (no load, σ= 0), the diffusion coefficients of 40 kDa dextran probes were 12 µm²/s for Cp = 1.5 and 2.5 %w/w and decreased to 8 µm²/s for Cp = 5 %w/w (Fig 2A). Under weak normal
loading (σ < σc, σc being a critical stress at which diffusion within the gel matric is drastically
reduced), the diffusion coefficient was firstly weakly impacted. At σ > σc, the diffusion
coefficient of the probe drastically decreased and could not be measured. The value of σc was
estimated at the slope transition (Fig. 2A). The values were σc = 2-8 kPa for Cp = 1.5% w/w
and σc = 8-10 kPa for Cp = 2.5% w/w chitosan gels. The transition was much smoother for Cp
= 5% w/w chitosan gels which complicated the determination of σc (estimated between 10 -
25 kPa).
To characterize the mechanical behavior of the structured gels, we performed creep/recovery tests at increasing normal stress on fully immersed chitosan gels using Dynamic Mechanical Analyzer (DMA) (Fig. 2B and Fig. S2A). This study allows to measure the characteristic times for creep and recovery at different loads. Initially, at σ < σc' (σc' being a critical stress at
which the gels does not fully recover or reach the steady state after an applied strain), the gels exhibited full elastic creep and recovery after addition and release of the normal pressure. Above σc' (σc' = 1.8 kPa for Cp = 1.5 % w/w, σc' = 7.1 kPa, for Cp = 2.5 %w/w, and, σc' = 14.2
kPa for Cp = 5 %w/w), gels were not able to reach the steady creep regime or recover
completely (Fig. S2A). This first observation showed that σc ~ σc' for all the gels tested
indicating a strong correlation between the mechanical and transport properties of these gels (Fig 2C). The creep/recovery responses were fitted using the Voigt model for creep:
Eq.1
where ε(t), εelast, εci, are the gel deformation with time, the initial gel thickness and the gel
thickness at ith creep step, respectively, and τci, is the characteristic time of the ith creep step.
Concerning the recovery process, at σ=0:
Eq. 2
Soft
Matter
Accepted
Manuscript
9
where ε∞ is the non-recoverable deformation at the end of the recovery step, εri is the
amplitude of the ith recovery component, and τri, is the characteristic time of the ith recovery
component.
In practice, two exponential terms were sufficient to adequately describe both the creep and recovery responses (i = 2), yielding to two characteristic times for creep, τc1 and τc2, and
recovery, τr1 and τr2,and their corresponding amplitudes. Thus, these observations evidenced
two different deformation regimes. A first process occurred with a characteristic time τc1 and
τr1 of about 5-10 s for creep and recovery, independently of chitosan concentration (full
symbols in Fig 2B and Fig. S2B). During this first stage, at least 95% of the gel thickness deformation occurred at σ < σc. This was followed by a slower process with a characteristic
time τc2 andτr2, ranging from 30 to 100 s, responsible for less than 5% of the gel deformation
(in the investigated creep and recovery time ranges).
To understand the nature of these 2 distinct deformation regimes, 1.5%w/w chitosan gels were
imaged by SEM at σ < σc (Fig. 2D1), at σ > σc (Fig. 2D2), and σ >> σc (Fig. 2D3). At σ < σc,
the initial gel structure was not affected by the applied normal stress. The hydrogel still exhibited open pores and channels. At σ > σc, the channels were fully filled with the polymer
matrix. The opening of the pores in the DZ were still noticeable due to the adhesion of the gel to the glass substrate during sample preparation for SEM (creating a zero slip boundary). At σ >> σc, the nanoporosity collapsed leading to the closure of the nanoporosity, referred to as
“treillis constriction” in Figure 2D3.
Finally, the mechanical properties of chitosan hydrogels were assessed by a tensile tester in compression mode. Figure S3 displays a typical loading/unloading true stress-strain curve (σv − εv curve). All gels appeared to exhibit a highly dissipative behavior characterized by a
pronounced hysteretic loop. The dissipation ratio, defined as the ratio of the area under the hysteretic loop to the stress-strain tensile curve, reached values close to 1 above εv = 50 %,
Soft
Matter
Accepted
Manuscript
10
which is indicative of a plastic behavior with no strain or stress recovery. At lower strain, εv <
20 to 50%, recovery was still observed (Fig. S3). We noticed that the plastic behavior of the gels appeared at stresses close to σc for each gel, indicating a close relationship between the
water expulsion and irreversible polymer chain rearrangements in the hydrogel structure. 2.3. Tribological properties of chitosan hydrogels
Figure 3. (A) Schemes representing the contact configurations used in the friction experiments
(SZ/SZ and DZ/DZ). Friction force, Ft, as a function of normal force, FN, (B) SZ/SZ contact and (C)
DZ/DZ contact measured by low-load tribometer. * highlights the pressure at which damage occurs in the DZ/DZ configuration.
To establish the relationship between the gel microstructure and the lubrication and wear resistance, we performed a series of tribotests at different loads using two hydrogels plugs as
Soft
Matter
Accepted
Manuscript
11
tribo pair. Gel/gel tribological measurements were performed in a geometry of contact plane/plane on a homemade tribometer in both SZ/SZ and DZ/DZ configurations (Fig. 3). No adhesion between the hydrogels nor stiction spikes were measured throughout the tribological experiments as shown in figure S5. Figure 3 represents the tangential force, Ft, as a function
of applied normal force, FN, at a constant sliding velocity of 5 mm/s. The gels were immersed
in HEPES buffer at pH 7.4. In the configuration where the two SZ were facing each other, the Amontons coefficient of friction (CoF), µ, was µ = 0.38 ± 0.02, independently of the gel concentration (Fig 3A). When the configuration was changed to DZ/DZ configuration (Fig 3B), the measured CoF at low load was firstly very close to the SZ/SZ configuration, and reached a lower value of µ = 0.18 ± 0.01 at σ > σc, about half the SZ/SZ CoF value.
Moreover, we noticed that experiments performed in the DZ/DZ configuration presented severe damage at normal pressures close to the elastic compression modulus, G', of each gel (Fig. S4 A-B). For comparison purposes, the elastic moduli measured for the present chitosan physical hydrogels were G' = 10 kPa for Cp = 1.5 %w/w, G' = 30 kPa for Cp = 2.5 %w/w, and G'
= 100 kPa for Cp = 5 %w/w (See Experimental section in SI and Fig. S4 B). Such severe
damage was never observed in the SZ/SZ configuration.
The lubrication and transport of lubricant/solvent between the contact zone and the bulk hydrogel were analyzed in the framework of the repulsion-adsorption model20, 21.
Accordingly, the friction force of a gel on a solid substrate was written as:
Eq.3
where ν is the sliding speed, η is the viscosity of the lubricant film of thickness ξg, and Kgel is
the permeability of the hydrogel to the lubricant. Upon loading and shear, the gel is excreting a thin film of lubricant maintaining the surfaces apart. Derived expressions can be used to scale the impact of the gel interfacial properties (Eq. 4) 20
, in order to extract the interfacial fluid viscosity:
Soft
Matter
Accepted
Manuscript
12
Eq. 4
where σ is the normal pressure. The Poisson's ratio was assumed to be close to 0.5, and therefore, the elastic modulus, E, was close to 3 × G For Example, the 1.5 %w/w chitosan gel
owned a shear modulus G = 10 kPa, its elastic modulus was assumed to be E = 3 × G = 3 × 10 = 30 kPa. Equation 3 can also be derived to equation 5 substituting the gel permeability, yielding:
Eq. 5
where Π0 is the gel osmotic pressure and is the correlation length of the polymer
solution. Analysis of friction data in figure 3 with equations 4 and 5 showed good agreement with the repulsive gel on solid substrate model for both configurations (Fig. S6 A-B). The viscosity of the hydrodynamic lubrication film for the DZ/DZ configuration was η = 0.8 to 1.7 mPa.s which is close to water viscosity (table 1). In the SZ/SZ configuration, η was close ranging from η = 0.9 to 2.4 mPa.s. It is noteworthy that the viscosity systematically increased when Cp decreased, suggesting a higher amount of polymer chains within the interfacial
hydrodynamic film. The values of gel permeabilities, Kgel, in the DZ/DZ configuration were
significantly higher than SZ/SZ and decreased with increasing Cp (table 1). To give more
insights in the lubrication process related to a higher gel permeability, compression studies on the chitosan gels were performed. Water exudation was systematically observed on the DZ
side (See video file in SI) and appeared at pressures very close to the critical pressures, σc,
previously discussed (SI 7 ad Fig. 2C).
Soft
Matter
Accepted
Manuscript
13
Table 1. Mechanical and thermodynamic properties of chitosan gel and fitted results using equation 4 and 5.
System Elastic Modulus (Pa)a
Interstitial film viscosity, η
(mPa.s)b Permeability of the gel, Kgel (m²) c DZ/DZ SZ/SZ DZ/DZ 10-12 SZ/SZ 10-12 1.5 %w/w chitosan 3 × 10⁴ 1.7 2.4 10.56 (±0.38) 2.96 (±0.21) 2.5 %w/w chitosan 9 × 10⁴ 1.0 1.8 4.53 (±0.01) 0.76 (±0.44) 5 %w/w chitosan 3 × 10⁵ 0.8 0.9 1.80 (±0.05) 0.15 (±0.04) a
fitting using Eq. 4; b fitting using Eq. 5
Figure 4. 2.5%w/w chitosan gel wear pictures taken by a digital microscope and using an
interferometer. The gel surface is slightly dried to make streaks or fractures appear. (A) Intact gel before wear experiment, gel wear pictures in a (B) DZ/DZ configuration at 100% G' (P = 30 kPa) showing gel destruction, and (C) SZ/SZ configuration at 100% G' showing few damage. The black areas are due to large changes in heights. As a consequence, wear is so high that the interferometric method is unable to measure accurately the actual roughness.
We analyzed the surface topography of the 2.5 %w/w chitosan hydrogels after tribotesting to
assess their resistance to wear. Figure 4 shows 2.5 %w/w chitosan gel topography using optical
Soft
Matter
Accepted
Manuscript
14
microscopy and light interferometry to quantify changes in roughness before and after tribo experiment. The initially intact gel exhibited a smooth surface (Fig. 4A). After applying a normal stress of 100% of the value of G’ (~30kPa) for the 2.5 %w/w chitosan hydrogel, severe
wear damage appeared on the DZ/DZ contact only (Fig. 4B). Wear damage was directly observable by digital microscopy via the presence of large variations of the surface profile in figure 4B, matching the black areas reported in the optical interferometry images. In the SZ/SZ, the gel surface demonstrated fewer signs of wear even though CoF in this configuration was higher (Fig. 4C). This could be explained by the weaker elastic compressive modulus of the DZ compared to the SZ even over 1.5 mm of gel thickness due to the gelation process19. These qualitative observations were confirmed by the quantitative
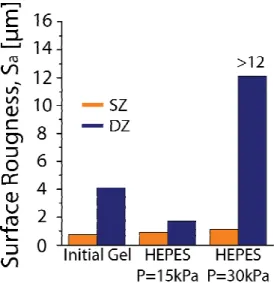
assessment of surface roughness, Sa, using interferometry (Fig. 5). Figure 5 represents the
surface roughness of chitosan gel samples after shearing the surface for 104 cycles at a normal
load of 30 kPa. The values of the surface roughness obtained from interferometry followed the previous trend observed with optical microscopy. Indeed, a low increase of surface roughness on the SZ from 0.7 to 1.1 µm with the applied pressure was noticed. In contrast, a drastic increase of Sa with the DZ/DZ configuration was observed from 4 µm to higher than
12 µm due to gel erosion and fracture at σ = 30 kPa (the final roughness is a lower bound estimation of the exact value due to large variations of the surface height in the black regions in Figure 4B). In spite of the significant damage observed by microscopy imaging, the evolution of the CoF throughout the wear test was constant, meaning that tangential forces remained constant at a fixed normal force.
Soft
Matter
Accepted
Manuscript
15
Figure 5. Quantitative analysis of gel roughness after 104 cycles at 5mm/s and under an applied load
equals to100% of elastic modulus of 2.5 %w/w chitosan hydrogel (30 kPa) in 0.1M HEPES buffer pH
7.4. The analyzed area was 20% of the total wear track.
Soft
Matter
Accepted
Manuscript
16 3. Discussions
The one-pot gelation process allowed for the formation of a structured chitosan hydrogel mimicking naturally occurring features found in cartilage22, 23 such as the superficial
membrane (SZ) and the middle zone composed of vertically aligned channels. The formation of these microstructures is the result of a two-steps process: first, the rapid gelation of chitosan chains at the interface between the chitosan solution and the base solution and second, a slower gelation regime occurring deeper within the gel leading to partial disentanglements and formation of channels. Recent reports have shown that chitosan hydrogels exhibit such a multi-layered structure that depends on the kinetics of the gelation process2, 19, 24. A similar multi-layered structure has also been reported for different natural
polymer, such as collagen25 and alginates26.
The transport properties of the structured gels exhibit similarities to those observed in natural cartilage. The diffusion coefficient of polymeric probes obtained in our study were close to that deduced from similar experiments carried out on articular cartilage using a 70 kDa dextran-FITC fluorescent probe. Fetter et al. obtained a diffusion coefficient parrallel to the cartilage surface of 34 µm²/s27, while Greene et al. measured a diffusion coefficient of 3.8
µm²/s28. Our results show that under normal load, the 40 kDa dextran-FITC probe diffusion in
the layered gel was close to the NMR and FRAP studies from Greene et al.28. These authors
also reported a constant value of the diffusion coefficient below a critical stress and an abrupt drop of diffusion above this stress28. The authors explained such behavior to result from the
compression of a treillis-like structure with channels distributed vertically. Upon compression at σ < σc, the collapsing channels do not impact macromolecule diffusion inside the matrix. At
higher compression (at σ > σc), the treillis constriction leads to a drastic decrease of the probe
Soft
Matter
Accepted
Manuscript
17
diffusion. In our study, this phenomenon was observed at Cp = 1.5 and 2.5 %w/w and was less
pronounced for the 5 %w/w chitosan gel which does not present these channels.
Our results showed that the layered microstructure of the gels lead to peculiar poroelastic properties, observed only in natural materials similarly structured.
In addition, we observed two mechanical regimes separated by a critical pressure, σc, which
depends on Cp. At σ < σc, the gels were found to behave as viscoelastic materials with short
characteristic creep and recovery times. In this regime, the porosity of the gels was not affected by the load as shown by probe diffusion measurements. Below σc, the channels
provide enough free volume to facilitate fluid transport. Interestingly, for the gels that did not present microchannels (but still exhibited the superficial membrane), these changes in mechanical properties were still apparent around σc, but were less pronounced in terms of
transport properties (diffusion). This observation confirms that the channel structure has a prominent role on fluid transport and polymer diffusion rather than on the mechanical properties. Above σc, microchannels were found to be obstructed, limiting fluid flow within
the polymer matrix. Beyond this regime, the hydrogels suffered irreversible mechanical changes and plastic deformations.
The tribological behavior of the gels was not controlled by their mechanical properties since the CoF was independent of Cp for each configuration tested. At σ < σc, the CoF was
independent of the configuration (µ ~ 0.3), while at σ > σc, we observed that µSZ/SZ > µDZ/DZ.
The observed friction change on the DZ/DZ configuration at σ > σc is attributed to the
hydrogel deformation, the microchannel closure and the water exudation to the surface leading to a more efficient lubrication. Our results show for the first time a correlation between the gel permeability and the COF suggesting that the friction dissipation at the
hydrogel interface involves exudation via liquid pressurization. This is in agreement with the
results of Khosla et al. who showed a drastic drop of CoF for porous PDMS surfaces sliding
Soft
Matter
Accepted
Manuscript
18
in water due to the creation of pressurized water pockets able to feed the hydrodynamic lubrication film29.
The gel wear resistance was found to be governed by the hydrogel layered-structure since the SZ/SZ configuration exhibited significantly less wear than the DZ/DZ configuration. Therefore, the gel membrane present at the SZ acts as a protective layer which mechanical and transport properties are very different from those of the gel bulk30.
In a nutshell, our observations echo many studies performed of natural materials such as structured tissues. The developed chitosan gels therefore offer a unique opportunity to study and rationalize dynamic mechanical processes occurring in such tissues under controlled conditions.
Soft
Matter
Accepted
Manuscript
19 4. Conclusion
The present work shows that structuring allows controlling wear and lubrication independently without the necessity of changing material or lubricant composition. Bioinspiration is thus a promising route to design efficient cartilage substitutes by taking advantage of the natural structures found in living tissues. A better attention should be paid to the transport and tribological properties of hydrogels, besides the choice of the polymer and the focus on the mechanical properties, to ensure adequate response and sustainability in vivo. Further studies are ongoing to improve the lubrication and anti-wear properties of soft and porous materials by using synthetic synovial fluids interacting synergistically and dynamically with such hydrogels31.
Soft
Matter
Accepted
Manuscript
20 5. Experimental Section
5.1 Materials
Chitosan (Mw 6.04 105 g/mol, Mw/Mn 1.64, DA 4.3%, from squid pen chitin) was purchased
from Mahtani Chitosan Pvt. Ltd. Acetic acid, ammonium hydroxide, HEPES and FITC-modified dextran probes (4.0 104 g/mol, 5.00 105 g/mol, and 2.00 106 g/mol) were supplied
from Sigma-Aldrich. NaOH pellets, NaCl, and absolute anhydrous ethanol were obtained from Carlo Erba Reagents.
5.2 Chitosan Purification
Chitosan was purified on filtration columns with Millipore membranes. A 0.5 %w/w acidic
chitosan aqueous solution was prepared by adding a stoechiometric amount of acetic acid to glucosamine units. The solution was passed though filtration columns with a pressure kept constant at 3 bars with membrane porosities of successively 3, 0.8, and 0.45 µm. Chitosan was precipitated by adding a small amount of ammonium hydroxide to get a pH of 9 and thoroughly washed with distilled water using a centrifuge (10 min at 10000 rpm). Supernatant was removed and replaced by pure water and the procedure was repeated up to distilled water pH. Finally, chitosan was freeze-dried to obtain a purified powder.
5.3 Polymer Characterizations
The molar mass, dispersity, and radius of gyration of chitosan and dextran fluorescent probes were analyzed using aqueous Gel Permeation Chromatography (Wyatt Technology). Refractive Index (rEX), UV (DAWN HELEOS), and QELS (Wyatt QELS+) detectors were used for the experiments. GPC parameters for chitosan analysis were: flow rate 0.5 mL/min,
dn/dc(chitosan) 0.198 mL/g, , TSK6000 and TSK2500 columns (Tosoh Bioscience LLC.),
column temperature 25 °C, laser wavelength 664 nm. Samples were dissolved at 0.5 mg/mL in filtered acetic acid buffer (pH 4.5, filtered at 0.1 µm using CME membrane) and filtered at
Soft
Matter
Accepted
Manuscript
21
0.45 µm on CME membrane. For dextran-FITC analysis, parameters were: flow rate 0.5 mL/min, dn/dc(DexFITC) 0.152 mL/g, , TSK6000 and TSK2500 columns, column temperature 25 °C, laser wavelength 664 nm. Samples were dissolved at 0.5 mg/mL in filtered Phosphate Buffered Saline buffer (PBS) (pH 7.4, 10 mM PBS, 0.15 M NaCl, filtered at 0.1 µm using CME membrane) and filtered at 0.45 µm on CME membrane.
The degree of acetylation of chitosan was assessed using 1H-NMR spectroscopy (Bruker 400
MHz). The DA was calculated according to the method of Hirai et al.,32 from the ratio the
integration of acetyl group protons (δ: 2.4-1.7 ppm) by the integration of glucosamine unit protons (δ: 4.3-2.7 ppm). Chitosan was dissolved in D2O with 5 µL of 37 % HCl solution for
12 h at room temperature. 5.4 Chitosan hydrogel disks
A chitosan solution was prepared by dissolving purified chitosan powder into water at the polymer concentrations 1.5, 2.5 and 5 %w/w with a stoechiometric amount of glacial acetic
acid to ensure the protonation of every amino groups using the following equation:
݉ܿℎ݅ݐݏܽ݊ = ݉ܿℎ݅ݐݏܽ݊ × ሺ1 − ܦܣሻ × ሺ1 − ݉ݓܽݐ݁ݎ 100 ሻ × ܯܽܿ݁ݐ݅ܿ ܽܿ݅݀ ܯܿℎ݅ݐݏܽ݊ Eq. 6
m being the mass (g), M is the molar weight (g/mol) and Mchitosan is defined by Mchitosan = 42 x
DA + 161 33-35. The chitosan dissolution was performed in a closed reactor under mechanical
stirring at 4 °C for one day. The resulting chitosan solution was then placed in centrifuge syringes (Optimum®, Nordson EFD, USA) to remove air bubbles by repetitive centrifugations (5 min at 5000 rpm) and was extruded between two plastic foils with holds to control the thickness of the final gels (1.5 mm). The upper plastic foil was removed and the flattened chitosan solution was placed in a 1 M NaOH coagulation bath until the gelation process was completed. Gel disks were then cut with a biopsy punch of 11 or 25 mm diameter
Soft
Matter
Accepted
Manuscript
22
and washed several times in distilled water to reach deionized water pH. The obtained hydrogel disks were stored in distilled water prior to use.
5.5 SEM on chitosan aerogels
Hydrogel samples were firstly changed for 100% alcogel by immersing hydrogels into successive ethanol baths (10, 30, 50, 70, 90, and 100% ethanol in water) for 30 min each. Aerogels were obtained by exchange between ethanol and CO2 supercritic fluid using an
automated critical point dryer (EM CPD300, Leica). 20 exchange cycles were needed followed by a very slow CO2 degassing at 37 °C. Samples were then carbonated and imaged
using an scanning electronic microscope (Merlin Compact, Zeiss). To visualize the impact of a normal stress on the gel structure, precisely weighted loads was applied on top of the hydrogels prior to aerogel formation.
5.6 Observation of hydrogels and FRAP experiments by confocal laser scanning fluorescence microscopy (CLSM)
CLSM micrographs of the hydrogels were obtained using a laser scanning confocal microscope (Zeiss 510 LCM) with a 10 x 0.3NA dry neofluor objective. Chitosan hydrogels were incubated with 0.6 mg/mL 40 kDa dextran-FITC fluorescent probes in a HEPES buffer (0.1 M HEPES, 150 mM NaCl and pH 7.4) for 24 h in a dark container at 4 °C. Excitation was conducted at 488 nm at 3% laser intensity (excitation laser source was set at 50%) and emission collected from 505 to 670 nm. The photomultiplicator (PMT) gain was set at 525. Pictures were taken in a fluorescent probe bath on both sides and on the side of a gel slice. Imaging, gel porosity, and macromolecule diffusion under stress were recorded by Fluorescence Recovery After Photobleaching (FRAP) technique36 at a depth of 100 µm. In
each experiment, small hydrogel disks were cut from chitosan gel membranes to get 5 mm diameter and 1.5 mm thick pieces and were incubated in 0.6 mg/mL 40 kDa dextran-FITC buffered solution (0.1 M HEPES, 150 mM NacL and pH 7.4) for 24 h to ensure complete homogenization. The gels were then mounted in CLSM and immersed in the fluorescent
Soft
Matter
Accepted
Manuscript
23
probe buffered solution. For FRAP experiment under load, each dextran-FITC concentration was fixed at 0.6 mg/mL and PMT gain was kept constant at 525. To ensure the recording of a 2D diffusion (in the focal plan) and the use of a mathematical fit, a full cylinder was bleached after intense photobleaching (100% laser intensity)36. In this case, the cylindrical bleaching
volume avoids diffusion in the third dimension. 512x512 pixels images of a confocal xy plan (100 µm above the bottom of the plate, 15 µm of thickness) were scanned at 3 % laser initial intensity (I < 0) (15 pre-bleach scan images). At t = 0, a circle of 55 µm diameter is bleached with 50 iterations (about 10 s total) at 100 % laser intensity (I0). A total of about 500 images
scans (acquisition time < 1 s each) were collected for each sample. 5 repetitions were done per experiment. For diffusion under stress experiments, weights were deposited on a cover glass directly on top of the disks. To measure the diffusion coefficients, the gels were left to equilibrate 5 min prior to FRAP measurements. The transitory state was also recorded.
5.7 Mechanical properties by Dynamic Mechanical Analysis
Gel samples were die-cut with a 12 mm diameter punch and placed in a compression module. An aqueous bath was mounted to maintain complete hydration of gel disks and also water recovery after unconfined compression at room temperature. Firstly, a series of creep/recovery experiments were performed under constant stress using a DMA (DMA 800, TA Instrument). An initial preload of 0.02 N was applied to measure the sample thickness. Then, a constant load was applied for 5 min and the gel length was monitored as a function of time. After 5 min of gel creep, the load was removed (set to initial value of 0.02 N) and the gel was free to re-swell. The gel length recovery was then monitored as a function of time for 5 min. This cycle was repeated several times with increasing loads upon creep from 0.05 to 2 N (corresponding to stresses from 0.5 to 20 kPa). Data were fitted using the Maxwell's approach taking into account the sum of different phenomena of specific response time via a sum of exponentials.
Soft
Matter
Accepted
Manuscript
24 5.8 Tribological properties
Due to the process of gelation, physical chitosan hydrogel disks offered a bilayered structure. To assess friction properties of chitosan hydrogels on both sides, die-cut gel disks were tested by putting into contact either SZ/SZ or DZ/DZ configurations. A low-load tribometer consisting of an upper mobile part applying a sinusoidal motion and a servo-controlled load (to avoid the relaxation effect of the gel) and a lower immobile part sensing the normal and lateral forces was used. A cantilever spring (linking the upper mobile part and a pin where the 11 mm diameter gel disk is glued) transmitted a vertical load to the bottom surface. A nut allowed the pin to rotate to find a flat contact between the gels. The lower immobile part was equipped with lateral and normal force sensors. The lower 25 mm diameter gel was glued within a bath mounted on top of the lower immobile part. To glue the gels on metallic lower and upper parts, gels were slightly dried on the non-studied sides and deposited on waterproof glue (Superglue 3 Power Flex, Loctite). The bath was immediately filled with 0.1 M HEPES pH 7.4 buffer and left to incubate for 1 h. Both gels were brought into slight contact to ensure flat contact and the nut was tightened. The friction force and normal forces were measured as average values in the middle of the stroke (represented by green rectangles in Fig. S5) to avoid any edge effect due to the direction and speed changes and to ensure that the dynamic friction coefficient is assessed.
5.8.1 Normal force friction test: Upper and lower gels were brought into contact. A fixed 1
Hz oscillation frequency was applied along with a 5 mm lateral motion. Normal Force was successively increased from 0.05 N to 10 N (from 500 Pa to 100 kPa). Friction runs were performed over 250 cycles for each load.
5.8.2 Wear resistance: To assess wear, only 2.5 %w/w chitosan hydrogels were used at 1 Hz
oscillation frequency, 5 mm lateral motion and 3 N (~ G') normal forces for 10000 cycles. At the end of the test, the hydrogels were detached from the metallic parts, slightly dried on the
Soft
Matter
Accepted
Manuscript
25
studied surface using compressed air, analyzed qualitatively by a digital microscope (VHX-1000, Keyence) and quantitatively by interferometry (ContourGT-K 3D, Bruker).
Supporting Information
Supporting Information is available from the Royal Society of Chemistry Library or from the author.
Acknowledgements
XB acknowledges the financial support from CHIR (CRC and Bridge grants) and NSERC (Discovery grant). JF is grateful to the Arthritis Society (TGP-16-183) and to the French Embassy for financial supports (Frontenac scholarship). We thank Agnes Crépet (IMP) and Pierre Alcouffe (IMP) for their technical assistance in size exclusion chromatography and scanning electron microscopy, respectively. We are also indebted to Matthieu Guibert (LTDS) for the low-load tribometer design and fabrication and Thomas Malhomme (LTDS) for wear characterization by interferometer. The help of Béatrice Burdin (Centre Technologique des Microstructures) for CLSM study implementation is also acknowledged.
Conflict of Interest
The authors declare no conflict of interest
Keywords
hydrogel microstructure, gel-gel friction, lubrication, wear resistance, chitosan
Soft
Matter
Accepted
Manuscript
26 [References]
1. J. J. Green and J. H. Elisseeff, Nature, 2016, 540, 386-394.
2. S. G. Ladet, K. Tahiri, A. S. Montembault, A. J. Domard and M. T. M. Corvol,
Biomaterials, 2011, 32, 5354-5364.
3. A. Montembault, K. Tahiri, C. Korwin-Zmijowska, X. Chevalier, M. T. Corvol and A. Domard, Biochimie, 2006, 88, 551-564.
4. D. Puppi, F. Chiellini, A. M. Piras and E. Chiellini, Progress in Polymer Science, 2010, 35, 403-440.
5. F.-Y. Hsieh, T.-C. Tseng and S.-h. Hsu, Neural Regeneration Research, 2015, 10, 1922-1923.
6. F. Croisier and C. Jérôme, European Polymer Journal, 2013, 49, 780-792.
7. J. Mao, L. Zhao, K. De Yao, Q. Shang, G. Yang and Y. Cao, Journal of biomedical
materials research. Part A, 2003, 64, 301-308.
8. T. R. Hoare and D. S. Kohane, Polymer, 2008, 49, 1993-2007.
9. M. Hamidi, A. Azadi and P. Rafiei, Advanced Drug Delivery Reviews, 2008, 60, 1638-1649.
10. P.-L. Latreille, S. Alsharif, O. Gourgas, S. F. Tehrani, V. G. Roullin and X. Banquy,
Colloids and Surfaces A: Physicochemical and Engineering Aspects, 2017, 529,
739-749.
11. I. M. El-Sherbiny and M. H. Yacoub, Global Cardiology Science & Practice, 2013, 2013, 316-342.
12. C. A. Vilela, C. Correia, J. M. Oliveira, R. A. Sousa, J. Espregueira-Mendes and R. L. Reis, ACS Biomaterials Science & Engineering, 2015, 1, 726-739.
13. S. E. Naleway, M. M. Porter, J. McKittrick and M. A. Meyers, Advanced Materials, 2015, 27, 5455-5476.
14. P. Lin, R. Zhang, X. Wang, M. Cai, J. Yang, B. Yu and F. Zhou, ACS Macro Letters, 2016, 5, 1191-1195.
15. M. Liu, X. Zeng, C. Ma, H. Yi, Z. Ali, X. Mou, S. Li, Y. Deng and N. He, 2017, 5, 17014.
16. L. Rami, S. Malaise, S. Delmond, J.-C. Fricain, R. Siadous, S. Schlaubitz, E. Laurichesse, J. Amedee, A. Montembault, L. David and L. Bordenave, Journal of
Biomedical Materials Research Part A, 2014, 102, 3666-3676.
17. T. Hao, N. Wen, J. K. Cao, H. B. Wang, S. H. Lü, T. Liu, Q. X. Lin, C. M. Duan and C. Y. Wang, Osteoarthritis and Cartilage, 18, 257-265.
18. S. Kaderli, C. Boulocher, E. Pillet, D. Watrelot-Virieux, A. L. Rougemont, T. Roger, E. Viguier, R. Gurny, L. Scapozza and O. Jordan, International journal of
pharmaceutics, 2015, 483, 158-168.
19. J. Nie, W. Lu, J. Ma, L. Yang, Z. Wang, A. Qin and Q. Hu, Scientific Reports, 2015, 5, 7635.
20. J. P. Gong, G. Kagata, Y. Iwasaki and Y. Osada, Wear, 2001, 251, 1183-1187.
21. J. P. Gong, G. Kagata and Y. Osada, The Journal of Physical Chemistry B, 1999, 103, 6007-6014.
22. I. ap Gwynn, S. Wade, M. J. Kaab, G. R. Owen and R. G. Richards, J. Microsc., 2000, 197, 159-172.
23. I. ap Gwynn, S. Wade, K. Ito and R. G. Richards, European cells & materials, 2002, 4, 18-29.
24. S. Ladet, L. David and A. Domard, Nature, 2008, 452, 76-79.
25. K. Furusawa, S. Sato, J.-i. Masumoto, Y. Hanazaki, Y. Maki, T. Dobashi, T. Yamamoto, A. Fukui and N. Sasaki, Biomacromolecules, 2012, 13, 29-39.
Soft
Matter
Accepted
Manuscript
27
26. Y. Maki, K. Ito, N. Hosoya, C. Yoneyama, K. Furusawa, T. Yamamoto, T. Dobashi, Y. Sugimoto and K. Wakabayashi, Biomacromolecules, 2011, 12, 2145-2152.
27. N. L. Fetter, H. A. Leddy, F. Guilak and J. A. Nunley, Journal of Orthopaedic
Research, 2006, 24, 211-219.
28. G. W. Greene, B. Zappone, B. Zhao, O. Soderman, D. Topgaard, G. Rata and J. N. Israelachvili, Biomaterials, 2008, 29, 4455-4462.
29. T. Khosla, J. Cremaldi, J. S. Erickson and N. S. Pesika, ACS Applied Materials &
Interfaces, 2015, 7, 17587-17591.
30. T. Murakami, S. Yarimitsu, N. Sakai, K. Nakashima, T. Yamaguchi, Y. Sawae and A. Suzuki, Proceedings of the Institution of Mechanical Engineers, Part J: Journal of
Engineering Tribology, 2017, DOI: 10.1177/1350650117712881, 1350650117712881.
31. J. Faivre, B. R. Shrestha, J. Burdynska, G. Xie, F. Moldovan, T. Delair, S. Benayoun, L. David, K. Matyjaszewski and X. Banquy, ACS Nano, 2017, 11, 1762-1769.
32. A. Hirai, H. Odani and A. Nakajima, Polymer Bulletin, 1991, 26, 87-94.
33. N. Sereni, A. Enache, G. Sudre, A. Montembault, C. Rochas, P. Durand, M. H. Perrard, G. Bozga, J. P. Puaux, T. Delair and L. David, Langmuir, 2017, 33, 12697-12707.
34. A. Fiamingo, A. Montembault, S.-E. Boitard, H. Naemetalla, O. Agbulut, T. Delair, S. P. Campana-Filho, P. Menasché and L. David, Biomacromolecules, 2016, 17, 1662-1672.
35. A. Montembault, C. Viton and A. Domard, Biomaterials, 2005, 26, 933-943.
36. J. C. G. Blonk, A. Don, H. Van Aalst and J. J. Birmingham, Journal of Microscopy, 1993, 169, 363-374.
Soft
Matter
Accepted
Manuscript
Microchannel
Superficial layer (SZ)
Deep zone (DZ)
100 µm
10 µm
SZ vs. SZ
DZ vs. DZ
µ = 0.18 ± 0.01
µ = 0.38 ± 0.02
Contact
Configurations
for Tribo-pairs
Wear assessment
by Interferometry
Coefficient of
Friction
SEM imaging of SZ
SEM imaging of DZ
Physical Chitosan Hydrogel Structure
F
Nv
Page 28 of 28 Soft MatterSoft
Matter
Accepted
Manuscript
1
Supplementary Information
Bioinspired Microstructures of Chitosan Hydrogel Provide Enhanced Wear Protection
Jimmy Faivre,
Guillaume Sudre, Alexandra Montembault,
Stéphane Benayoun,
Xavier
Banquy*,
Thierry Delair, Laurent David*
J. Faivre, G. Sudre, A. Montembault,
Prof. T. Delair, Prof. L. David
Université de Lyon, Université Claude Bernard Lyon 1, CNRS, IMP, UMR 5223, 15
Boulevard Latarjet, F-69622, Villeurbanne, France
*E-mail: laurent.david@univ-lyon1.fr
J. Faivre , Prof. X. Banquy
Canadian Research Chair in Bioinspired Materials, Faculty of Pharmacy, Université de Montréal, Montréal, Qc, Canada
*E-mail: xavier.banquy@umontreal.ca
Prof. S. Benayoun
Laboratoire de Tribologie et Dynamique des Systèmes, UMR 5513 CNRS, Ecole Centrale de Lyon, 36 Avenue Guy de Collongue, 69134 Ecully Cedex, France
2
Chitosan hydrogel disks were characterized for their rheological properties using an AR2000 rheometer (TA Instruments, USA). A parallel plate geometry was mounted with a water trap to limit water evaporation during measurement. Viscoelastic properties were performed at 1% gel deformation in frequency sweep mode in the linear domain (n = 5).
1.2 Stress-strain curves
Stress-strain curves were recorded for each gel using a Shimadzu AG-X+ 10 kN tensile tester. Load/Unload cycles were applied on top of a gel with increasing strain (10, 20, 30, 50, 70, and 80% of initial gel thickness) and the resulting stress is recorded. The compression plates were lubricated with mineral oil to avoid barreling effects. A compression study was performed following the same procedure as for the stress-strain curve except that a linear strain at a rate of 0.6 mm/min was applied on top of the gels. Water exudation was directly observed by the means of a camera.
1.3 Osmotic pressure assessments
Chitosan gel osmotic pressure was evaluated to determine the gel permeability using Eq. 5. The gel osmotic pressure determinations were carried out after de-swelling the gels by the dialysis bag method described elsewhere1, 2. The gel disks were positioned at the contact of semi permeable regenerated cellulose membranes (MWCO 2 kDa, spectrum lab) and the sealed bags were immersed in an aqueous polyvinylpyrrolidone solution (8.7 10-2 mg/mL, Mw = 29 kDa, Sigma-Aldrich) with a known osmotic pressure equal to 30.5 kPa and buffered with HEPES at 0.1 M and pH 7.4 at constant room temperature. After equilibrium is reached (4 days), gels are removed, weighed and viscoselastic measurements are performed using an AR2000ex rheometer to assess the shear moduli.
3
S1. Diffusion properties of chitosan hydrogels using different dextran-FITC probe sizes. 2 MDa Dextran-FITC diffusion was not detected by the FRAP technique.
Table S1. Fluorescent probe characteristics (molecular weight (Mw), dispersity (PdI) and radius of gyration (Rg)) in HEPES buffer pH 7.4 NaCl 50mM.
Fluorescent probe Mw (g/mol)a PdIa Rg (nm)a Rg (Rg=0.025*Mw0.5)b
40kDa DexFITC 3.85×10⁴ 1.31 8 5
500kDa DexFITC 4.68×10⁵ 1.81 22.5 17.7
2MDa DexFITC 1.81×10⁶ 1.50 41.2 35.4
4
S2. (A) Creep/recovery cycles with increasing load of chitosan hydrogels assessed by DMA and (B) characteristic times of chitosan hydrogels during recovery
5
S4. (A) Pressure at gel damage measured for the chitosan hydrogels on the DZ/DZ configuration and (B) shear and storage moduli of chitosan hydrogels.
S5. (A) Typical friction and normal forces profiles for 2.5 %w/w chitosan gels on the DZ/DZ configuration at a speed of v = 5 mm/s and (B) zoom in the friction profile showing no stiction in the friction signal. These data correspond to that of Figure 3B for the chitosan gel at 2.5 %w/w at P = 3 kPa. Green rectangles represent the areas where the friction/normal forces were measured.
6
S7. Compression study of chitosan hydrogels showing the critical strains for exudation of water for
different chitosan hydrogels.
References
1. E. Geissler, F. Horkay and A. M. Hecht, Macromolecules, 1991, 24, 6006-6011.
2. F. Horkay and P. J. Basser, Journal of polymer science. Part B, Polymer physics, 2008, 46, 2803-2810.
3. K. Andrieux, P. Lesieur, S. Lesieur, M. Ollivon and C. Grabielle-Madelmont, Analytical