HAL Id: hal-01152326
https://hal.archives-ouvertes.fr/hal-01152326
Submitted on 15 May 2015
HAL is a multi-disciplinary open access
archive for the deposit and dissemination of
sci-entific research documents, whether they are
pub-lished or not. The documents may come from
teaching and research institutions in France or
abroad, or from public or private research centers.
L’archive ouverte pluridisciplinaire HAL, est
destinée au dépôt et à la diffusion de documents
scientifiques de niveau recherche, publiés ou non,
émanant des établissements d’enseignement et de
recherche français ou étrangers, des laboratoires
publics ou privés.
Claudine Foucherot, Valentin Bellassen
To cite this version:
Claudine Foucherot, Valentin Bellassen. Carbon Offset Projects in the Agricultural Sector. [Research
Report] 31, auto-saisine. 2011, pp.40. �hal-01152326�
C
ARBON OFFSET PROJECTS IN THE AGRICULTURAL SECTOR
Claudine Foucherot
1
and Valentin Bellassen
2
The agricultural sector accounts for 14% of global anthropogenic greenhouse gas emissions. If we also take into account carbon emissions and sequestration from upstream – production of fertilisers, deforestation, etc. – and downstream – bio-energies, etc. – the share rises to 30%. Many practices and technologies enable agriculture's impact on climate change to be reduced. According to a number of estimates that are summarised in this research, the agricultural sector’s mitigation potential is of the same order of magnitude as its emissions over a period of 30 years. However, changing agricultural practices comes at a cost, and in most cases such changes are not made without economic incentives.
Carbon offsetting projects are one of the economic tools available to reduce agricultural emissions by paying for metric tons of avoided CO2e emissions. A summary of the emission reductions enabled by
agricultural projects to date is provided in this report. It covers most projects certified by quality assurance standards, including those set up by the Kyoto Protocol (Clean Development Mechanism and Joint Implementation) and those in the voluntary market (Verified Carbon Standard, Climate Action Reserve, Gold Standard, Chicago Climate Exchange, and American Carbon Registry). The assessment drawn up on this basis shows that emission reductions enabled through carbon offsetting are thousand times lower than actual emissions and their potential mitigation. Agricultural projects have reduced emissions by 14 MtCO2e in 2010, i.e. 7% of the reductions generated by all carbon offset projects across all sectors for this
year.
Initiatives focus on three technologies: bio-energies (crop residues), methanisation of livestock waste, and soil carbon sequestration using no-till practices. This is very little compared with the large number of mitigation technologies that could be used in this sector. The diffuse nature of agricultural emissions and the cost of the abatement measures are the main obstacles to developing agricultural projects. However, the introduction of multi-farm aggregators enables to share costs. Moreover, research on new techniques for measuring emissions more efficiently and less costly is a mean to overcome these obstacles and release the mitigation potential.
1
Claudine Foucherot is a junior research analyst at CDC Climat Research. Her research focuses on greenhouse gas reduction in the agricultural sector.
2
Valentin Bellassen is the research unit manager at CDC Climat Research. His research focuses on carbon offsetting (emission-reducing initiatives developed within the UN or other frameworks), the forestry/wood products sector and the agricultural sector. In addition, he has been accredited by the United Nations Framework Convention on Climate Change to review national greenhouse gas inventories.
A
CKNOWLEDGEMENTS
The authors would like to thank all those who helped them to draft this report, especially
Siddarth Yadav (SGS UK limited), Andrew Prag (OECD), Simon Kay (European
Commission JRC),
Olivier Lapierre (director of Céréopa), Cecilia Bellora (FARM), Nicolas
Chung and Elise Stoffaes (CDC Climat), Stéphane De Cara (INRA
),Audrey
Trevisiol
(ADEME), Fanny Fleuriot (ADEME), Eric Vesine (ADEME), Pierre Cazeneuve (GCL
Développement Durable). The authors are also thankful to the entire CDC Climat Research
team for the intellectual stimulation and the numerous comments and suggestions at all
stages of this study.
Publishing director: Benoît Leguet - ISSN 2101-4663
This publication is fully-funded by ―Caisse des Dépôts‖, a public institution. CDC Climat does not contribute to the financing of this research.
Caisse des Dépôts is not liable under any circumstances for the content of this publication.
This publication is not a financial analysis as defined by current regulations.
The dissemination of this document does not amount to (i) the provision of investment or financial advice of any kind, (ii) or of an investment or financial service, (iii) or to an investment or financial proposal of any kind.
There are specific risks linked to the markets and assets treated in this document. Persons to whom this document is directed are advised to request appropriate advice (including financial, legal, and/or tax advice) before making any decision to invest in said markets.
The research presented in this publication was carried out by CDC Climat Research on an independent basis. Organisational measures implemented at CDC Climat have strengthened the operational and financial independence of the research department. The opinions expressed in this publication are therefore those of the employees of CDC Climat Research alone, and are independent of CDC Climat’s other departments, and its subsidiaries.
The findings of this research are in no way binding upon, nor do they reflect, the decisions taken by CDC Climat’s operational investment and broking services teams, or by its subsidiaries. CDC Climat is not a provider of investment or financial services.
I
NTRODUCTION4
I.
T
HE AGRICULTURAL SECTOR:
A MITIGATION POTENTIAL THAT MATCHES ITS EMISSIONS5
A. Classification of sources of emissions and mitigation 5 B. Estimating emissions and mitigation potential by sub-sector at global level 8 C. Estimating regional emissions and mitigation potential 11
D. The French example 14
II.
C
ARBON OFFSET PROJECTS:
A MEANS OF MONETISING EMISSION REDUCTIONS16
A. Compensation makes agriculture an integral part of carbon markets 16B. Carbon offset standards 18
C. Three examples of agricultural projects 20
III.
L
ESSONS DRAWN FROM THE733
AGRICULTURAL PROJECTS21
A. The importance of accurate measurements when implementing agricultural projects 21 B. Agricultural projects are not equally divided between areas 25 C. Several standards for different types of projects 26
D. Diffuse emissions mean high transaction costs 27
E. Adaptability to the local environment and the pioneering nature of project mechanisms 28 F. Managing storage reversibility: temporary credits or insurance 29
IV.
C
ONCLUSION29
A
PPENDICES31
Appendix 1 – The nitrogen and carbon cycle 31
Appendix 2 – Estimating global emissions 32
Appendix 3 – Estimating global mitigation potential 34
Appendix 4 – Estimating emissions in France 35
Appendix 5 – Estimating the mitigation potential in France 35 Appendix 6 – Calculating the global mitigation potential breakdown 36 Appendix 7 – Difference between French and global mitigation calculation techniques 36
Appendix 8 – Change in the number of credits issued 37
4
I
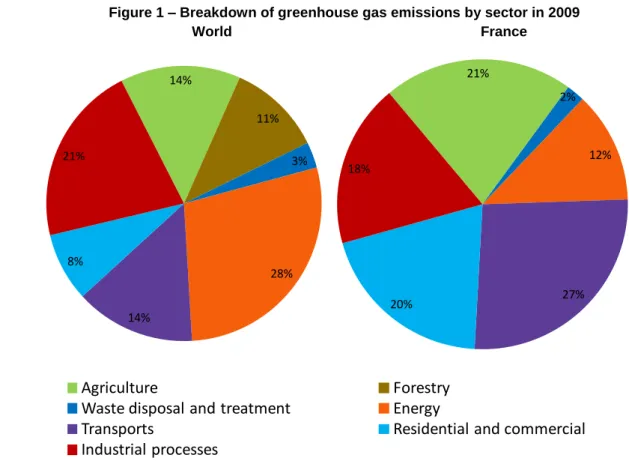
NTRODUCTIONAgriculture is the fourth largest sector in terms of global anthropogenic greenhouse gas (GHG) emissions. It accounts for 14% of global emissions, i.e. 6.6 GtCO2e/year (see Figure 1, IPCC 2007). Three types of
gas are involved: nitrous oxide (N2O), methane (CH4), and to a lesser extent carbon dioxide (CO2). In fact,
agriculture is the largest sector when it comes to emitting gases other than carbon dioxide, and accounts for 60% and 50% of global N2O and CH4 emissions respectively (Smith, Martino, and al. 2007).
In France, the agricultural sector has the second highest emissions after the transportation sector (CITEPA 2011). Its share of emissions in France is higher than at global level, as it accounts for 21% of all domestic emissions (i.e. 105 MtCO2e out of 496 MtCO2e in 2009). This situation is explained by two
factors. Firstly, France is the largest agricultural producer in Europe. Secondly, the French electricity sector emits less greenhouse gas than in other countries, due to the importance of nuclear and hydroelectric power, which account for 76% and 11% of electricity generation respectively (MEEDDM 2010). Meanwhile, the French forestry sector does not actually emit any greenhouse gas, as it is a net carbon sink that sequestered 80 MtCO2e in 2009 (CITEPA 2011).
Figure 1 – Breakdown of greenhouse gas emissions by sector in 2009 World France
Note: The breakdown of French greenhouse gas emissions by sector is for Metropolitan France only. The forestry sector is not shown, as it is a net sink in Metropolitan France, while emissions for the energy sector correspond to national energy generation and transformation, and international traffic is not taken into account for the transportation sector.
World source: IPCC (2007) reviewed according to Van der Werf et al. (2009). French source: CITEPA (2011).
14% 11% 3% 28% 14% 8% 21%
Agriculture
Forestry
Waste disposal and treatment
Energy
Transports
Residential and commercial
Industrial processes
21% 2% 12% 27% 20% 18%5 The IPCC sector breakdown used in Figure 1 does not show all the emissions over which farmers have an effective lever: ―upstream‖ emissions, which correspond to the production of fertilisers, pesticides, animal feeds and agricultural machinery, and emissions caused by deforestation intended to increase agricultural land are not classified as agricultural emissions, neither are emissions linked to the consumption of fossil fuels on farms. If we factor in all these sources of emissions, agriculture’s share of total global GHG emissions amounts to around 30%, both on a global scale (World Bank 2009) and in France.
Agricultural emissions are therefore substantial, but the sector’s potential to play a role in mitigating climate change is just as significant. That potential includes implementing certain practices and technologies, which enable:
A reduction in emissions from agricultural activities: in this case, changes in practices have a direct impact on the sources of emissions. This is the case, for instance, when farmers reduce their use of nitrogen fertilisers, which reduces nitrous oxide (N2O) emissions from cropland and pasture;
An increase in carbon storage: agricultural soils can be a carbon source or a carbon sink depending on farming practices. For instance, low tillage or the sowing of intermediate crops enables more carbon to be sequestered in the soil;
The replacement of fossil fuels by biomass energy: biomass intended for energy generation comes from crop residues – rice husks, bagasse, etc. – or from dedicated crops like miscanthus or sugar cane. It can be burned directly or turned into bio-fuels. There are a lot of discussions regarding the environmental benefits of bio-energies at the present time, particularly on the issue of land-use change. These considerations will be detailed in the following section.
The first section of this Climate Report reviews the agricultural sector’s emissions and mitigation potential, and extends its limits to the sector’s upstream and downstream activities. The aim is to describe the sub-sector and regional breakdown of the emissions and mitigation potential attributed to agricultural activities. The second section sets out agriculture’s role in carbon markets. The third section draws lessons from the 733 projects surveyed. This section primarily explains the reasons behind the success of certain kinds of projects, and the difficulties involved in implementing others due to the specific features of the agricultural sector.
I. T
HE AGRICULTURAL SECTOR:
A MITIGATION POTENTIAL THAT MATCHES ITS EMISSIONSA.
Classification of sources of emissions and mitigation
For the purpose of this report, the agricultural sector's sources of emissions and mitigation are taken in their broadest sense: all emissions that are directly affected by choices made by a farmer and any projects likely to generate carbon credits for a farmer are taken into account, to the extent that their impact on emissions is significant.
Therefore, in addition to the agricultural emissions defined by the IPCC (enteric fermentation, waste management, rice fields, cropland and pasture, and burning of savannahs and crop residues), other sub-sectors are taken into account. This includes farms’ energy consumption, which is usually classified under the energy sector. Some upstream emissions have also been included, like those from fertiliser production, which are generally included in the industrial sector, and the conversion of forests into agricultural land, which is usually found in the forestry sector. Likewise, where downstream emissions are concerned, we will also be looking at decisions to turn biomass into bio-energy.
Conversely, emissions linked to food-processing or transportation are not affected by changes in farming practices, and will therefore not be taken into account. Moreover, since emission reductions linked to greater efficiency in the fertiliser production process do not depend on farmers, they will not be included in this report either.
Finally, some minor sources of emissions, like the production of pesticides3 or the manufacture of agricultural machinery, will be left out.
Emissions sources and their mitigation potential are therefore classified under nine major sub-sectors themselves classified under three groups depending on whether the emission sources or their mitigation potential are upstream of the agricultural sector, from the farm or downstream of it. Each of these sub-sectors is described below using the same process: the first paragraph reminds the type of emissions involved and the second one developed some techniques that can be implemented to mitigate these emissions.
Upstream
Fertiliser production, which includes emissions from processing CO2 and N2O at the production
plant site.
In the context of this report, the mitigation potential linked to fertiliser production corresponds to a simple decrease in production due to the reduced consumption of fertilizers by farmers.
Land conversion, which includes CO2 emissions linked to converting forests and wetlands into
agricultural land.
Reducing these emissions may involve three kinds of measures: (i) avoiding converting forests and wetlands into agricultural land; (ii) reforesting degraded agricultural land that has become less productive; and (iii) setting up an agro-forestry system by planting widely spaced trees among crops, or by cultivating plots where the tree coverage has been thinned. Only agro-forestry projects have been included in this report, as the others are considered solely as forestry projects.
We also may mention other upstream emissions which are due to animal feed production. In the same way as for the production of fertilizers, the emissions reductions can be achieved by two distinct ways of which only the second is related to a change in agricultural practice: the first way is a technical improvement of production efficiency and the second corresponds to a production decrease resulting from a consumption reduction of concentrates. One of the levers for the second way is to favour polyculture-breaching.
At farm level
Cropland and pasture, which corresponds to the N2O emissions linked to the use of organic and
mineral nitrogen fertilisers, to the open-air waste emissions and to legumes. The mechanisms involved are detailed in Appendix 1.
One way of reducing nitrous oxide emissions is to limit the use of nitrogen fertilisers (sustainable use of fertilisers, planting legumes, avoiding leaving the soil bare, changing the kinds of nitrogen fertilisers used, etc.). Water management also has an impact on the denitrification process, which can be defined as an alternative breathing mechanism. For example, soil drainage enables improved aeration, and therefore a less intensive denitrification process. However, this effect is harder to understand, and therefore has not been taken into account in our calculations.
Livestock farming, which breaks down into two sources of emissions: enteric fermentation and waste management. Enteric fermentation emits methane (CH4), which is formed when cellulose is
digested by ruminants (cattle, sheep, goats and members of the camel family) through the microbial fermentation process. Animal waste emits CH4 when organic matter breaks down in an anaerobic
environment, as well as N2O, especially if the ventilation is poor.
Where waste management is concerned, the choice of its form, i.e. liquid waste (slurry), or solid waste (manure) has an impact on CH4 and N2O emissions. According to the Canadian Ministry for Agriculture
and Agri-Food, slurry emits between four and six times more gas than compost manure (which is raked to improve aeration), while a heap of manure emits 1.3 times more gas than compost. Another technique to
7 reduce emissions is to methanise livestock waste4. This reduces emissions by 80% at the storage stage, and enables heat and electricity to be generated, while preserving the waste’s fertilising properties. Where enteric fermentation is concerned, there are currently few measures to reduce emissions without decreasing production. The methods envisaged amount to changing the cattle feed (higher proportion of concentrates, feed with a high polyunsaturated fatty acid content, etc.), and to improving productivity in order to reduce herd numbers.
Rice-growing: the flooding of cultivated areas, and therefore the absence of oxygen, encourages the growth of anaerobic bacteria, and therefore the production of CH4 via fermentation. Emissions can be
reduced by drying out the soil between growing periods, although this may increase N2O emissions.
Burning organic matter for non-energy generation purposes, which mostly includes slash-and-burn farming and setting fire to sugar cane crops to make harvesting them easier. The gases in question are CH4 and to a lesser extent N2O; CO2 emissions are not generally included in inventories, as the gas
was captured at an earlier stage, while the plants were growing. New agricultural machinery enables sugar cane to be harvested without setting fire to the field beforehand, while the intensification of agricultural production is expected to reduce the use of slash-and-burn farming.
Energy consumption, which is mainly linked to heating greenhouses and livestock barns, preserving milk stocks, and even operating tractors. Better tuned machinery and less use of agricultural machinery as a result of simplifying the way the land is farmed enable CO2 emissions reduction.
Carbon flows between the soil and the atmosphere, which can result in a zero balance, either in terms of storing carbon in the soil or releasing it into the atmosphere, depending on changes to the soil’s carbon stores. This situation involves a specific mitigation mechanism, as the process may involve both reducing emissions and increasing carbon sequestration. The process poses two major challenges: - reversibility: any carbon stored in the ground may return to the atmosphere, if the practice is abandoned, or if the climate becomes unfavourable. Furthermore, the kinetics of retrieval is faster than the kinetics of storage, hence the importance of maintaining soil carbon stocks (Arrouays et al., and Stengel, 2002). - saturation: once the soil is saturated, usually after one hundred years or so, the level of carbon sequestered no longer rises, even if the practices (no-till, intermediate crops, etc.) continue.
The main techniques for increasing the quantity of carbon in the soil are simplifying farming methods (superficial cultivation, no-till, etc.), converting cropland to pasture, agro-forestry, increasing soil return of crop residues or dung and unharvested crops (green manure) ... These techniques can increase the provision of organic carbon and protect the soil against erosion and carbon mineralization leading to CO2
emissions.
Downstream
Bio-energies, which replace fossil fuels. At first sight, bio-energies seem like a real catalyst for reducing emissions; they do, however, have their limits. For instance, they pose a problem in terms of competing land use. In fact, dedicated energy crops may generate high CO2 emissions, if it is necessary
to clear a forest to plant them. They may also create tensions in agricultural prices when they replace food crops. This competition effect may be direct or indirect. The indirect effect appears, for instance, when agro-fuels are grown on land to the detriment of farming, which is then moved to another area, to the detriment of a tropical forest. The use of crop residues as bio-fuels – almost the only type of bio-fuel offset project allowed so far – enables the competition issue to be avoided, but may lead to a decrease in the soil’s fertility and carbon stores: returning crop residues to the soil enables it to be enriched, because they represent added organic matter.
Bio-products, by replacing energy-intensive raw materials, are also a way to mitigate greenhouse gas emissions.
4 Methanisation of liquid livestock waste corresponds to its anaerobic fermentation in a digester, which results in the formation
of biogases (50-75% of CH4 and 25-45% of CO2); these can be used as a source of heat, electricity or both (cogeneration). In
8
B.
Estimating emissions and mitigation potential by sub-sector at global level
It is important to determine what the main sources of emissions are, in order to introduce suitable techniques for reducing emissions. However, the areas with the highest mitigation potential are not always where emissions are the highest. This is for example the case of CO2 fluxes between soil and atmosphere
where the potential for carbon sequestration in soil is more than 100 times higher than current emissions. Emissions and mitigation potentials for the different sub-sectors defined above are summarized in Figure 2.
Figure 2 – Global emissions and mitigation potential
Note: mitigation potentials correspond here to the maximum technical potential per year by 2030 which reflect the expected increase in demand for food. Source: CDC Climat based on the US-EPA (2006) for the maximum emission estimates and on Smith et al. (2007) for the mitigation potential. Details of calculations and sources are provided in Appendices 2 and 3.
F e rti li s e r p ro d u c ti o n (C O2 , N2 O) 0 .5 3 B io -e n e rg ie s (C O2 ) E m is s io n s ( G tC O2 e/ year ) 5 .3 4 L a n d c o n v e rs io n (C O2 ) 5 .9 16 0 .1 0 6 2 .3 2 .3 C ro p la n d a n d p a s tu re (N 2 O) L iv e s to c k fa rm in g (C H4 , N 2 O) En e rg y c o n s u m p ti o n (C O2 ) C a rb o n fl o w s s o il /a tm o s p h e re (C O2 ) R ic e -g ro w in g (C H4 ) B u rn in g o rg a n ic m a tte r (C H4 , N 2 O) 0 .7 0 .5 6 0 .7 M it ig a ti o n p o te n ti a l (G tC O2 e/ year ) 0 .1 2 0 .2 7 0 .2 7 0 .0 2 2 0 .7 0 .0 4 3 .5
9
Several sources of emissions led by land conversion
Demographic growth and changes in emerging countries’ dietary habits (especially in China and India) are resulting in increased demand for foodstuffs at global level. In addition, competition from energy crops is growing. These two phenomena are leading to a rising trend in agricultural prices, which puts increasing pressure on land. The increase in agricultural land areas is therefore the main cause of deforestation. Deforestation accounts for 44% of agricultural emissions, i.e. 5.7 GtCO2e per year.
Cropland/pasture and livestock farming are the two largest sources of emissions after deforestation. They account for 18% of agricultural emissions each. Emissions linked to livestock farming break down into two sub-categories: enteric fermentation, which accounts for 83% of emissions from livestock farming, and waste management, which includes the remaining 17%.
The border between the cropland/pasture and livestock farming categories, as defined by our estimates, does not take into account the real importance of livestock farming in terms of emissions. In fact, emissions in the field that are linked to fodder production are recognised under the cropland and pasture sector, even though they are intended as animal feed. Under ―life-cycle analysis‖-type accounting, direct and indirect emissions, excluding the conversion of land for livestock farming, have been estimated at 85% of European emissions from the agricultural sector, as defined by the UNFCCC (Joint Research Centre 2010). This percentage has to be treated with caution, in that it does not compare like with like: emissions from livestock farming have been calculated using a life-cycle analysis that takes imports into account, while the European agricultural emissions were surveyed according to UNFCCC guidelines. Upstream of the agricultural sector, fertiliser production, which is dominated by nitrogen fertilisers, is also a significant source of emissions. It emits 0.53 GtCO2e per year, i.e. 4% of agricultural emissions.
Other emission sources appear at global level, like those linked to rice-growing or the burning of organic matter. They emit 0.7 GtCO2e, i.e. 5% of agricultural emissions, each. Rice-growing is the world’s second
largest source of methane emissions after enteric fermentation.
Lastly, changes in land use, agricultural practices and climate are also factors that affect agricultural land carbon stores. According to Smith et al. (2007), some regions of the world are net carbon sinks while others are net sources of carbon emissions. The net global amount of CO2 emissions from agricultural
soils is estimated to be 0.04 GtCO2 per year, on a highly uncertain basis.
Bio-energies are the main mitigation catalyst
Bio-energies seem to be the main means of reducing emissions at global level. The very broad range of the estimate (between 4 and 16 GtCO2e per year) is due to uncertainty regarding future yields and the
areas available for dedicated crops. The higher the yields, the higher crop residues will be, and the more land will be available for energy crops. 12 GtCO2e per year out of a mitigation potential of 16 GtCO2e per
year (which corresponds to a high estimate) could be mitigated through the use of dedicated crops (miscanthus and jatropha), while the remaining 4 GtCO2e per year could be mitigated by crop residues
like straw, bagasse (a sugar-cane by-product), or rice husks. However, these figures are highly contested, since they do not apprehend the problems of indirect effects mentioned above.
The second mitigation catalyst is carbon sequestration in the soil. P. Smith et al. (2007) estimate the mitigation potential of soil carbon storage to be 5.34 GtCO2e per year.
Limiting the conversion of forest land into agricultural land is another important mitigation catalyst, with the emissions reduction potential of 3.5 GtCO2e per year. The relative merits of the various means of doing so
– more intensive farming, protected areas, planning land use, etc. – are still being actively discussed at international level through the REDD+5 mechanism (Pfaff et al. 2010).
The mitigation potential for the two main sources of emissions on farms, i.e. cropland and pasture and livestock farming, seems very low, as it amounts to 0.12 and 0.27 GtCO2e per year respectively. Reducing
the use of nitrogen fertilisers is achievable up to a certain limit, beyond which yields might be affected. As
to livestock farming, the mitigation potential is higher, although it remains low compared with the level of emissions involved. The means to reduce emissions linked to enteric fermentation – which accounts for 83% of livestock farming emissions – are limited.
The mitigation potential of the rice-growing and organic matter combustion sectors is estimated to be 0.27 and 0.7 GtCO2e per year respectively. Since the maximum technical potential is concerned, the
assumption used for the combustion of organic matter corresponds to the complete stoppage of practices relating to this sub-sector.
Where the production of nitrogen fertilisers is concerned, the mitigation potential corresponds solely to the emissions reductions created by a fall in demand, not to any technical improvement in production, which would then fall under the industrial sector, as mentioned earlier. This sub-sector is therefore correlated with the cropland and pasture sub-sector. The mitigation potential is estimated to be 0.106 GtCO2e per
year, corresponding to a 20% decrease in fertiliser production (Appendix 3).
Uncertainty, technical potential and economic potential
Estimates of technical mitigation potential should be treated with caution. According to the IPCC report, the global mitigation potential (excluding upstream and/or downstream activities) is around 5.8 GtCO2e
per year, with a confidence interval of 95% within a range between 0.3 and 11.4 MtCO2e. There are two
main reasons for this uncertainty. Firstly, it is hard to estimate the mitigation factors linked to the implementation of a given practice or technology. Very often these factors depend on several parameters, such as climatic conditions, the nature of the soil, the type of crop, diet, age, the live weight of the animal, etc. The lack of data, particularly in developing countries, limits us to using factors that are inaccurate by default. Secondly, it is hard to estimate the future emissions for the agricultural sector that will determine the benchmark scenario. In fact, mitigation potential is calculated on a global scale6, based on a benchmark scenario forecast up until 20307, as summarised in Figure 3.
Figure 3 – Calculating mitigation potential
Source: CDC Climat Research
These uncertainties are compounded by the issue of incompatibility between various practices, which is not always taken into account. For example, the use of crop residues is included in both ―soil carbon sequestration‖ and ―bio-energies‖ sub-sectors, while one method of use excludes the second.
In addition, the technical potential does not take into account the economic limits: economic mitigation potentials are highly dependent on the carbon price for each sub-sectors (Figure 4).
6 The models used to draw up the benchmark scenario (including Image v. 2.2 for estimating future cropland and pasture
areas, and the IMPACT model for estimating dedicated rice-growing areas) primarily take increased food demand and improved yields into account.
7 The benchmark scenario corresponds to the IPCC B2 scenario.
2000 2015 2030 M tC O2 e/ ye a r Mitigation potential
11 Figure 4 – Comparison of the economic and technical mitigation potential levels for each
sub-sector (GtCO2e per year)
Source: CDC Climat based on data in Smith et al. (2007).
Economic viability of strategies that can be implemented to reduce GHG emissions depends on the price of carbon. When prices are low, the strategies that can be implemented are those where production is maintained and where there is just a change in practices (no-till, decrease in fertiliser use, change of feed, etc.). When prices are higher, strategies that involve an initial investment without any changes in production can be envisaged. This is the case, for instance, with water management for cultivated plots (irrigation and/or drainage), or even the installation of a methaniser. In the latter case, the gain achieved thanks to electricity generation (where it exists) may make installing such a facility easier. Finally, when the prices are even higher, mitigation strategies that involve decrease in production become economically viable.
If we do not take the agricultural sector’s upstream and downstream activities into consideration, the mitigation potential is estimated to be 1.5, 2.6 and 4.15 GtCO2e per year, at prices of €15 per tCO2e, €36
per tCO2e and €73 per tCO2e respectively 8
.
C.
Estimating regional emissions and mitigation potential
This section seeks to describe the geographical breakdown of emissions and mitigation potential. The geographical breakdown corresponds to the one used by the World Meteorological Organisation (WMO): Africa, Asia (including the Eastern part of Russia beyond the Ural Mountains, but not including either Indonesia or Malaysia), South America, North America, Central America and the Caribbean, the South-West Pacific (including Indonesia and Malaysia) and Europe (including the South-Western part of Russia and Turkey).
Asia: half of global emissions
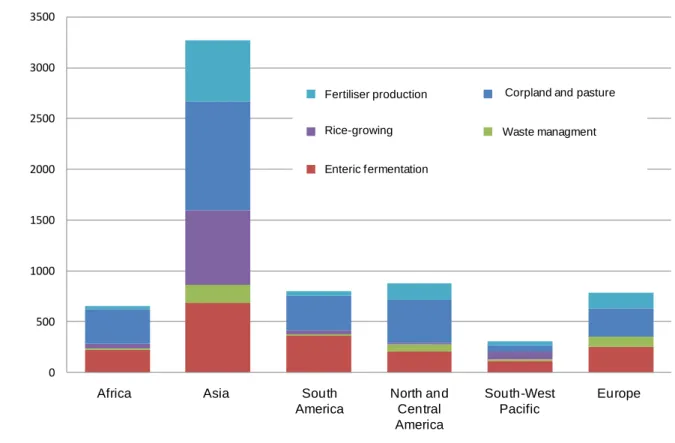
Asia, which accounts for 49% of global agricultural emissions, is the region with the highest emissions by far (Figure 5). This is not at all surprising, given that the region is the largest consumer of nitrogen
8 The carbon prices (US$20, US$50, and US$100) have been converted into euros using the average 2007 exchange rate.
0,00 0,05 0,10 0,15 0,20 0,25 0,30 Cropland and pasture Rice-growing Enteric f ermentation Waste managment M it ig a ti o n p o te n ti a l (G tC O 2 e ) 0 4 8 12 16 20 Carbon f lows soil/atmosphere Bio-energies 15 € 36 € 73 € Technical potential
fertilisers (60% of global consumption), owns 31% of the world’s cattle, 97% of buffaloes, and 42% of sheep (the species that emit the most methane), and is home to 82% of all areas where rice is harvested (FAOSTAT 2011).
In Africa and America, the proportion of emissions generated by waste management is relatively low compared with the proportion generated by enteric fermentation. This is probably due to the extensive (open-air) nature of livestock farming in these regions. Liquid agricultural waste only results in N2O and
CH4 emissions when livestock are kept in barns, or their waste is recovered and stored before being
spread over fields. Emissions caused by open-air animal waste are included in the ―cropland and pasture‖ sub-sector.
Emissions caused by deforestation are mainly found in two regions of the world: in the Amazon Basin, where the conversion of forest land into agricultural land is primarily related to livestock farming and the expansion of soy crops intended for animal feed; and in Indonesia, mainly due to the cultivation of oil palm (Bellassen, et al. 2008).
Figure 5 – Regional breakdown of emissions from the agricultural sector in 2000 (MtCO2e)
Note: The data for emissions caused by energy consumption and the combustion of organic matter are not sufficiently accurate to break them down for each of the six regions. 92% of emissions caused by the combustion of organic matter are generated in developing countries, mainly in Sub-Saharan Africa, America and the Caribbean, while energy consumption is higher in industrialised countries. Moreover, emissions relating to the conversion of forest land into agricultural land are mainly generated in South America and in the South-West Pacific (Indonesia).
Where fertiliser production is concerned, emissions correspond to the region’s consumption level, not to its production level. Source: Vergé, De Kimpe and Desjardins (2006).
The ranking of the continents changes radically when the carbon intensity of agricultural production in different regions is compared (Figure 6)9. Africa and South America are the two regions that generate the most emissions for each foodstuff produced. Although Asia has the highest emissions, it is relatively
9 Net agricultural production has been calculated as follows: the quantity of each foodstuff (corn, rice, milk, eggs, etc.)
produced for each region is weighted according to its benchmark price, which corresponds to the average price of that foodstuff in the period between 1999 and 2000. Therefore the price of the same foodstuff does not depend on the area where it was produced. Next, the various types of production for one year, weighted according to price, are added up to obtain the net agricultural production for a region. Produce intended for animal feed is not included.
0 500 1000 1500 2000 2500 3000 3500
Afrique Asie Amérique
du Sud Amérique Centrale et du Nord Sud-Ouest du Pacifique Europe fabrication d'engrais cultures et pâturages rizicultures gestion des déjections fermentation entérique
Waste managment
Enteric fermentation Rice-growing
Corpland and pasture Fertiliser production
Africa Asia South
America North and Central America South-West Pacific Europe
13 efficient. The two regions with the fewest emissions per quantity produced are Europe, at the top of the list, followed by Central and North America. The regions where yields are highest therefore have the lowest emissions on an equal output basis.
Efficiency in terms of emissions according to output improved between 1990 and 2000, falling from €41 per tCO2e to €34 per tCO2e. The main reason is probably improved productivity. Generally speaking,
high-intensity agriculture emits fewer emissions when emissions are measured against the quantities produced. For example, improving the yields for a given crop, which is linked to better fertilisation and to better water management, enables a reduction in emissions per quantity produced, and also enables soil carbon storage to be increased by increasing the crop residues that can be returned to the soil.
However, these numbers also need to be treated with caution, given that no distinction is made between the various kinds of production (cereals, meat, milk, etc.). In fact, some types of production cause more emissions than others. For example, this is the case with cattle farming when compared with poultry farming, or flooded rice cultivation when compared with wheat cultivation. It is therefore hard to compare regional emissions when they are reduced to net agricultural production, given that these regions do not have the same production profile.
Figure 6 – Regional emissions reduced to production levels (tCO2e per €)
Source: FAOSTAT (2011); Vergé, De Kimpe and Desjardins (2006).
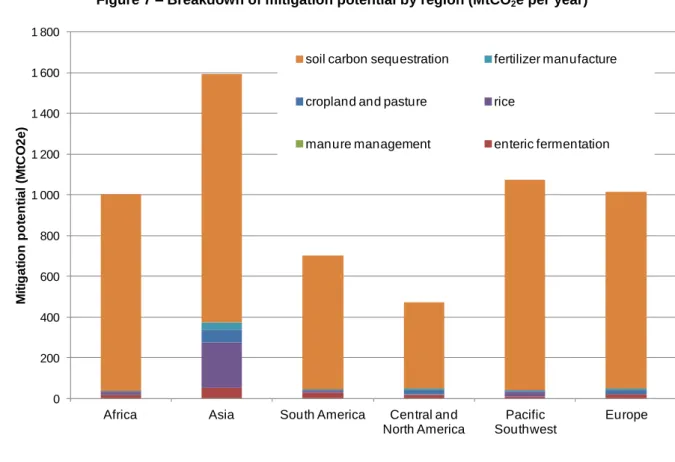
The greatest mitigation potential is thus... in Asia
Asia has the greatest mitigation potential (Figure 7). If we exclude soil carbon storage, its main mitigation catalyst is better management of its rice crop. Among other issues, this better management involves keeping the soil dry between two crops, better management of organic matter additions, which should preferably be made during drying-out periods, and the use of varieties that give out fewer emissions. Soil carbon storage capacity is unequally distributed throughout the world. Soil use, the nature of the soil and climate are the three main factors to take into account when determining carbon storage potential in soil. In the same way as a corn crop stores less carbon in the soil than a meadow, a vertisol (which is rich in clay) will have less storage capacity than a podzol (which is rich in organic matter, and is found mainly in Europe), while an area in a hot, dry climate will store less carbon than a cold, wet area. The soil use and agricultural practices implemented determine short-term variations in carbon levels, while the nature of the soil and the climate explain long-term storage capacity. We also need to take the actual state of the
0 5 10 15 20 25 30 35 40 45 1990 2000 Europe Sud-Ouest du Pacifique Amérique Centrale et du Nord Amérique du Sud Asie Afrique Europe Africa Asia South America North and Central America
soil into account. Africa and Asia are the two areas where soil degradation is highest, primarily due to erosion.
Where bio-energies are concerned, the IPCC report estimates that the most promising regions are Latin America, Sub-Saharan Africa and Eastern Europe, followed by Oceania and Northern and Eastern Asia in the longer term.
Figure 7 – Breakdown of mitigation potential by region (MtCO2e per year)
See Appendix 6 for details of the calculations.
Source: X.P.C. Vergé, C. De Kimpe, and R. L. Desjardins (2006); P. Smith et al. (2007)
D.
The French example
There are fewer sources of emissions in France than at global level. This is because the forestry sector is a net carbon sink at French level. In addition, since rice-growing is negligible, it has not been taken into account in this report; nor has the combustion of organic matter.
Mitigation potentials estimate for the various sub-sectors have not been calculated in the same way for French and global level. For the French example, the only mitigation potentials which have been considered result from changes in practices relatively easy to set up whereas, the global figures correspond to the maximum technical potential. Thus, the French mitigation potentials are underestimated compared to global figures. The other differences of calculation are highlighted in Appendix 7. Emissions and mitigation potentials are given by sub-sector in Figure 8.
0 200 400 600 800 1 000 1 200 1 400 1 600 1 800
Africa Asia South America Central and
North America Pacific Southwest Europe M it ig a ti o n p o te n ti a l (M tC O 2 e )
soil carbon sequestration fertilizer manufacture
cropland and pasture rice
15 Figure 8 – Emissions and technical mitigation potential in France
Note: The 13.4 MtCO2e emitted during the fertiliser production process were calculated in relation to the consumption of
fertilisers in France, not to their production. In fact, only 40% of the fertilisers consumed are produced in France. Source: CDC Climat, based on data from the UNFCCC emission survey, and on data in Leseur (2006) for the mitigation potential. For details of emission and mitigation potential calculations, see Appendix 4 and Appendix 5.
Sources of emissions that are less diversified than at global level
The cropland and pasture category single-handedly accounts for 39% of agricultural emissions (excluding upstream and/or downstream activities). The 50.1 MtCO2e per year shown in Figure 8 take into account
both direct and indirect N2O emissions caused by the use of nitrogen fertilisers. The sub-sector’s strong
contribution to GHG emissions is explained both by the substantial use of mineral nitrogen fertilisers (France is the largest consumer of nitrogen fertilisers in Europe10) and by a significant livestock farming industry, which involves the spreading of large quantities of animal waste.
Livestock farming is responsible for 37% of emissions (excluding upstream and/or downstream activities). Within this sub-sector, enteric fermentation accounts for 59% of the total, and waste management for 41%. The smaller gap than the one observed at global level is explained by the relative importance of enclosed breeding in France11.
Upstream of the agricultural sector, fertiliser production, which is dominated by nitrogen fertilisers, is also a significant source of emissions. Every metric ton of nitrogen spread in the form of fertiliser is responsible for 10.5 tCO2e of emissions in the field (67%) and 5.1 tCO2e during its production (33%).
Energy consumption on French farms emits 10 MtCO2e per year. This is a relatively high figure compared
with the global level, but is comparable to that of industrialised countries.
Lastly, IFEN (the French Environment Agency) estimates that the carbon stored in agricultural soils is declining by 6 MtC per year; in other words, French agricultural soils could be emitting 22 MtCO2e per
year. Proportionally, this figure is much higher than at global level (40 MtCO2 per year). This situation is
10 France accounts for 20% of European consumption (http://bitagro.imist.ma/spip.php?article112). 11 Waste emitted directly in the open air is only included in the ―cropland and pasture‖ sub-category.
Mitigation potential (MtCO2e/year)
Emissions (MtCO2e/year)
fertiliser production (CO2, N2O) 13,4 1,12 Bio-energies (CO2) 50,1 2,3 47,7 1,5 10 0,4 Cropland and pasture (N2O) Livestock farming (CH4, N2O) Energy consumption (CO2) Carbon flows soil/atmosphere (CO2) 3,8 14,6 22
primarily explained by the fact that some countries, like France, are sources of CO2, while others are
carbon sinks. Thus, the net global balance of CO2 emissions from agricultural soils is relatively low.
Bio-energies are the prime mitigation catalyst, both in France and the World
A major portion of the mitigation potential comes from energies, half of which is accounted for by bio-fuels. This estimate, which reflects the targets of the French Climate Plan adopted in 2004, probably underestimates the mitigation potential of bio-fuels. This is because Leseur (2006) takes into account the targets set by the 2003 European Directive, which aimed to include 5.75% of bio-fuels in the fuel mix by 2010. In fact, this target was broadly met, and the new target is to include 10% of bio-fuels between now and 2020. The other half of the mitigation potential corresponds to the use of crop residues, such as straw, and to growing dedicated crops like miscanthus, in order to produce heat or electricity.
Where soil carbon sequestration is concerned, the mitigation potential is proportionately much lower than at global scale. In fact, it amounts to 14.6 MtCO2e per year in France compared with 5,340 MtCO2eper
year at global level, which corresponds to 0.1 tCO2 per hectare 12
per year and 1.1 tCO2 per hectare 13
per year respectively. This situation can be explained in two ways. On the one hand, tropical regions have a very significant carbon sequestration potential because of their climate. On the other, the areas with the most degraded soil are in developing countries (Sub-Saharan Africa, Central and Southern Asia, the Caribbean, Central America and the Andes). The greater the degradation of the soil, the higher that soil’s capacity for capturing carbon will be.
II. C
ARBON OFFSET PROJECTS:
A MEANS OF MONETISING EMISSION REDUCTIONSA.
Compensation makes agriculture an integral part of carbon markets
Carbon markets are one of the three major economic tools that enable emissions to be reduced, the other two being regulation and taxation. They come in two forms: ―cap-and-trade‖ schemes and carbon offset mechanisms, which generate credits (Figure 9).
Figure 9 – Economic tools for reducing emissions
Source: CDC Climat Research.
Cap-and-trade schemes include whole sectors of the economy, where every installation must surrender the same amount of allowances as the amount of GHG it has emitted. To achieve that goal, installations that have excess allowances relative to their emissions can sell them to installations with an allowance
12 Total agricultural areas according to FAOSTAT (2011). 13 Idem.
Economic tools
Cap-and-trade
Carbon market
Tax
CAP
Regulation
Carbon
offsetting
Compliance
market
Voluntary
market
…
17 deficit. None of the current cap-and-trade schemes actually includes agriculture. Only the New Zealand scheme plans to include agriculture, starting in 2015 (Box 1).
Source: CDC Climat Research. For further details, see Climate Study No 26 – The inclusion of forestry and agricultural emissions in New Zealand’s new carbon market.
Offsetting is the second way of gaining a foothold in the carbon markets. The process consists of drawing up an appropriate emission reduction project perimeter. The emissions within the perimeter are compared with a benchmark scenario, and the difference can be monetised in the form of carbon credits. This process enables operators in a sector that is not included in cap-and-trade scheme to monetise their emission reductions if they wish to do so. Emission reductions in the agricultural sector are usually monetised in this way.
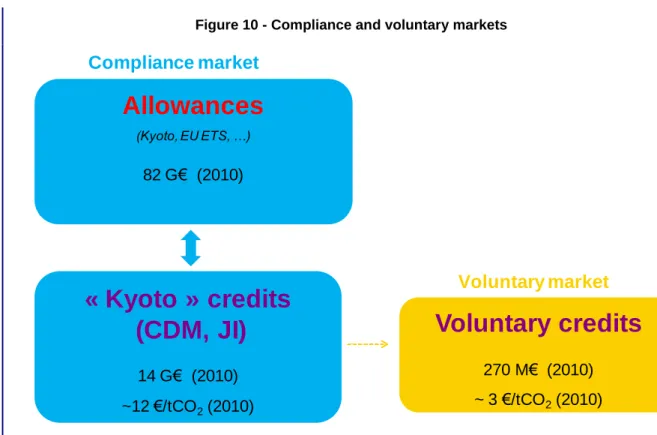
The standard used to certify emission reductions, and therefore carbon credits, determines the market in which these reductions are monetised. The Clean Development Mechanism (CDM) and Joint Implementation (JI) are the compliance market’s two traditional standards. The European Emission Trading Scheme (EU-ETS) is by far the largest compliance market. The Climate Action Reserve (CAR) was recognised in 2010 by the Californian authorities as an offset standard for California’s emission trading scheme, which should start up in 2013. Its status should therefore change from ―voluntary‖ to ―compliant‖ in the near future. The compliance markets are credit trading schemes where the regulator, which allocates credits to installations operating under constraints, authorises polluters to a certain degree to use carbon credits to ensure that they are compliant. These markets are larger and more liquid, and their prices are higher than those of the voluntary markets (Figure 10).
Box 1 – New Zealand’s Emission Trading Scheme – NZ ETS
The agricultural sector is expected to enter the NZ ETS in January 2015. New Zealand is planning to include the two following sub-sectors:
- livestock farming (including enteric fermentation and manure management);
- cropland and pasture (including direct and indirect N2O emissions resulting from the use
of nitrogen fertilisers).
The challenge resides in working out whether compliance obligations will be set at farm level, at industry level, upstream and downstream (food processors for the ―livestock farming‖ sub-sector, and nitrogen fertiliser manufacturers for the ―cropland and pasture‖ sub-sector), or whether to combine both levels.
Setting the obligations at the level of meat and dairy processors would require them to surrender allowances (NZUs) equivalent to the emissions generated by the products they process. Processors could then use the total amount of the emissions relating to the current NZU price to determine the price they offer the farmer. Where emissions relating to fertilisers are concerned, the manufacturer, the importer or the supplier would also face equivalent obligations.
The choice of setting obligations at processor level has the advantage of being simpler to implement and less expensive. Moreover, setting the obligations at farm level poses a major problem: herd owners and land owners are not always the same people. Who would be responsible in this case? However, an obligation set at farm level offers a wider range of emission reduction opportunities. This is because assessment is more accurate (use of factors specific to the farm, not factors common to all farms), and enables the factoring in of emission reductions linked to practices such as optimising the timing of fertiliser application or changing cattle feed.
Figure 10 - Compliance and voluntary markets
Source: CDC Climat Research, based on data from the World Bank (2011).
All other standards are only recognised by voluntary markets, where various entities – companies, public institutions, private individuals, etc. – purchase credits in order to meet a voluntary emissions reductions target. This variety of standards makes voluntary markets a framework that is more flexible, responsive and innovative than compliance markets.
B.
Carbon offset standards
All these standards are seeking to guarantee five quality criteria: (i) additionality, which corresponds to the fact that the emission reductions could not have occurred without being monetised on the carbon market; (ii) verification of the emissions reductions according to specifications drawn up beforehand; (iii) the permanence of the emission reductions; (iv) the offset timetable, i.e. ensuring that the credits can only be issued once the emissions have actually been reduced; (v) transparency, which makes it possible to guarantee that the same ton of CO2 cannot be resold several times.
Eight offset standards are considered in this section: the Clean Development Mechanism (CDM), Joint Implementation (JI), the Verified Carbon Standard (VCS), the Climate Action Reserve (CAR), the Gold Standard (GS), the Chicago Climate Exchange (CCX), and the American Carbon Registry (ACR). The CDM and JI standards cover 100% of the credits traded on the compliance markets, and all these standards cover 78% of those traded on the voluntary markets14.
CDM and JI for compliance markets
Clean Development Mechanism (CDM)
CDM projects are approved by the United Nations, and implemented in developing countries that have no emission reduction targets under the Kyoto Protocol. No type of agricultural project is excluded per se, except projacts for the sequestration of carbon in agricultural soils.
Joint Implementation (JI)
JI projects are those that have been implemented in industrialised countries that have quantified emissions reductions targets under the Kyoto Protocol (Annex B countries). These countries are required
14 According to the data in Peters-Stanley et al. (2011), excluding the CCB, which is most often added to another standard.
Allowances
(Kyoto, EU ETS, …)82 G€ (2010)
« Kyoto » credits
(CDM, JI)
14 G€ (2010)
~12 €/tCO
2(2010)
Voluntary credits
270 M€ (2010)
~ 3 €/tCO
2(2010)
Compliance market
Voluntary market
19 to provide national inventories of their emissions. Agricultural emissions are included in those inventories on the same basis as those of other sectors (energy, industry, transportation, etc.).
Under JI, types of agricultural projects are only authorised if the emissions they reduce are accounted for in the national inventory. This process de facto excludes carbon sequestration in agricultural soils for country such as France, as the emissions resulting from changes in soil carbon storage are not included. In addition, the emission factors used in the inventories are not always sufficiently accurate to account for emission reductions due to a change in practice. For example, a change of feed at a cattle farm, designed to reduce methane emissions from enteric fermentation, will have no impact on the inventory if the emission factor used does not take this change of feed into account15. The IPCC guidelines on emission inventories give countries some latitude in the choice of methods and emission factors. The types of possible JI projects may therefore vary slightly from one country to another, depending on the national inventory’s level of accuracy.
Voluntary markets: VCS, CAR, GS, CCX, and ACR
Historically, voluntary standards have based their procedures on the CDM, while gradually introducing innovations to (i) reduce the costs and delays associated with certification, and (ii) broaden the range of projects authorised. Then, they are less restrictive than the Kyoto standards leading to a lower carbon price.
Verified Carbon Standard (VCS)
The Climate Group, the International Emissions Trading Association and the World Economic Forum Global Greenhouse Register have been developing the VCS since March 2006. The standard has created a carbon credit unit: the Verified Carbon Unit (VCU). 42%16 of the voluntary credits traded in 2010 were VCUs. All types of agricultural projects are in principle authorised by the VCS.
Climate Action Reserve (CAR)
The CAR succeeded the California Climate Action Registry (CCAR), which was created by the State of California in 2001. The CAR certifies projects implemented in North America, and has also created its own carbon credit unit: Climate Reserve Tonnes (CRTs). 16% of the voluntary credits traded in 2010 were CRTs. The only methodologies available for the agricultural sector are for the methanisation of liquid agricultural waste.
Gold Standard (GS)
The Gold Standard was set up in 2003 by the WWF and several other non-governmental organisations, and has now been approved by 70 NGOs world-wide. This standard accounted for 10% of the voluntary credits traded in 2010. The projects certified by this standard are renewable energy and energy-efficiency projects.
Chicago Climate Exchange (CCX)
The Chicago Climate Exchange, which was founded in 2003, was first and foremost an innovative voluntary cap-and-trade scheme up until 2010. The scheme shut down in 2010, but its ―offset‖ compartment continues in the form of the Chicago Climate Exchange Offset Registry Program. In this case, the carbon credit used is the Carbon Financial Instrument (CFI), which is the equivalent of 100 tCO2e. CFI offset credits accounted for 4% of the voluntary credits traded in 2010. Compared to all the
other standards, the CCX protocols are original in that they granted credits on the basis of a certified practice – which was allocated a certain amount of emissions reductions by default –, and not on the basis of an assessment specific to each project. The CCX allows two types of agricultural projects: livestock liquid waste methanisation projects and soil carbon sequestration projects, which primarily involve stopping tillage and converting cropland into meadows.
15 To achieve this, the accuracy of the inventory must extend to the representative nature of the systems and their
development (feeding and waste management systems, and status of emission reduction practices).
16
According to the data in Peters-Stanley et al. (2011), excluding the CCB, which is most often added to another standard. The same source is used for the other standards.
American Carbon Registry (ACR)
The ACR was founded in 1997 by two environmental organisations: the Environmental Resource Trust and the Environmental Defense Fund. The carbon credit unit created by this standard is the Emission Reduction Ton (ERT). Not many agricultural projects are currently registered under this standard; however, several innovative methodologies for the agricultural sector were approved in 2010, including better management of the fertilisation process and improved rice-growing systems. 2% of the voluntary credits traded in 2010 were ERTs.
We can also note that a new standard exists in Australia, certifying agricultural and forestry projects: the Carbon Farming Initiative (CFI).
C.
Three examples of agricultural projects
Project involving the replacement of fossil fuel with bagasse in India17
In 2005, the ―Rajshree Sugar and Chemicals‖ sugar production plant launched a cogeneration project based on burning bagasse. The project was registered under the CDM standard on January 15th 2006. The installation of a high-pressure steam turbine, which is powered by burning bagasse, enables the plant to export carbon-neutral electricity within its local area, in addition to the electricity generated for its own use. The bagasse used is a sugar cane by-product, which is supplied by 20,000 local farmers, and involves an area covering 10,000 hectares and 655 villages. One of the aims of the cogeneration project is to ensure a reliable electricity supply for villages in the area. The project expects to reduce emissions by 80 ktCO2 per year. During the first accounting period, which ran from February 20
th
2007 to October 27th 2010, 408 ktCO2e were avoided, i.e. more than 100% of the planned amount.
Methanisation projects developed by AgCert in Mexico18
AgCert19, the project development organisation, has implemented 88 projects to methanise liquid waste from livestock (pigs and/or cattle) in several Mexican regions, under the CDM standard. Digesters were installed to increase anaerobic fermentation. The methane generated in this way is then captured and burned in order to generate electricity. These projects have been implemented in an environment where emissions from animal waste are increasing sharply, as Mexico’s pork production has risen by 28% over the past 10 years. Moreover, the projects are in line with the agricultural targets set by the Mexican Government as part of the 2001-2006 National Development Plan.
27 out of the 88 projects registered have begun to issue credits. The first project was registered on December 5th 2005, and single-handedly covers five locations. The SDP expects to reduce emissions by 122 ktCO2e per year. In its first accounting period, which ran from March 31
st
2006 to October 31st 2009, it issued 172,000 CERs, i.e. 32% of the amount expected.
17 Title: RSCL cogeneration expansion project.
18 Title: AWMS GHG Mitigation Project, MX05-B-02,Sonora, Mexico. 19 AgCert is now a subsidiary of the power firm AES
21
No-till farming projects
In the United States and Canada, aggregators, specialist companies, ―Farm Bureaus‖, and other organisations are bringing several farmers together to set up soil carbon sequestration projects, under the CCX standard. Any area under contract, where undertakings to stop or reduce tilling are complied with, enables a predefined amount of CFIs to be generated. In Canada, the first aggregator was C-Green Carbon Management Solutions Inc., which began operating in 2006, and now involves 2.2 million hectares of cultivated land where minimum tillage is used, grouped under three projects. The accounting process for emission reductions is retroactive; therefore, even though the projects were registered in October 2006, January 2007 and May 2008, the accounting period began in 2003. The three projects have enabled reductions of 7 700 ktCO2. There are 13 aggregators of this kind in the United States.
III. L
ESSONS DRAWN FROM THE733
AGRICULTURAL PROJECTSA.
The importance of accurate measurements when implementing agricultural projects
A small reduction in agricultural emissions; only three sub-sectors involved
733 projects affecting the agricultural sector had been registered under a carbon offset standard as of July 1st 2011, i.e. 14% of the projects across all sectors. However, their share of the credits issued every year20 is lower: 14 MtCO2e, i.e. 7% of the total.
Of greater concern is the fact that a factor of 1,000 separates the emissions and the mitigation potential of the emissions reductions generated by offset projects. Only three sub-sectors are involved: soil carbon sequestration, bio-energies, and livestock farming through the methanisation of liquid waste (Figure 11). Moreover, the implementation of carbon projects in a sub-sector does not appear to be related either to the volume of emissions in the sub-sector or to the size of its reduction ―reserves‖, i.e. the mitigation potential.
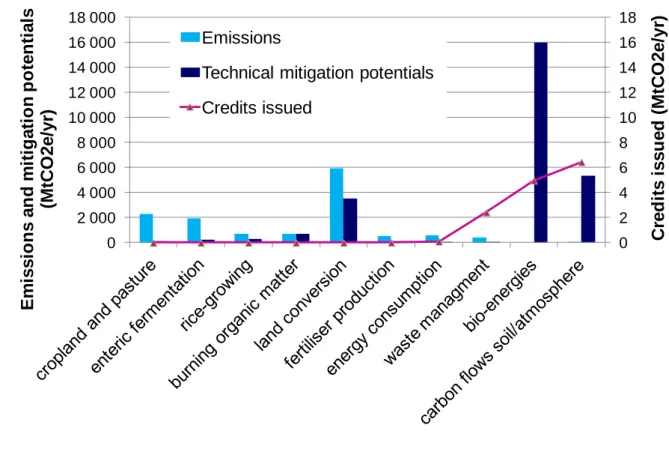
Figure 11 – Breakdown of emissions, mitigation potential and credits issued per sub-sector (MtCO2e per year)
Notes: The emission and mitigation potential values are shown on the left axis and the values for the credits issued on the right axis.
Source: CDC Climat Research based on P. Smith et al. (2007); FAOSTAT; and UNEP RISOE (2011).
The most frequent type of emissions reductions projects involves soil carbon sequestration, solely under the CCX standard. These are no-till projects and those for converting cropland into meadows, which represent the agricultural sector’s second largest mitigation potential. The number of credits awarded for each certified hectare varies according to the region where the project is located, with no measurement of carbon stocks before and after the project is implemented. For no-till projects, the amount of credits issued ranges between 0.5 and 1.5 tCO2e per hectare per year. For projects aimed at converting land into
meadows, it ranges between 1 to 2.5 tCO2e per hectare per year. A soil carbon sequestration project is
currently being approved by the VCS: this time, the methodology requires the measurement of carbon stock in the soil on a case-by-case basis for each project. The practice under consideration here is the management of meadows, and includes the limitation of over-grazing.
The bio-energies sub-sector comes a close second, with an average of 5 MtCO2e emission reductions
generated every year21, mainly by CDM projects (4.1 MtCO2e per year). This sub-sector primarily includes
the use of crop residues like bagasse (a sugar cane by-product), rice husks, and mustard-seed crop residues, as well as palm oil by-products. There is also a CDM project involving dedicated bio-fuel crops in Paraguay, but it is still marginal. This type of project involves a risk of carbon leakage, inasmuch as the crops planted – sunflowers, jatropha, etc. – to produce the bio-fuels may compete with food crops, and result in the displacement of pre-existing crops. In the worst case, the displacement of crops may lead to the deforestation of other land, and therefore generate a substantial amount of GHG. These leaks must be taken into account when calculating the project’s emissions22
.
21
The credits issued for each project have been reduced to a period of one year, and then added up.
22
According to the General Guidance on Leakage in Biomass Project Activities (Version 3), if there is any displacement of activities that existed before the initiative, the initiative backer must supply the following two indicators:
- the percentage of people involved by the displacement of the pre-existing activity caused by the initiative; - the percentage of pre-existing production (e.g. meat, corn, etc.) displaced because of the initiative.
0 2 4 6 8 10 12 14 16 18 0 2 000 4 000 6 000 8 000 10 000 12 000 14 000 16 000 18 000