HAL Id: hal-00679217
https://hal.archives-ouvertes.fr/hal-00679217
Submitted on 20 Mar 2012HAL is a multi-disciplinary open access archive for the deposit and dissemination of sci-entific research documents, whether they are pub-lished or not. The documents may come from teaching and research institutions in France or abroad, or from public or private research centers.
L’archive ouverte pluridisciplinaire HAL, est destinée au dépôt et à la diffusion de documents scientifiques de niveau recherche, publiés ou non, émanant des établissements d’enseignement et de recherche français ou étrangers, des laboratoires publics ou privés.
Chord length distributions interpretation using a
polydispersed population: Modeling and experiments
Ana Cameirão, Hung Le Ba, Myriam Darbouret, Jean-Michel Herri,
Jean-Louis Peytavy, Philippe Glénat
To cite this version:
Ana Cameirão, Hung Le Ba, Myriam Darbouret, Jean-Michel Herri, Jean-Louis Peytavy, et al.. Chord length distributions interpretation using a polydispersed population: Modeling and experi-ments. Journal of Crystal Growth, Elsevier, 2012, 342 (1), pp.65-71. �10.1016/j.jcrysgro.2011.05.028�. �hal-00679217�
C
C
C
h
h
h
o
o
o
r
r
r
d
d
d
l
l
l
e
e
e
n
n
n
g
g
g
t
t
t
h
h
h
d
d
d
i
i
i
s
s
s
t
t
t
r
r
r
i
i
i
b
b
b
u
u
u
t
t
t
i
i
i
o
o
o
n
n
n
s
s
s
i
i
i
n
n
n
t
t
t
e
e
e
r
r
r
p
p
p
r
r
r
e
e
e
t
t
t
a
a
a
t
t
t
i
i
i
o
o
o
n
n
n
u
u
u
s
s
s
i
i
i
n
n
n
g
g
g
a
a
a
p
p
p
o
o
o
l
l
l
y
y
y
d
d
d
i
i
i
s
s
s
p
p
p
e
e
e
r
r
r
s
s
s
e
e
e
d
d
d
p
p
p
o
o
o
p
p
p
u
u
u
l
l
l
a
a
a
t
t
t
i
i
i
o
o
o
n
n
n
:
:
:
M
M
M
o
o
o
d
d
d
e
e
e
l
l
l
i
i
i
n
n
n
g
g
g
a
a
a
n
n
n
d
d
d
e
e
e
x
x
x
p
p
p
e
e
e
r
r
r
i
i
i
m
m
m
e
e
e
n
n
n
t
t
t
s
s
s
A. Cameiraoa, , H. Le Baa, M. Darbouretb, J.-M. Herria, J.-L. Peytavyc, P. Glénatc
a Ecole Nationale Supérieure des Mines de Saint-Etienne, 158 cours Fauriel, F-42023 St-Etienne Cedex 2, France
b Fluid Mechanics Department, IFPEN—Lyon, Rond-Point de l'Echangeur de Solaize, BP3, 69 360 Solaize, France
c TOTAL, CSTJF, Avenue Larribau, 64018 PAU Cedex, France
A
A
A
b
b
b
s
s
s
t
t
t
r
r
r
a
a
a
c
c
c
t
t
t
Chord length distributions were measured during the crystallization of gas hydrates in a flow loop. The conditions on the flow loop were similar with the conditions in the marine pipelines. The flow loop was filled with water in oil emulsion and pressurized with methane (7 MPa) at low temperature (277 K). During crystallization water droplets crystallize and agglomerate. The CLD measures were interpreted in a preceding work [Le Ba et al., 2010] [1]
by constructing random aggregates with known geometrical proprieties from a monodispersed population of droplets and calculating their CLD. Comparing calculated CLD with CLD from the experiment, the geometrical parameters: number of primary particles and fractal dimension of experimental aggregates are identified. However some differences remained between the experiment and the calculated CLD. In the present work the droplets population was considered polydispersed improving the comparison between the model and the experiment.
Keywords
Crystallization; Agglomeration; Chord length distribution; Crystallization from a Water in oil emulsion; Modeling
I
I
I
.
.
.
I
I
I
n
n
n
t
t
t
r
r
r
o
o
o
d
d
d
u
u
u
c
c
c
t
t
t
i
i
i
o
o
o
n
n
n
Gas hydrates are solid crystals composed by water molecules enclosing a gas molecule. They form at conditions of high pressure and low temperature [2] and can be found in the nature [3] as sedimentary methane hydrates. It also can be found in the offshore oil production lines where formation of gas hydrates can cause large production losses [4] because individual particles agglomerate together and form a plug in the pipeline [5]. This phenomenon is the outcome of the increase in viscosity of the emulsion.
The agglomerates of methane hydrates can be described as fractal objects with three main characteristics: a fractal dimension Df, which characterizes the compactness of the object, the
number of primary particles Np agglomerated, the diameter of its constitutive particles Dp
and the apparent diameter DA of the aggregate as [6]
Df A P
D
N
D
(1)The apparent diameter of the aggregate is the average of the differences between the mass center of the aggregate and the center of each particle composing the aggregate with exponent two. Some studies have concluded that fractal aggregates could explain the increase of viscosity of hydrate suspensions observed comparing with viscosity calculated from the solid content directly equal to the initial water volume [7]. Camargo and Palermo [8] have held this assumption to model consequences on viscosity of hydrate crystallization in an emulsion of water in oil with natural anti-agglomeration properties.
Fidel-Dufour et al. [9] have developed a kinetic model of hydrate crystallization from the Camargo and Palermo model. The crystallization process was supposed to be limited by gas transfer in the oil phase. Agglomeration was the result of collisions of a water droplet and two primary particles or agglomerates where crystallization of the water droplet bonded the two objects. The outcomes of this process are fractal aggregates formed by spherical particles whose sizes are the sizes of the initial emulsion.
A recent work of Colombel et al. [10] completed the work of Fidel-Dufour et al. [9] adding to the population balance a term of breakage.
Modeling the hydrates formation in a pipe includes phenomenon of nucleation, growth and agglomeration. The previous models were based on the population balances. In order to validate these models the gas consumption was used but some problems were found to validate the size and shape of the agglomerates.
Recently a new granulometric technique has started to be used, allowing the on line measure of the chord length distributions of hydrates in opaque and dark mediums in high concentration suspension. The probe used to measure the CLD is called Focused beam
reflectance measurement (FBRM) and was used in different experimental studies in order to
follow nucleation, growth and/or agglomeration [11] under pressure. A chord length is a straight line between any two points on the edge of a particle or particle structure (agglomerate).
The FBRM technique measures an apparent chord length distribution (CLD) instead of a particle size distribution (PSD) and raised the problem on how one can be translated into the other. Some works were made as Li and Wilkinson [12] proposed a general model to translate a PSD into its corresponding CLD for different shapes including spherical, ellipsoidal and general non-spherical but regular particles and also from CLD into PSD but not for general non-spherical particles. Also Worlitschek et al. [11] proposed interpretation of the CLD into PSD for crystals of known shape. However the case of general non-spherical particles as far as we know was not discussed in the literature.
In this paper experimental results are discussed assuming that the apparent CLD is closed to the true one. It must be noted that Boxall et al. [14] showed that FBRM could undersize the size of droplets in a water emulsion for FBRM sizes between 5 and 30 μm.
However, in none of these studies the case of aggregates was studied. Therefore, in this paper, a new algorithm is proposed to build a random aggregate and to calculate its CLD.
I
I
I
I
I
I
.
.
.
E
E
E
x
x
x
p
p
p
e
e
e
r
r
r
i
i
i
m
m
m
e
e
e
n
n
n
t
t
t
a
a
a
l
l
l
The experimental study was made in the Archimede Flow loop located at Saint-Etienne School of Mines. This device reproduces the thermodynamic conditions of the deep-sea pipelines with working pressures from 1 to 10 MPa, and temperature controlled within the range of 273–283 K. The flow loop is equipped with a FBRM probe, several temperature probes, differential pressure probes and a Coriolis flow-meter. The flow in the loop is motioned throw a gas-lift system. This system works in laminar regime because its maximum flow rate is 150 l h−1. More details on this equipment can be found in Fidel-Dufour et al. [9]. The emulsions were made by adding ultra pure water (Type 1) into the oil (Kerdane). Because the oil does not have any natural emulsifying properties an emulsifying additive (IPE202, patented by IFP) was added, this additive also has some anti-agglomerant properties. The organic liquid phase is a C10-C13 cut, which is delivered by TOTAL-Solvents. The methane is pure (99.99%) and delivered from AIR LIQUIDE.
The emulsions are made in a reactor with an Ultra-Turrax impeller in 3 min at 8000 rpm. Experimental evidences [1] proved the stability of the emulsions. Then the emulsion is loaded into the loop and cooled until 277 K where the methane is then injected until 8 MPa. First the gas passes into the oil phase, which induces a pressure loss that is then compensated with a second gas injection until the same pressure. The pressure decreases again until a constant value where the hydrate crystallization begins.
During crystallization the kinetics of nucleation, growth and agglomeration are followed through the pressure drop and the temperature and also through the signal provided by the FBRM probe. Both growth and agglomeration are concomitant. The droplets crystallize on
methane hydrates through a shrinking core process [9]. The initial droplets transform into spherical hydrates particles that will agglomerate through different possible process [9] and [10].
An experimental study was made by varying the volume percentages of water in oil from 10% to 30% and the mass percentage of the additive in the water from 0.5% to 2%.
The FBRM probe is an in situ particle size analyzer from LASENTEC. It consists of an infrared LASER, with a wavelength of 785 nm and a scan speed equal to 2 m s−1. The laser emitted from the probe into the suspension is reflected as it encounters a particle and scans across it, the chord length is deduced from the reflection time multiplied by the laser scan speed [1]. The FBRM measures chord lengths between 0.5 and 1 000 μm in concentrated slurries. After each 20 s the probe provides an average chord length distribution (CLD), giving the number of chord lengths counted for each size range. For more information see the FBRM User's Manual [15].
Figure 1 provides examples of chord length that could be measured during crystallization. An important remark is that for a given object, chord lengths can be measured in the range between 0 and Dmax, where Dmax is the maximal size of this object. FBRM can also see D greater than Dmax because it cannot distinguish between two particles side-by-side [13].
0 1 2 3 4 5 6 1 10 100 C L D ( % p r o b ab ilit y ) chord lenght (µm) t=0 min t=90 min t=105 min t=115 min F Fiigguurree11––MMeeaassuurreeddCCLLDDaattddiiffffeerreennttttiimmeessdduurriinnggccrryyssttaalllliizzaattiioonnffrroommaanneemmuullssiioonnwwiitthh 2 200%%ooffwwaatteerraanndd22%%ooffaaddddiittiivvee..
Figure 1 shows the CLD of the initial emulsion at t=0 min characterized by a single peak corresponding to the droplets. During crystallization due to agglomeration secondary peaks appear in the CLD. The primary peak corresponding now to the primary hydrate particles decreases and the secondary peaks increase.
I
I
I
I
I
I
I
I
I
.
.
.
M
M
M
o
o
o
d
d
d
e
e
e
l
l
l
Le Ba et al. [1] has developed a model in a way to interpret the CLD measurements made by the FBRM probe during the crystallization of the methane hydrates in water in oil emulsion during the flow in a flow loop. In this work it is supposed that the droplets are spherical and that they maintain their shape when crystallized and after when they agglomerate, this supposition is supported by our observations and the work of Boxall et al. [13] and [14]. The model developed by Le Ba et al. [1] constructs agglomerates from a population of spheres with a known number of primary particles and fractal dimension, by adding sphere to sphere. The addition of each sphere is followed by the verification that spheres are not superposed. At the end an agglomerate with known Df and Np is formed. This agglomerate is then
projected in a 2D plan and the projection is scanned and the CLD is calculated as the FBRM does in reality to agglomerates in suspension. In a way to have a representative CLD of the
agglomerate the same agglomerate is turned and projected and another CLD is calculated, this procedure continues and at the end an average CLD is calculated. From a parametric study it was concluded that to more than 200 projections the average CLD distributions are superposed.
The FBRM can measure the size of the droplets in the emulsion, the size of primary particles of methane hydrates and the size of agglomerates. The signal of the FBRM is a chord length distribution. The chord length distribution of the emulsion shows a single peak around 5– 8 μm. During crystallization the intensity of the single peak of the emulsion decreases because water droplets convert into hydrate and agglomerate preserving their spherical form. Secondary peaks appear due to the agglomeration.
Le Ba et al. [1] proposed a model that constructs random aggregates from a monodispersed suspension with known fractal dimension, primary particle diameter and number of primary particles (geometrical parameters) and calculates their CLD. By comparison between the calculated CLD and CLD from the experiment, the geometrical parameters of aggregates can be deduced. The main results from this study show that both CLD differ in the size of the primary particles peak. In this work, it is showed that this difference can be annealed if the initial emulsion is considered as polydispersed.
The initial emulsion is composed by polydispersed spherical droplets as it can be proved by the chord length distributions measured by the FBRM (see Figures 2 and 3).
0 0.5 1 1.5 2 2.5 3 3.5 4 4.5 5 5.5 1 10 100 CLD ( % p ro b ab il ity ) chord lenght (m) 10%water 0.5%additive 20%water 0.5%additive 30%water 0.5%additive F Fiigguurree22––MMeeaassuurreeddCCLLDDooffeemmuullssiioonnsswwiitthh00..55%%ooffaaddddiittiivveeaanndd1100%%,,2200%%aanndd3300%%ooff w waatteerr..
0 0.5 1 1.5 2 2.5 3 3.5 4 4.5 5 1 10 100 1000 CL D (% pr ob ab ility ) chord lenght (m) 20%water 0.5%additive 20%water 1%additive 20%water 2%additive F Fiigguurree33––MMeeaassuurreeddCCLLDDooffeemmuullssiioonnsswwiitthh2200%%ooffwwaatteerraanndd00..55%%,,11%%aanndd22%%ooffaaddddiittiivvee..
So in this work a new model is proposed using aggregates constructed from a polydispersed population.
The initial polydispersed population is assumed to be a log-normal distribution whose parameters are the average primary particles size
D p
and standard deviation δ(Equation 2). The constructed PSD is then transformed into CLD through the model of Li and Wilkinson [12] and compared with the emulsion CLD from the experiment. By comparison the experimental initial parameters (Dp
,δ) are determined (Figure 4).2
1
1 log(
) - log(
)
(
)
exp(- (
) )
2
2
Dp
D p
f Dp
Dp
(2)F
Fiigguurree44::MMooddeellmmeetthhooddoollooggyy..
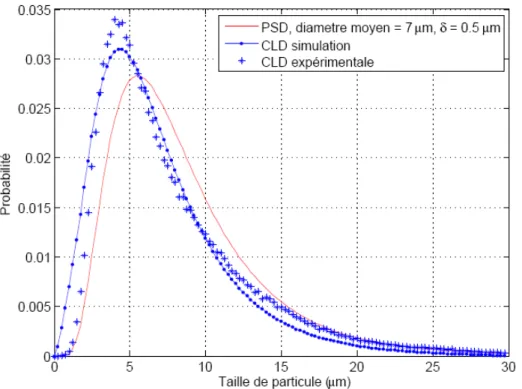
An example of the results obtained from this methodology is in Figure 5. The CLD from the experiment is compared with the CLD from the log-normal PSD after parameters adjusted equals to
D p
=7 μm and δ=0.5. Dp and CLD model # CLD experiment Input Yes No Output distribution log-normal PSD CLD Dp and F
Fiigguurree55::CCoommppaarriissoonnbbeettwweeeennCCLLDDffrroommmmooddeellaannddCCLLDDffrroommeexxppeerriimmeenntt..
The CLD obtained from the model is superposed to the experimental CLD, validating the methodology exposed in Figure 4.
Once the experimental PSD is known, every particle is supposed to have the same probability to participate to the agglomeration. Agglomerates were constructed by attributing random number of particles to each class. The agglomerates were constructed following two methods called particle–cluster agglomeration (PCA) and cluster–cluster agglomeration (CCA) mechanisms. Both mechanisms are explained in detail in Le Ba et al. [1]. Generally each particle or cluster is added randomly to other particles or clusters until the desired geometrical parameters Np and Df are reached. After that several projections of the final
random agglomerate are made in a plan. Before each projection the agglomerate is randomly turned. The chord length distribution for each projection is calculated by scanning the projected agglomerate, at the end the final CLD of the aggregate is the average of each CLD. In [1] the simulated CLD profile becomes stabilized after 50–200 random rotations and projections so the number of projections is therefore set to 200.
Figure 6 shows two random aggregates, constructed following the method described above, composed by 100 particles and Df=2.0 assembled through PCA (a) and CCA (b) mechanisms,
(a) (b)
F
Fiigguurree66::RRaannddoommaagggglloommeerraatteesswwiitthh110000ppaarrttiicclleessccoonnssttrruucctteeddffrroommaappoollyyddiissppeerrsseedd p
pooppuullaattiioonnwwiitthh
Dp
==77µµmmaanndd
==00..55aannddDDff==22..00((aa))PPCCAA,,((bb))CCCCAA..In Figure 6 the polydipersity of the initial population in the spheres composing the aggregates is visible. It is noticeable even when the same Df agglomerates can be different.
III.1. Comparison between experimental CLD and calculated CLD from a polydispersed population
The calculated CLD was compared with the experimental CLD in a way to find the geometrical parameters of the crystallized aggregates: number of primary particles in the aggregate and fractal dimension. The superposition between both distributions is set up when
the size of the primary peak (or primary particles peak) and the position of the peak are the same;
the maximum chord length is the same;
the positions of the secondary peaks are the same and
the size of the secondary peaks are equal or lower in the calculated CLD compared with the CLD from experiments.
The calculated CLD was compared with the CLD during crystallization with three different fractions of water in the emulsion. The PSD of the emulsion was adjusted from the experimental CLD of the emulsion. The calculated PSD was determined as described (Figure 2) and the average particle diameters and standard deviation for each emulsion are presented in Table 1. T Taabbllee11::DDeetteerrmmiinneeddaavveerraaggeeppaarrttiicclleessddiiaammeetteerrssaannddssttaannddaarrddddeevviiaattiioonnssffoorreeaacchh e emmuullssiioonn.. 2% additive
D p
(µm)
(µm) 10% water 7.5 1.75 20% water 7.5 0.5 30% water 5 1.5Figures 7 to 15 show CLD from experiments compared with calculated CLD from adjusted geometrical parameters for emulsions with 10%, 20% and 30% of water and 2% of additive at different times of the crystallization and agglomeration.
0 1 2 3 4 5 6 7 8 1 10 100 C L D (% p ro ba bil it y) chord lenght (μm) model Np=133, Df=1.89 experiment, t=100 min F Fiigguurree77::CCoommppaarriissoonnbbeettwweeeenneexxppeerriimmeennttCCLLDD((tt==110000mmiinn,,1100%%wwaatteerr,,22%%aaddddiittiivvee))aanndd c caallccuullaatteeddCCLLDDooffrraannddoommaagggglloommeerraatteeccoonnssttrruucctteeddffrroommCCCCAAmmeecchhaanniissmm((NNpp==113333,, D Dff==11..8899,,
D
==77..55µµmm,,
==11..7755))..0
1
2
3
4
5
6
7
8
1
10
100
C L D (% p roba bi lit y)chord lenght (μm)
model Np=214, Df=1.95
experiment, t=110 min
F Fiigguurree88::CCoommppaarriissoonnbbeettwweeeenneexxppeerriimmeennttCCLLDD((tt==111100mmiinn,,1100%%wwaatteerr,,22%%aaddddiittiivvee))aanndd c caallccuullaatteeddCCLLDDooffrraannddoommaagggglloommeerraatteeccoonnssttrruucctteeddffrroommCCCCAAmmeecchhaanniissmm((NNpp==221144,, D Dff==11..9955,,D
==77..55µµmm,,
==11..7755))..0 1 2 3 4 5 6 7 1 10 100 C L D (% p ro ba bil it y) chord lenght (μm) experiment, t=130 min model Np=584, Df=2.19 F Fiigguurree99::CCoommppaarriissoonnbbeettwweeeenneexxppeerriimmeennttCCLLDD((tt==113300mmiinn,,1100%%wwaatteerr,,22%%aaddddiittiivvee))aanndd c caallccuullaatteeddCCLLDDooffrraannddoommaagggglloommeerraatteeccoonnssttrruucctteeddffrroommCCCCAAmmeecchhaanniissmm((NNpp==558844,, D Dff==22..1199,,
D
==77..55µµmm,,
==11..7755)).. 0 1 2 3 4 5 6 1 10 100 C L D (% pr oba bi liy ) chord lenght(µm) model Np = 100, Df =2.0 experiment, t=90 min F Fiigguurree1100::CCoommppaarriissoonnbbeettwweeeenneexxppeerriimmeennttCCLLDD((tt==9900mmiinn,,2200%%wwaatteerr,,22%%aaddddiittiivvee))aanndd c caallccuullaatteeddCCLLDDooffrraannddoommaagggglloommeerraatteeccoonnssttrruucctteeddffrroommCCCCAAmmeecchhaanniissmm((NNpp==110000,,DDff==22..00,,D
==77..55µµmm,,
==00..55))..0 0.5 1 1.5 2 2.5 3 3.5 4 4.5 1 10 100 C L D (% pr oba bi lit y) chord lenght(µm) model Np = 250, Df = 2.2 experiment, t=105 min F Fiigguurree1111::CCoommppaarriissoonnbbeettwweeeenneexxppeerriimmeennttCCLLDD((tt==110055mmiinn,,2200%%wwaatteerr,,22%%aaddddiittiivvee))aanndd c caallccuullaatteeddCCLLDDooffrraannddoommaagggglloommeerraatteeccoonnssttrruucctteeddffrroommCCCCAAmmeecchhaanniissmm((NNpp==225500,,DDff==22..22,,
D
==77..55µµmm,,
==00..55)).. 0 0.5 1 1.5 2 2.5 3 3.5 4 4.5 1 10 100 C L D (% p ro ba bility ) chord lenght (µm) model with Np = 250, Df = 2.4 experiment, t=115 min F Fiigguurree1122::CCoommppaarriissoonnbbeettwweeeenneexxppeerriimmeennttCCLLDD((tt==111155mmiinn,,2200%%wwaatteerr,,22%%aaddddiittiivvee))aanndd c caallccuullaatteeddCCLLDDooffrraannddoommaagggglloommeerraatteeccoonnssttrruucctteeddffrroommCCCCAAmmeecchhaanniissmm((NNpp==225500,,DDff==22..44,,D
==77..55µµmm,,
==00..55))..0
1
2
3
4
5
6
7
1
10
100
C
L
D
(%
p
ro
ba
bilit
y)
chord lenght (µm)
experiment, t=40 min
model Np=133, Df= 1.97
F Fiigguurree1133::CCoommppaarriissoonnbbeettwweeeenneexxppeerriimmeennttCCLLDD((tt==4400mmiinn,,3300%%wwaatteerr,,22%%aaddddiittiivvee))aanndd c caallccuullaatteeddCCLLDDooffrraannddoommaagggglloommeerraatteeccoonnssttrruucctteeddffrroommCCCCAAmmeecchhaanniissmm((NNpp==113333,, D Dff==11..9977,,D
==55µµmm,,
==11..55))..0
1
2
3
4
5
6
7
1
10
100
C
L
D
(%
p
roba
bi
lit
y)
chord lenght (µm)
experiment, t=65 min
model Np=178, Df=2.04
F Fiigguurree1144::CCoommppaarriissoonnbbeettwweeeenneexxppeerriimmeennttCCLLDD((tt==6655mmiinn,,3300%%wwaatteerr,,22%%aaddddiittiivvee))aanndd c caallccuullaatteeddCCLLDDooffrraannddoommaagggglloommeerraatteeccoonnssttrruucctteeddffrroommCCCCAAmmeecchhaanniissmm((NNpp==117788,, D Dff==22..0044,,D
==55µµmm,,
==11..55))..0
1
2
3
4
5
6
7
8
1
10
100
C
L
D
(%
p
ro
ba
bilit
y)
chord lenght (µm)
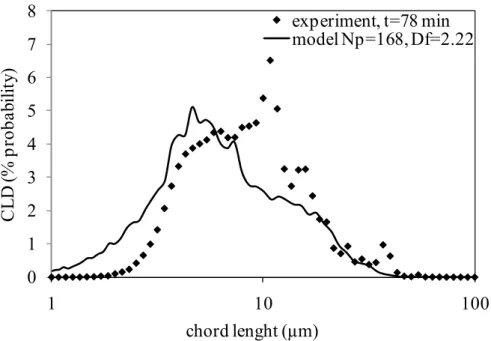
experiment, t=78 min
model Np=168, Df=2.22
F Fiigguurree1155::CCoommppaarriissoonnbbeettwweeeenneexxppeerriimmeennttCCLLDD((tt==7788mmiinn,,3300%%wwaatteerr,,22%%aaddddiittiivvee))aanndd c caallccuullaatteeddCCLLDDooffrraannddoommaagggglloommeerraatteeccoonnssttrruucctteeddffrroommCCCCAAmmeecchhaanniissmm((NNpp==116688,, D Dff==22..2222,,D
==55µµmm,,
==11..55))..Figures 7 to 15 show that CLD calculated with increasing fractal dimension (Df) have increasing number of secondary peaks, and CLD of agglomerates with increasing number of primary particles (Np) have increasing maximal chord length. The fractal dimension influences the probability density of the CLD secondary peaks. When the fractal dimension increases both the number and intensity of the secondary peaks increased. In the opposite, the intensity of the principal peak decreases as the fractal dimension increases.
Figures 7 to 15 show that calculated CLD are superposed with CLD from experiment. The peak corresponding to primary particles is better superposed with the primary particles peak than in the model with random agglomerates constructed from monodispersed populations [1]. During experiments the adjusted fractal dimensions and primary particles numbers increase which demonstrate that aggregates grow and became more and more compacts during crystallization. This evidence was already observed in the work of Fidel-Dufour et al [9].
Mean chord lengths were calculated from calculated CLD and compared with values from experiment CLD.
The mean chord length in number of chords un-weighted is:
1 1
( )
( )
ii
Mf i l
L
i
Mf i
(3)and the square-weighted is
3 2 1 2 1
( )
( )
i ii
Mf i l
L
i
Mf i l
(4)where M is the number of chord length intervals, li is the centre of the ith interval and f(i) is
the probability of measuring a chord length in the ith interval. The mean chord lengths
un-weighted and square un-weighted were calculated to experiment with emulsion with 10%, 20%; 30% water and 2%additive.
Table 2 show that the mean chord lengths calculated are near the measured ones, which one more time validates the model developed in this work.
T Taabbllee22::CCoommppaarriissoonnbbeettwweeeennmmeeaanncchhoorrddlleennggtthhssccaallccuullaatteeddaannddmmeeaassuurreedddduurriinnggtthhee c crryyssttaalllliizzaattiioonneexxppeerriimmeennttffoorreemmuullssiioonnsswwiitthh22%%aaddddiittiivveeaanndd1100%%,,2200%%aanndd3300%%ooffwwaatteerr.. Measured (µm) Calculated (µm) t (min)
L
2L
L
L
2 1 100%% wwaatteerr 100 11.6 27.2 10.2 22.7 110 12.5 36.6 11.4 26.6 130 12.1 32.7 14.8 37.8 2 200%% wwaatteerr 90 10.5 40.0 10.2 36.0 105 11.5 44.0 11.7 42.0 115 11.3 42.0 11.1 40.0 3 300%% wwaatteerr 40 7.8 16.6 7.4 17.0 65 9.0 21.5 9.1 22.2 78 10.0 21.3 7.4 17.0I
I
I
V
V
V
.
.
.
C
C
C
o
o
o
n
n
n
c
c
c
l
l
l
u
u
u
s
s
s
i
i
i
o
o
o
n
n
n
s
s
s
A model was developed in order to interpret chord length distributions measured with an FBRM probe during crystallization of methane hydrates from water in oil emulsion in a flow loop.
The primary particles diameter is related to the mode of the peak obtained in the smallest detected chord lengths. The profile of the shoulder at larger chords lengths seems to be suggestive of the compactness of aggregate by its fractal dimension, and the maximum measured chord length is correlated to the number of primary particles in each agglomerate. The model supposes that the initial chord length distribution of the emulsion corresponds to the CLD of the methane hydrates. During crystallization the hydrate particles agglomerate in fractal agglomerates. The ratio between the agglomerate diameter and the primary particles diameter is proportional to the number of primary particles in the agglomerate through the fractal dimension.
The model constructs random agglomerates with known primary particle number and fractal dimension from a polydispersed population of spheres. The CLD of this agglomerate is then compared with the experiment CLD to determine the experimental agglomerates characteristics. The results from this comparison were very encouraging in order to validate the interpretation procedure.
Furthermore a simple method must be developed to automatically adjust the two parameters
Np and Df for each CLD from the experiment.
A
A
A
c
c
c
k
k
k
n
n
n
o
o
o
w
w
w
l
l
l
e
e
e
d
d
d
g
g
g
m
m
m
e
e
e
n
n
n
t
t
t
s
s
s
The authors would like to thank A. Lallemand and F. Chauvy as well as E. Peuriere and G. Avril for their precious technical help during the experiments. The authors are really grateful for their technical expertise, which widely contributes to the success of the experimental campaigns.
R
R
R
e
e
e
f
f
f
e
e
e
r
r
r
e
e
e
n
n
n
c
c
c
e
e
e
s
s
s
[1] Le Ba H., Cameirao A., HerriJ.-M., DarbouretM., Peytavy J.-L., GlénatP., Chord length distributions measurements during crystallisation and agglomeration of gas hydrate in a water-in-oil emulsion: simulation and experimentation, Chem. Eng. Sci., 65, 2010, 1185-1200
[2] Hammerschmidt E.G., Formation of gas hydrates in natural gas transportation lines, Ind. Eng. Chem., 26, 1934, 851-855
[3] Walsh M. R., Hancock S. H., Wilson S. J., Shirish, Collett T. S., Koh C. A., Sloan E. D., Preliminary report on the commercial viability gas hydrates, Energy Economics, 31, 2009, 815–823
[4] Sum A., Koh C.A., Sloan E.D., Clathrate Hydrates: from laboratory science to engineering practice, Ind. Eng. Chem. Res., 48, 2009, 7457-7465
[5] Sloan E.D., 1998. Clathrate hydrates of natural gases, Second ed., Marcel Dekker, Inc, New York.
[6] Filippov, V., Zurita, M., Rosner, D.E., Fractal-like Aggregates: Relation between Morphology and Physical Properties. Journal of Colloid and Interface Science, 229, 2000, 261-273.
[7] Mills P., Non-Newtonian behavior of flocculated suspensions, J. Physique Lett., 46, 1985, 301-309
[8] Camargo R., Palermo T., Rheological properties of hydrate suspensions in an asphaltenic crude oil, Proceedings of the fourth international conference on gas hydrates, Yokohama, May, 2002, 880-885
[9] Fidel-Dufour, A., Gruy, F., Herri, J.M., Rheology of methane hydrate slurries during their crystallization in a water in dodecane emulsion under flowing, Chemical Engineering Science, 61, 2006, 505-515.
[10] Colombel E., Gateau P., Barré L., Gruy F., Palermo T., Discussion of agglomeration mechanisms between hydrate particles in water in oil emulsions, Oil & Gas Science and Technology, 64, 5, 2009, 629-636
[11] Worlitschek, J., Hocker T., Mazzotti M., Restoration of PSD from chord length distribution data using the method of projections onto convex sets, Part. Part. Charact, 22, 2005, 81-98
[12] Li M., Wilkinson D., Determination of non-spherical particle size distribution from chord length measurements Part 1-Theoretical analysis, Chemical Engineering Science, 60, 2005, 3251-3265
[13] Greaves D., Boxall J., Mulligan J., Sloan E. D., Koh C., Hydrate formation from high water content-crude oil emulsions. Chemical Engineering Science, 63, 2008, 5410-5419.
[14] Boxall J., Koh C.A., Sloan D., Sum A., Wu D. T., Measurement and calibration of droplet size distribution in water-in-oil emulsions by PVM and a FBRM method, Ind. Eng. Chem. Res., 49, 2010, 1412-1418
[15] Mettler-Toledo Lasentec® Product Group, 2001. Lasentec® D600 Hardware Manual. Mettler-Toledo AutoChem, Inc., Redmond, WA