ORIGINE DU C02 DANS LES FLUIDES PROFONDS DES CHAMPS
GÉOTHERMIQUES DU MEXIQUE
MÉMOIRE
PRÉSENTÉ
COMME EXIGENCE PARTIELLE
DE LA MAITRISE EN SCIENCES DE LA TERRE
PAR
LUC RICHARD
UNIVERSITÉ DU QUÉBEC À MONTRÉAL Service des bibliothèques
Avertissement
La diffusion de ce mémoire se fait dans le respect des droits de son auteur, qui a signé le formulaire Autorisation de reproduire et de diffuser un travail de recherche de cycles supérieurs (SDU-522 – Rév.01-2006). Cette autorisation stipule que «conformément à l’article 11 du Règlement no 8 des études de cycles supérieurs, [l’auteur] concède à l’Université du Québec à Montréal une licence non exclusive d’utilisation et de publication de la totalité ou d’une partie importante de [son] travail de recherche pour des fins pédagogiques et non commerciales. Plus précisément, [l’auteur] autorise l’Université du Québec à Montréal à reproduire, diffuser, prêter, distribuer ou vendre des copies de [son] travail de recherche à des fins non commerciales sur quelque support que ce soit, y compris l’Internet. Cette licence et cette autorisation n’entraînent pas une renonciation de [la] part [de l’auteur] à [ses] droits moraux ni à [ses] droits de propriété intellectuelle. Sauf entente contraire, [l’auteur] conserve la liberté de diffuser et de commercialiser ou non ce travail dont [il] possède un exemplaire.»
Je tiens à remercier mon directeur de recherche Daniele L. Pinti de la confiance qu'il m'a accordée en m'accueillant au sein de son équipe. Son soutien, ses conseils judicieux ainsi que ses multiples idées ont été indispensables à la réalisation de ma maîtrise.
Je souhaite également remercier mon codirecteur de recherche Jean-François Hélie pour sa disponibilité, ses conseils pratiques et sa pédagogie. Merci d'avoir pris le temps de m'expliquer la science derrière le fonctionnement des différents appareils de laboratoire et de m'avoir initié à leur entretien.
Merci à vous deux pour votre implication dans mon projet de recherche et pour les nombreuses connaissances que vous m'avez transmises. Ce fut une expérience très enrichissante et formatrice au monde de la recherche.
Je tiens à souligner l'intérêt envers mon projet d'études et la participation de Michel Préda par les analyses minéralogiques et cristallographiques réalisées. Un gros merci à mes collègues de bureau avec qui j'ai partagé tant de rires, de nourritures et de bons moments. Un merci plus particulier à Matthieu Moingt pour nos discussions scientifiques animées, ainsi que sa rigueur et ses conseils pratiques.
Merci à mes collègues de terrain Jonny Bahena R0mero, Colin Ferguson et Sandra Nuiiez avec qui j'ai partagé deux trop courtes semaines remplies de rires. Aye aye aye amigos !
Je remercie également la comm1ss1on fédérale électrique ( Comision federal de electricidad: CFE) du Mexique pour nous avoir permis d'échantillonner leurs champs géothermiques. Je tiens notamment à souligner l'hospitalité des membres de l'équipe de Cerro Prieto et Las Tres Virgenes.
Les derniers remerciements appartiennent à ma famille pour leur soutien continu et leur encouragement dans les moments de doutes. Leur implication dans les différents projets de ma vie est sans faille, sans eux il m'aurait été difficile de finaliser celui-ci.
Merci à ma partenaire de vie, mon amie et ma confidente avec qui je partage tant d'amour et de bons moments. Tu m'as motivé à fournir les derniers efforts et tu me fais grandir.
Ce mémoire s'inscrit dans le cadre du Projet 20 (évaluation du potentiel et de la surexploitation des puits géothermiques à l'aide des gaz rares) dirigé par la professeure Aida L6pez Hemandez de l 'Universidad Michoacana de San Nicolas de Hidalgo pour le centre mexicain d'innovation en énergie géothermique (CeMIEGeo). Le financement a été entièrement assuré par le CONACYT (Consejo Nacional de Cienca y Tecnologia de Mexico). Ce mémoire a été rédigé sous forme d'article scientifique qui sera soumis au Journal of Volcanology and Geothermal Research. Cela dit la langue, la mise en forme et la méthode de citation sont celles demandées par le journal. J'ai effectué l'échantillonnage des champs géothermiques Cerro Prieto et Las Tres Virgenes avec l'aide de mes collègues cités dans les remerciements, des membres du personnel de la CFE (Comisi6n Federal de Electricidad) et de mon directeur de recherche Daniele L. Pinti lors de la campagne d'échantillonnage de novembre 2016 au Mexique. La campagne d'échantillonnage des champs géothermiques Los Azfures et Los Humeros avait préalablement été effectuée par le professeur Pinti, les membres de son groupe de recherche du moment ainsi que ceux de la CFE. Mon implication dans le projet a été d'effectuer le travail en laboratoire, l'interprétation des résultats et la rédaction de l'article scientifique pour la partie isotope stable du C02• Mes directeurs de recherche ont supervisé l'ensemble du travail et révisé l'article scientifique.
REMERCIEMENTS ... iii
AVANT-PROPOS ... V LISTE DES FIGURES ... ix
LISTE DES TABLEAUX ... xi
LISTE DES ABRÉVIATIONS, SIGLES ET ACRONYMES ... xiii
LISTE DES SYMBOLES ... xvii
RÉSUMÉ ... xix
CHAPITRE I INTRODUCTION ... 1
CHAPITRE II DEEP CARBON IN GEOTHERMAL FIELDS OF MEXICO ... 3
2.0 Abstract ... 4
2.1 Introduction ... 7
2.2 Geology ... 9
2.2.1 The Cerro Prieto Geothermal Field (CP-GF) ... 10
2.2.2 Los Azufres Geothermal Field (LA-OF) ... 12
2.2.3 Los Humeros Geothermal Field (LH-GF) ... 13
2.2.4 Las Tres Virgenes Geothermal Field (L TV-GF) ... 15
2.3 Sampling and analytical methods ... 17
2.3.1 Sampling ... 17
2.3.2 Analytical methods ... 19
2.3.3 Assessment of the total method variability ... 19
2.4 RESUL TS ... 22
2.5 DISCUSSION ... 24
2.5.1 Inter-field C and O isotopie variability ... 24
2.5.2 The O isotopie variability ... 25
2.6 Conclusions ... 36
2.7 Acknowledgments ... 38
2.8 Appendix ... 39
2.9 References ... 41
2.10 Figures and table ... 56
CHAPITRE III CONCLUSION GÉNÉRALE ... 67
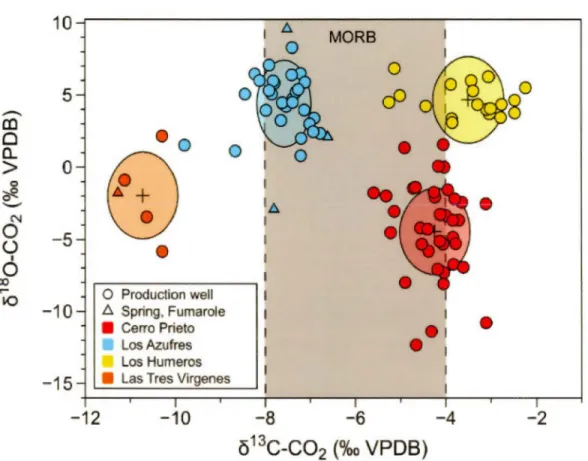
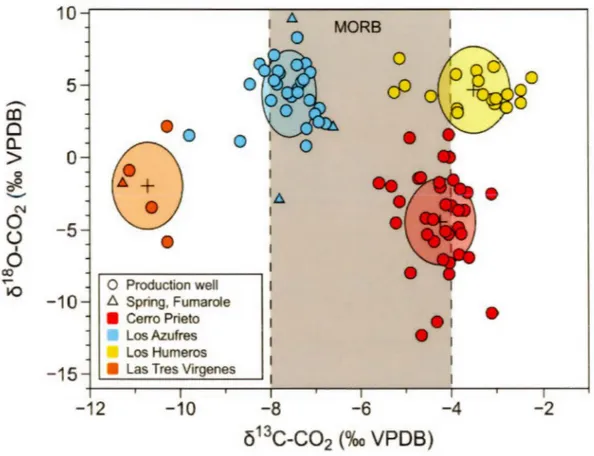
Figure Page 2.0. Graphical Abstract. Distinct isotopie composition of carbon and oxygen in
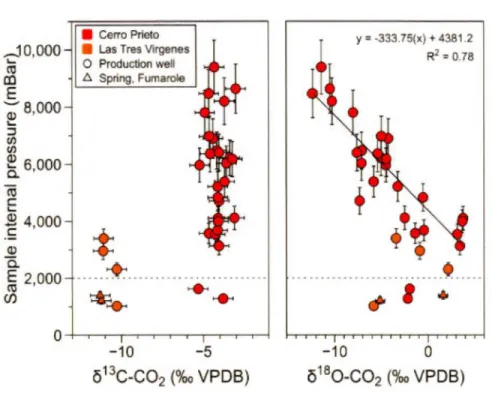
C02 from production wells, hot springs and fumaroles of Mexican geothermal fields. The values in each field is discretely highlighted by ellipsoids of different colors which represents the total method variability around a mean value which is represented by the cross sign ... 6 2.A.1 Sample internai pressure versus the C02 isotopie composition. The solid line
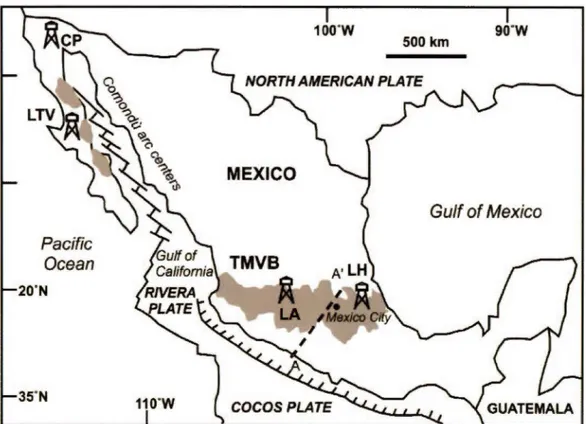
is the linear correlation between the sample internai pressure and the 618 0-C02 while the dash line represents the 2bar threshold ... 39 2.1 Location of the geothermal fields sampled for this study with main
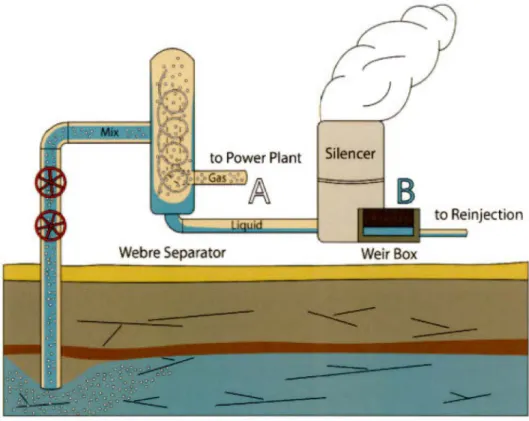
geodynamic features of the region. TMVB is the Trans-Mexican Volcanic Belt interpreted as the surface expression of the present-day subduction of the Cocos Plate. The Comondù arc centers are intrusions related to Miocene-time subduction which is now inactive and replaced by the Gulf of Califomia opening. The A-A' is the transect of the lithospheric cross section of Figure 2.8 ... 56 2.2 Geothermal well platform sketch showing the Webre separator, the silencer
and the weirbox, with the position were gas (point A) and water (point B) samples were taken ... 57 2.3 The C and O isotopie composition measured in the four geothermal fields.
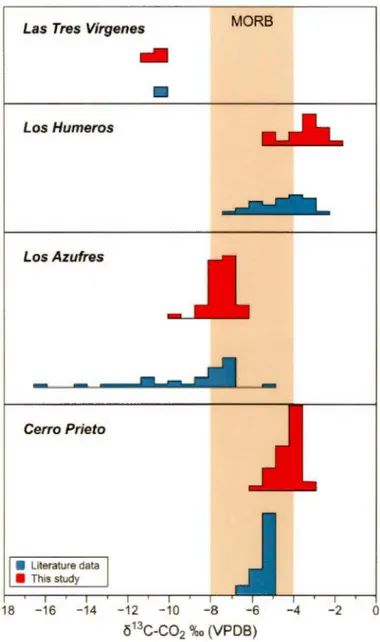
Ellipsoids of different colors represents the total method variability around a mean value which is represented by the cross sign ... 58 2.4 Comparison between the carbon isotopie composition, expressed as ô13C (%0
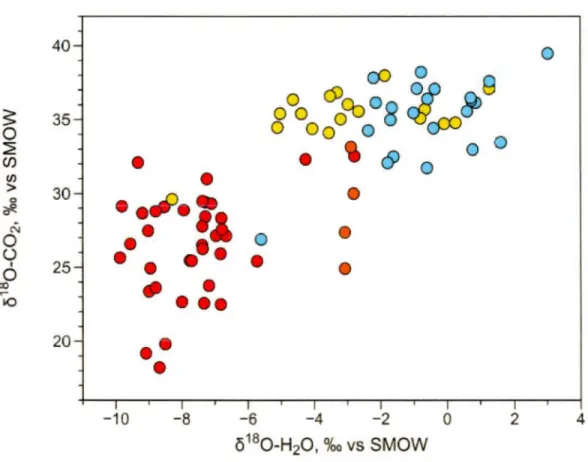
vs VPDB) measured in the four geothermal fields in this study and previous literature data. To notice the extreme lighter values measured in Los Azufres by Birkle et al. (2001) which might indicate organic contamination during sampling or during analyses ... 59 2.5 The O isotopie composition of geothermal water and C02 (both normalized
to VSMOW) in the different geothermal field. The general trend indicates that equilibration between the two phases basically controls the oxygen
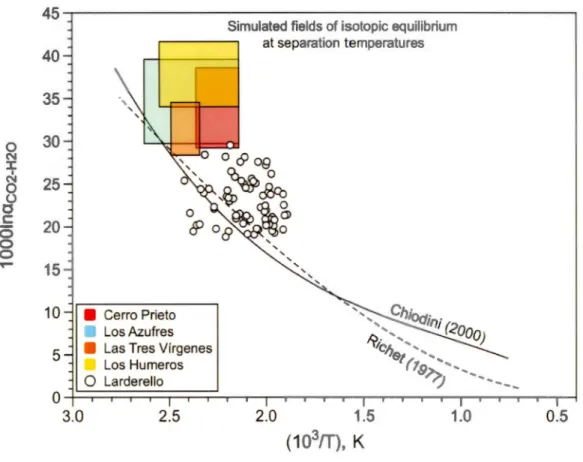
isotopie signature. Scattering indicates likely the overlapping with other local processes such as exchange with silicates and carbonates in the reservoir ... 60 2.6 The per mil fractionation of the COi-H20 phase equilibration calculated at
different temperatures. The curve of Chiodini et al. (2000) is calculated based on data from hot springs. The Richet et al. ( 1977) curve is theoretical. The boxes represent the possible range per mil fractionation between C02 and H20 in the four geothermal fields studied, calculated at well separation temperatures. The data of Panichi et al. (1977) for Larderello field, Italy, is also reported for comparison ... 61 2. 7 Atmosphere-corrected 3HefHe ratio measured in geothermal fluids of
Mexico expressed as ratio Re normalized to the atmospheric one Ra(= 1.384 x lff\ Lupton et al., 1976) versus the
ô
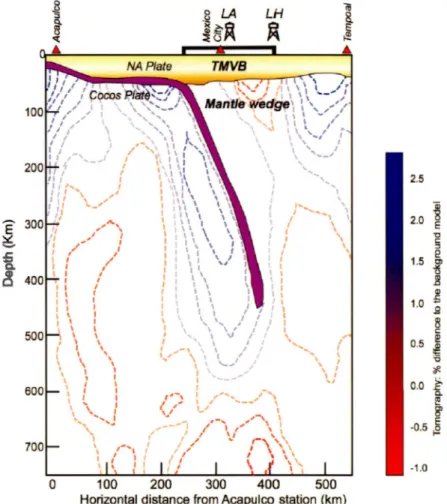
13C-C02 measured in the same wells (see text for data sources). The dashed lines represent hyperbolas of mixing between the MORB mantle source and organic matter (OM) rich sediments and carbonates. Hyperbola curvature "r" is equal to the ratio(C/He)mantle/(C/He)organic/carbonate. Note that the Y-axis is split for sake of clarity ... 62 2.8 Cross section of the Coco plate subduction zone at the level of Mexico City
(adapted from Peréz-Campo et al., 2008) with the relative position of the Trans Mexican Volcanic Belt (TMVB) and the geothermal fields of Los Azufres (LA) and Los Humeros (LH). Blobs of mantle material of different nature (fertilized mantle = orange and lithospheric mantle = red) are reported as possible sources of He and C in the two fields ... 63
Tableau Page 2.A.1 Repeated analyses of C02 isotopes in Cerro Prieto wells to test analytical
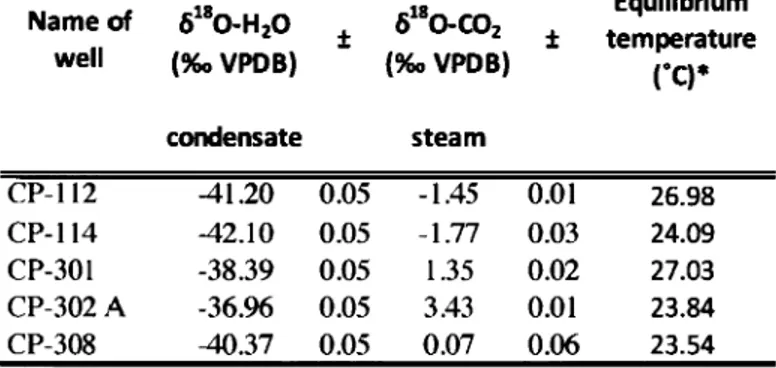
consistency ... 40 2.A.2 Measurements of oxygen isotopie signature in condensate water and steam
from the same sampling tube ... 40 2.1 The geothermal field sampled, the type of fluid collected, the year of
sampling and the,
ô
13C-C02,ô
180-C02 (with their analytical uncertainties). ··· 64CONACYT CP CFE E.g. Et al. GF GMWL
Consejo Nacional de Ciencia y Tecnologia Conseil nationale de science et technologie
Cerro Prieto
Comision Federal de Electricidad Commission fédérale électrique
Exempli gratia Par exemple Et a/li Et autres Geothermal field Champ géothermique
Global Meteoritic Water Line Droite des eaux météoritiques
I.e.
IRMS
LA
LH LSVEC LTVMORB
NPZOM
Id est
C'est-à-direIsotop ratio mass spectrometer
Spectromètre de masse à ratio isotopique
Los Azufres
Los Humeros
Lithium carbonate prepared by H Svec
Carbonate de lithium préparé par H. SvecLas Tres Virgenes
Mid Ocean Ridge Baisait
Basalte de ride médio-océanique
Nothern Production Zone
Zone de production du NordOrganic Matter
Matière organiquePETM SPZ Sr TMVB VSMOW VPDB
Paleocene-Eocene thermal maximum
Maximum thermique de la transition Paléocène-Éocène
Southern Production Zone Zone de production du Sud
Strontium
Trans Mexican Volcanic Belt
Ceinture de roches volcaniques transMexicaine
Vienna Standard mean ocean water
Eau océanique moyenne normalisée de Vienne
Vienna Pee Dee Belemnite
C Carbone
Cl!i
Méthane C02 Dioxyde de carbone cm Centimètreoc
Degré Celsius Delta Environ H20 Eau He Hélium Km Kilomètre0 Oxygène
> Plus grand que
± Plus ou moins
< Plus petit que
,,
Pouce
Les champs géothermiques (GFs) offrent une fenêtre géologique de plus de 4 km de profondeur sur le« carbone profond». Le cycle« géologique» du carbone est encore mal caractérisé, bien qu'il ait engendré certains des changements climatiques les plus drastiques à l'échelle des temps géologiques, tels que la sortie de « snowball earth » et le maximum thermique du Paléocène-Éocène (PETM). Face aux changements climatiques actuels, il est devenu nécessaire de caractériser l'ensemble des sources d'émission de carbone anthropique et naturel. Ce projet de maîtrise s'inscrit dans un effort d'amélioration des connaissances sur le carbone profond en fournissant une étude complète de l'origine et du comportement du carbone en contexte géothermal. Une vaste campagne d'échantillonnage a été déployée entre 2014 et 2016 dans les GFs de « haute température » (> 200 °C) de Cerro Prieto (CP-GF), Los Azufres (LA-GF), Los Humeros (LH-GF) et Las Tres Virgenes (LTV-GF). La composition isotopique de l'oxygène et du carbone du CO2 a permis de distinguer pour une première fois les fluides de chaque GF. Les résultats ont démontré que la source du C de l'ensemble des GFs est principalement mantellique. Elle est donc comparable à
celle qui alimente les basaltes de rides médio-océaniques (MORBs). Cependant, et grâce à des comparaisons entre la composition isotopique du carbone ( d 13C) et celle de l'hélium (3He/4He)on observe une contribution en C qui provient d'un échange isotopique avec des carbonates à LH-GF et de la matière organique à L TV-GF. La composition isotopique de l'oxygène du C02 est dépendante de la source initiale d'eau alimentant les fluides géothermiques et des processus d'équilibrations subséquents. Une équilibration partielle entre l'oxygène de la molécule d'eau et du CO2 au séparateur a été observée alors que des recherches précédentes indique un équilibre complet. Il est intéressant de noter que la réinjection des fluides dans un réservoir géothermique déplace la composition isotopique de l'eau vers des valeurs plus élevées. C'est notamment le cas au CP-GF qui semble maintenant être un mélange d'eau météoritique et andésitique plutôt que magmatique. L'évolution des fluides au CP-GF induit également un rapport 3He/4He plus faible que prévu dans un contexte de
«
pull-apart ». Il a été proposé par Pinti (2018) que cette anomalie soit causée par la production de 4He par désintégration d'uranium et de thorium dans le réservoir confiné du CP-GF.Mots-clés : carbone profond; dioxide de carbone, isotopes du carbone, isotopes de l'oxygène; isotopes de l'hélium; systèmes géothermaux
INTRODUCTION
Le réchauffement climatique est l'un des enJeux les plus importants auxquels l'homme fait actuellement face. Le flux de carbone anthropique représente aujourd'hui plus de 10 fois celui du carbone naturellement émis durant le maximum thermique de la transition Paléocène-Éocène (PETM) (Zeebe, Ridgwell et Zachos, 2016). Ces émissions naturelles ont suffi à engendrer un réchauffement climatique de -5-8 °C ainsi qu'un grand bouleversement de la biodiversité (Mclnemey et Wing, 2011). Il est donc primordial de caractériser les sources anthropiques et naturelles du dioxyde de carbone (C02).
Arrhenius (1896) et Chamberlain (1899) furent parmi les premiers à proposer l'incidence du C02 sur le climat. Par la suite, les travaux de Keeling (1960) consistant à mesurer de façon continue les concentrations de C02 atmosphérique ont avivé l'intérêt scientifique. Cela a donc permis de dresser un portrait pragmatique du bilan carbone de l'exosphère ( e. g. Post et al., 1990; Cox et al., 2000; Boesch et al., 2011; Le Quéré et al., 2018). On sait aujourd'hui que le carbone mantellique a amorcé des changements climatiques drastiques au cours des temps géologiques tels que la sortie de
«
Snowball earth»
(Hoffman et al., 1998) et le PETM (Zachos et al., 2005). Cependant, le cycle géologique du dit«
carbone profond»
est encore mal défini, car ce n'est que très récemment que les scientifiques ont cherché à approfondir leurs connaissances sur ce cycle (Dasgupta et Hirschmann, 2010).Ainsi, cette maîtrise a comme objectif principal de contribuer à accroitre les connaissances sur le carbone profond en fournissant une étude complète de l'origine et du comportement du carbone en contexte géothermal. En plus d'être une source énergétique alternative et moins polluante, les champs géothermiques offrent une fenêtre géologique d'une profondeur de plus de 4 km sur le carbone. Le C02 contenu dans les fluides extraits de champs géothermiques représente souvent plus de 90 % de la phase volatile sèche (Birkle et al., 2001 ; Verma et al., 2006). Nous avons donc mesuré les compositions isotopiques du C02
(o
180-C02;o
13C-C02) et de l'H20(o
2H-H20;o
180-H20) des fluides de quatre champs géothermiques mexicains présentement en exploitation pour la production d'électricité par la Comision Federal de Electricidad (CFE), soit Cerro Prieto, Los Azufres, Los Humeros et Las Tres Virgenes (CP, LA, LH et LTV-GF). Les sources et comportement du carbone dans ces réservoirs ont donc été documentés et les résultats principaux de cette maîtrise sont ci-exposés sous forme d'un article scientifique qui sera soumis au Journal of Volcanology and Geothermal Research.
DEEP CARBON IN GEOTHERMAL FIELDS OF MEXICO
LUC RICHARD*1, DANIELE L. PINT11, JEAN-FRANÇOIS HÉLIE1, AIDA LOPEZ HERNANDEZ2, MARIA CLARA CASTR03
1GEOTOP RESEARCH CENTER ON THE DYNAMICS OF THE EARTH SYSTEM, UNIVERSITÉ DU QUÉBEC À MONTRÉAL, H3X 3Y7, QC, CANADA
2
Facultad de Ingenieria Civil, Universidad Michoacana de San Nicolas de Hidalgo (UMSNH), Morelia, Mich., México
3
Department of Earth and Environmental Sciences, University of Michigan, Ann Arbor, Ml, USA
* Corresponding author: Richard.luc.9@gmail.com
+
1 514 265 2795 Prepared for submission to Journal of Volcanology and Geothermal ResearchKeywords: Deep carbon; carbon dioxide; carbon isotopes; oxygen isotopes; helium isotopes; geothermal systems.
2.0 Abstract
An extensive sampling campaign has been carried out between 2014 and 2016 at the Cerro Prieto (CP), Los Azufres (LA), Los Humeros (LH) and Las Tres Virgenes (L TV) geothermal fields, Mexico. The geothermal fields of LA and LH are situated in an arc magmatism context related to the Cocos plate subduction under the North American one. CP and L TV are presently located in extensional contexts of pull-apart related to the San Andreas fault system and of the opening of Gulf of Califomia, respectively. The aim of the study was to determine the origin of C in C02 and its behavior in 'high temperature' (> 200°C) geothermal sedimentary and volcanoclastic reservoirs. The most interesting feature observed in this study is that the measured isotopie composition of C02 (13C/12C and 180/160 ratios) is distinct and unique for each sampled geothermal field. The isotopie variability of carbon is controlled by its sources (i.e., ô13C value: -6±2%o in mantle; -20%o in carbon organic matter-rich sediments; 0±2%0 in marine carbonates). The ii13C in CP and LA are compatible with a dominant mantle carbon source. L TV and LH show lower (-1 O. 72±0.46%0) and higher (-3.50±0.91%o) ii13C than the mantle values, respectively. Based on their helium (3HefHe) and carbon (ô13C) isotopie compositions, the variability of ii13C can be interpreted as caused by the (addition/mixing) of carbon organic matter-rich sediments from ancient subducting plates in L TV and from leaching of marine carbonates located undemeath the basement in LH. The isotopie variability of oxygen is related to the extent of isotopie re-equilibration between steam (H20) and C02,
which in the case of fluids extracted from production wells may have not reached a full re-equilibration.
-
(X) Cln.
>
0 ~-
N0
(.)()
CX),...
l,Q10
1 .6. MORB5
0
0
~
·~0
10
10 ~
cPUSO
•
•
•
-
5
-10
0 Production well .6. Spring, Fumarole • Cerro Prieto LosAzufres Los Humeras-1
5
•
Las Tres Virgenes-12
-1
0
•
•
-8
-6
-4
-2
o
13C-C02
(%0
VPDB)
Figure 2.0. Graphical abstract. Distinct isotopie composition of carbon and oxygen in C02 from production wells, hot springs and fumaroles of Mexican geothermal fields.
he values
in
each field is discretely highlightedby
ellipsoids of different colorswhich represents the total method variability around a mean value which is
2.1 Introduction
lt is only in the last few years that scientists have sought to deepen their knowledge on the quantities, movements, forms, and origins of the so-called "deep carbon" (Dasgupta and Hirschmann, 2010). Although it is widely known that mantle carbon through volcanism has triggered some of the more drastic climate changes over geologic times and biological crisis (Hoffinan et al., 1998; Zachos et al., 2005), there is a lack in the understanding of deep geological carbon cycle (Sano and Williams, 1996).
Basically, carbon is assumed to degas from mid-ocean ridges (Marty and Jambon, 1987) and in back-arc basins (Lan et al., 2010) into the atmosphere and be recycled through subduction either as sedimentary carbon (Sano and Williams, 1996) or possibly marine carbonates (Mason et al., 2017). Only a small fraction of sedimentary carbon is subducted (Kelemen and Manning, 2015), the majority is re-emitted into the atmosphere through arc volcanism (Sano and Williams, 1996). If this basic model of carbon cycling is widely accepted, yet the fluxes of carbon in and out the interior of the Earth and the sources of carbon in the different reservoirs need to be clarified. As an example, based on a compilation of published C (ô13C) and He (3HefHe ratios) isotopie data, Mason et al. (2017) have shown that carbon isotope composition of mean global volcanic gas is considerably higher, -3.8 to -4.6 per mil (%0), than the canonical mid-ocean ridge basait value of -6.0 ±2%o (e.g., Javoy et al., 1986). The largest volcanic emitters of carbon with higher
ô
13C are located in mature continentalarcs that have accreted carbonate platforms, indicating that reworking of crustal limestone is an important source of volcanic carbon (Mason et al., 2017), not of organic carbon as previously postulated (Aiuppa et al., 2017). The fate of this sedimentary carbon back to mande, is also a focus of much debate in the community of diamonds. The "eclogitic diamonds", showing C isotopie compositions as low as -25%0 (Cartigny, 2005), are believed to indicate recycling of organic Cinto the mande participating to the formation of these gems. But recent work of Bureau et al. (2018) has shown that lithospheric monocrystalline, fibrous and coated diamonds grow from a unique carbonate-rich fluid. Isotopie variability in diamonds might be related to different redox conditions during the crystal growth rather than to the variability in carbon sources (Bureau et al., 2018).
These few examples highlight the importance to study the behavior and identify carbon sources from the different Earth's reservoirs. Geothermal areas are important regions at the interface between the continental crust and the subcontinental mande. Geothermal fluids, at temperatures up to 400°C, are fluids of complex nature (Yardley and Bodnar, 2014) with specific isotopie fingerprints (e.g., helium and carbon isotopes) of the interactions between the crust and the mande. C02 is the natural dominant molecule of the dry volatile phase in geothermal fluids, often accounting for more than 90% of the total volume of gases ( e.g., Tabaco et al., 1991; Birkle et al., 2001; Verma et al., 2006). Studying carbon sources in geothermal
aqueous fluids is therefore a mean to better understand the interactions between the crust and the mande and the fate of C in these reservoirs.
This study aims to evaluate the C sources and its behavior in geothermal fluids. We therefore study the C02 stable isotopie composition (8180- and 813C-C02; 180/160 in geothermal C02 has been rarely analyzed) in fluids from the four major Mexican geothermal fields actually exploited for electricity production by the Comisi6n Federal de Electricidad (CFE) of Mexico. The extensive sampling campaign has been conducted between 2014 and 2016 at Cerro Prieto (CP), Los Azufres (LA), Los Humeros (LH) and Las Tres Virgenes (L TV) fields (Fig. 2.1 ). To better constrain the carbon nature in these fields, isotopie data measured from the C02 molecule (8180 and 813C) in this study have been compared to those of the water (8180) and helium isotopie ratio (3HefHe) obtained in the same campaign and published elsewhere (Pinti et al., 2017; Pinti et al., 2018; Nufiez-Hemandéz et al., 2018; Wen et al., 2018) and from a previous sampling campaign at Los Azufres done between 2007 and 2009 (Pinti et al., 2013).
2.2 Geology, hydrology and geochemistry of the studied fields
The geology of the four geothermal fields (GFs) exploited by the CFE in Mexico have been here classified based on the new "geothermal play type" concept proposed by Moeck and Beardsmore (2014). A "play type" in geothermal resources is defined by the heat source, the geological controls on heat transport and thermal
energy storage capacity (Moeck and Beardsmore, 2014). The four studied geothermal fields are known as convection-dominated geothermal plays, which include all known 'high temperature' (>200°C) geothermal reservoirs shallower than 3,000 m. These fields invariably lie on adjacent margins to tectonic plates or on regions of active tectonism, active volcanism, young plutonism, and elevated heat flow due to crustal thinning during extensional tectonics (Moeck and Beardsmore, 2014). In convection-dominated geothermal plays, heat is transported efficiently from deeper places to shallower reservoirs by the upward movement of fluid along permeable pathways. Convection-dominated geothermal plays can be further divided by the nature of the heat source. The LA-GF and LH-GF are known as extrusive magmatic plays which are distinguished by a shallow and intense heat source in the form of a young magma chamber (generally less than 100 kyrs; e.g., Hayba and Ingebritsen, 1997) related to a magmatic arc above a subduction zone in convergent plate margins. The CP-GF and L TV-GF belong to extensional domain geothermal plays where the heat flow is elevated due to crustal extension and thinning.
2.2.1 The Cerro Prieto Geothermal Field (CP-GF)
The CP-GF is located in the Baja Califomia (Fig. 2.1 ), about 30 km south of the town of Mexicali.
It
is the largest high-enthalpy (> 280°C) compressed liquid-dominated geothermal system in Mexico. In the last 50 years, 429 geothermal wells were drilled in CP-GF at depths varying between 1,000 and 4,400 meters. Currently,147 operating wells extract approximately 34.6 million metric tons of steam per year (Gutiérrez-Negrin, 2015).
The CP reservoir is part of a pull-apart basin formed by the active strike-slip Imperia! Fault in the northeast and Cerro Prieto Fault in the southwest of the field, both belonging to the San Andreas Fault System (Suarez-Vidal et al., 2008). The heat source of the field is gabbro intruded less than 100 kyrs ago as a stress response of the extensional crustal thinning (Eiders et al., 1984; Schmitt et al., 2013 ). The basement of the field is mainly composed of Cretaceous granites. On top of it rests a sequence of Plio-Pleistocene sedimentary rocks (Colorado River sandstones interbedded with gray shales called "Lutita Gris") with a mean thickness of 2,400 meters and porosities of up to 22 % hosts the geothermal reservoir. The Lutitas Gris formation is overlain by brown shales (Lutita Café) and mudstones which act as the regional caprock. The unconsolidated quatemary clastic sediments of the Colorado River lie at the top of the stratigraphie sequence (Herrera, 2005).
The natural recharge of the geothermal field is likely assured by the shallow regional aquifer (Truesdell et al., 1979; Pinti et al., 2018). The reservoir temperature ranges from 250 to 310°C. Water is of sodium chloride type with neutral to alkaline pH (Gutiérrez-Negrin, 2015). The C02 represent 78-91 % (m/m) of average dry gas fraction (Nehring and D'Amore, 1984). The C isotopie composition of the C02 from the first drilled wells, which are mostly abandoned, showed a range of èi13C from -6.9 to -4.9%o (Truesdell et al., 1979; Janik et al., 1982).
2.2.2 Los Azufres Geothermal Field (LA-GF)
The LA-GF is located in the Trans-Mexican Volcanic Belt (TMVB; Fig. 2.1) about 80 km east of Morelia in the central Michoacan State. It is the second geothemial field in Mexico for energy production, with a production area of 35 km2 located at an average elevation of 2800 masl (Gutiérrez-Negrin, 2015). Most of its geothermal activity is concentrated in the southern portion of a sierra filled with Miocene andesites and Quaternary dacites, rhyolites and basalts. The southern portion is divided geographically into two zones: the Northern Production Zone (NPZ) and the Southern Production Zone (SPZ). The NPZ is in the compressed liquid region, and the SPZ has different systems depending on depth, which changes to the vapor-dominated, liquid-dominated and compressed-liquid regions as the depth becomes shallow (Torres-Rodriguez et al., 2005).
The geothermal reservoir is hosted in a 2700 m-thick fractured volcanic rocks, which is constructed by Upper Miocene to Pliocene (18.1-5.9 Ma) basaltic andesite to dacite complex, called the Mil Cumbres andesite (Dobson and Mahood, 1985). The reservoir is overlain by Quaternary (0.87 - 0.85 Ma) andesitic lavas and basaltic andesites of the Zinapecuaro unit that acts as a cap-rocks of a silicic sequence of rhyodacites, rhyolites, and dacites with ages ranging from 1.6 Ma and 15,000 years (Pérez et al., 2010). The heat source of the field is of unclear origin. On the basis of helium and strontium isotopie data, Wen et al. (2018) recently suggested that a MORB-like (Middle Ocean Ridge basalts) parental magma, possibly the one which
produced the La Calabaza and Llano Grande matie lava flow sequences younger than 0.6 Ma (Pradal and Robin, 1994), could be the main heat source of the geothermal field.
The LA-GF is associated with a highly fractured geothermal reservoir, with faults in three directions; E-W, NE-SW, and NNW-SSE. The production wells were often drilled at the intersection of these two fault systems, in order to encounter higher reservoir permeability. The reservoir has a temperature range of 240 to 320 °C and is naturally recharged by the shallow regional aquifer and local precipitations (Torres-Rodriguez et al., 2005). The water fraction is of sodium chloride type with pH values between 5.8 and 7.2 (Birkle et al., 2001). C02 constitutes the 94% of the average dry gas fraction (Gutiérrez-Negrin, 2015). A few ô13C-C02 measurements were obtained from production wells and yielded values ranging from -16.1 %0 to -5.4%0 (Tabaco et al., 1991; Birkle et al., 2001; Pinti et al., 2013).
2.2.3 Los Humeros Geothermal Field (LH-GF)
The LH-GF is located on the eastern portion of the Plio-Pleistocene Trans-Mexican Volcanic Belt (Fig. 2.1), near the border with the Sierra Madre Oriental province. The field is located inside a twofold nested caldera complex produced by several rhyodacitic-andesitic plinian eruptions that started during the Miocene and lasted until 20 ka ago. The externat Los Humeros Caldera is the oldest (460 ka) and the largest, with a diameter of 15-20 km. The internai Los Potreros Caldera is the
youngest (100 ka) and bas a diameter of 8-10 km (e.g., Norini et al., 2015) and is the location of an active geothermal field that covers 17 km2 at surface. The heat source of the field is a magmatic chamber at the terminal hydrothermal stage (Gutiérrez-Negrfn et al., 2010).
The geothermal reservoir of the Los Humeros system consists of a sequence of blocks delimited by faults arranged as graben and horst and associated with the collapse of the Los Humeros Caldera formation. The LH-GF stratigraphy is composed of four geological units, from bottom to top: Unit (4) is the basement with granites and schists of Paleozoic age, covered by a thick series of Jurassic and Cretaceous limestones, metamorphosed during the Laramide orogeny and by Oligocene magmatic intrusions (De la Cruz, 1983). Unit (3) consist of Mio-Pliocene (10-1.9 Ma) pre-caldera volcanic deposits represented by the Teziutlan and Alseseca andesites intercalated with tuff horizons. Unit (2) is composed of Quaternary caldera volcanic products (510 ka - 100 ka) namely the Zaragosa and the Xaltipan andesites. Unit 1 consists of Quaternary rocks (<100 ka) related to the collapse of Los Potreros Caldera.
Recharge might occur locally, from rainfall infiltrating the reservoir through fault and fracture systems (Cedillo Rodrfguez, 2000) bordering the Los Proteros escarpment (Pinti et al., 2017). The reservoir bas a temperature of 210 to 380 °C (Gutiérrez-Negrfn, 2015) and contains fluids of sodium chloride to bicarbonate-sulfate type with a neutral pH (Arellano et al., 2003). However, very acidic fluids
(pH< 4-5) were found in the center of the field, possibly related to condensation of superheated steam containing HCl (Bischoff et al., 1996). The average dry gas fraction of the geothermal fluids contains up to 96% of C02 (Gonzalez-Partida et al., 1993). Carbon of the C02 molecule bas been studied by Gonzalez-Partida et al.
(1993) and Portugal et al. (1994, 2002) who reports Ô13C-C02 values from 6.6 to -3.2%0.
2.2.4 Las Tres Virgenes Geothermal Field (L TV-GF)
L TV-GF is located in the northern portion of Baja California Sur (Fig. 2.1 ). The LTV-GF is located in a NW-SE oriented Plio-Quaternary rift called Santa Rosalia Basin (L6pez et al., 1995). This basin constitutes the western limit of the deformation zone related to the opening of the Gulf of California, which created several young oceanic basins inter-connected by transform faults (Fig. 2.1; Arango-Galvân et al., 2015). This area was, during the Miocene, the subduction zone of the Farallon plate under the American continent (Comondù arc in Fig. 2.1; Aguill6n-Robles et al., 2001; Bellon et al., 2006; Calmus et al., 2008; Ferrari et al., 2012). The field is located within three volcanic eruptive centers: La Reforma caldera (3.5 to 0.8 Ma), Sierra de Aguajito (0.7-0.45 Ma) and Las Tres Virgenes complex (0.44 Ma- 30 ka) (L6pez et al., 1995; Schmitt et al., 2010).
The majority of the thermal activity is located at the border of the Las Tres Virgenes volcanic complex with the El Aguajito Caldera, where geophysical prospecting
indicates the presence of conductive bodies at depths of 1.5 to 12 km (Prol-Ledesma et al., 2016). The reservoir is located in the basement and corresponds to low-permeability Upper Cretaceous granodiorites (Hinojosa et al., 2005). The basement is overlain by 750 m of Upper Oligocene to Middle Miocene volcano-sedimentary sandstones and andesites (Santa Lucia Fm) of the Comondu group (L6pez et al., 1995; Macias Vazquez and Jiménez Salgado, 2013) which may behave as caprock. Over the Commondu group rests the Late Miocene Esperanza Formation initially described as tholeiitic basalts but now considered to be the product of subduction and to be similar to adakites (e.g., Aguill6n-Robles et al., 2001; Calmus et al., 2011). These basalts are overlain by 300 m of sands, conglomerates and pyroclastics, which were deposited in the shallow marine environment of the Pliocene to Quatemary depression of the Santa Rosalia Basin (L6pez et al., 1995).
Recent studies have shown that the most permeable zone of the L TV reservoir has a thickness of approximately 300 m and that the exploitable area is about 6 km2 (Tello-L6pez and Torres-Rodriguez, 2015). The shallow regional aquifer acts as the natural recharge of the reservoir, which has a temperature ranging from 250 to 275 °C (Tello-L6pez and Torres-Rodriguez, 2015). The water fraction is of sodium chloride to bicarbonate-sulfate type (Barragân et al., 2010) with a neutral pH. C02 represents 97 to 99 wt% of the average dry gas fraction (Verma et al., 2006). Only a single 813C of C02 value of -10.1 %0 has been reported in literature (Birkle et al., 2016).
2.3 Sampling and analytical methods
2.3.1 Sampling
To obtain a substantial database on the carbon dioxide of geothermal fluids, an exhaustive sampling campaign was carried out between 2014 and 2016 in the framework of the CeMieGEO (Centro Mexicano de Innovaci6n en Energia Geotérmica) Project 20. LA-GF has been sampled in November 2014; LH-GF sampling campaign has been conducted in January 2015, while CP-GF and LTV-GF have been sampled in November 2016. A dataset on the isotopie composition of C02 from gas samples collected in 2007-2009 by Pinti et al. (2013) has been corrected and included in this study. A total of 105 sites have been sampled for gas phase. Among these samples, 96 contained enough C02 to be analyzed for 8180-C02 and 813C-C02, while 141 water samples were analyzed for the stable isotopie composition of water and mainly published elsewhere (Pinti et al., 2013; Pinti et al., 2017; Nuiiez-Hemandéz et al., 2018).
Gas and water samples were collected using a similar method to the one described in Pinti et al. (2017). Gas samples were collected on the wellhead after the steam-water "Webre" separator (Fig. 2.2; Point A). At one of the valve manifolds along the steam tube (used for collecting purposes), a refrigeration-grade 3/8" copper tube was connected, using NPT-type female connector for airtightness purpose. The internai pressure of the steam tube was maintained slightly higher than the
atmospheric pressure, allowing the purge of the air present in the tube and avoiding air contamination. The gas circulates through the copper tube for several minutes until a constant outgoing flow was obtained. The - 14 cm3 gas aliquot was then hermetically sealed using stainless-steel pinch-off clamps closed using an electric driller (Pinti et al., 2017). Hot springs and fumaroles were sampled using a plastic funnel connected to the copper tube sampling systems using an armored 3/8" PVC tube. The fumarole gas pressure is equal or lower than atmospheric pressure and thus at the end of the copper tube a PVC tube is connected and plunged into a bottle of water, to avoid air entering from the back of the sampling system. Water samples are always taken at the weirbox at the exit of the silencer using a metal vessel (Fig. 2.2; Point B). Water is then rapidly transferred to 1-L Nalgene bottles which were washed previously with the same discarded geothermal water. L TV-GF is known to have carbonate-scaling problems (Flores-Armenta and Jaimes-Maldonado, 2001). Therefore, an inhibitor is usually injected by CFE to prevent obstruction of the wells such as L V-6 well. To verify whether inhibitor chemicals could have an effect on the carbon isotopie composition, a water sample from LV -6 well has been taken during the normal injection of inhibitor and after a 24-hour injection cessation. No significant changes on the
o
13C-C02 has been observed between the two samples within analytical uncertainty.2.3.2 Analytical methods
Geothermal gas samples contain others incondensable gases ( e.g. H2S, CHt, N2, Ar, Ne, He) and often condensate water that need to be separated from the C02 for isotopie anal y sis of C02. In laboratory, the first step is to extract the gas from the sample. In the following purification phase, a cryogenic separation is needed to remove the remnant water and the incondensable gases. A cryogenic liquid nitrogen and isopropyl dry ice mix method (Keeling, 1958) is used to recover a maximum of C02. After recovering a variable amount of C02 gas in a Pyrex glass vessel, isotopie composition of C and O were determined at the Geotop research center of Université du Québec à Montréal using an Isoprime 100 Dual Inlet Isotope Ratio Mass Spectrometer (IRMS). The samples were compared to a working C02 standard that has been normalized to the V-PDB scale using C02 evolved by the acidification of (at 25°C) LSVEC and NBS19 reference material as two anchors points (Coplen, 2006). The results are reported on the VPDB-LSVEC scale using the delta notation.
2.3.3 Assessment of the total method variability
To ensure that the sampling method produced reproducible isotopie analyses, a C02 stable isotope variability assessment was carried out, on steps from sampling through analysis. For this purpose, two wells were chosen for their different depths and position at the CP-GF. The CP-302 well is the second shallowest well in the field with a depth of 1324 m. The CP-346 well is one of the two deepest wells together
with CP-542, which are at an equal depth of 4000 m. Both wells have been sampled five times for C02 isotopie measurements using the same sampling methodology. Each sarnple was analyzed twice for its
ô
13C-C02 andô
180-C02 composition. Although a minimum of three samples is commonly used to assess the variability of a method, a maximum of only two analyses was possible due to the volume of the sampling tube. The highest variabilities from theô
13C-C02 andô
180-C02 measured in the same tube are respectively of ± 0.6 and ± 0.5 %0 (Table 2.A.1; Appendix). However, if results for all of the five sampi es from the same well are taken, then the variability increases to ± 0.8 %0 and ± 3.0 %0 for theô
13C-C02 andô
180-C02 respectively. The extraction, purification and analysis are assumed to induce the smallest variability, while the sampling may account for the rest of the variability measured from the five samples of the same well.The sample internai pressure, which was determined in the laboratory, is plotted against the C02 isotopie composition for samples from CP-GF and L TV-GF (see Figure 2.A.1 in Appendix and Table 2.A.l). Only part of the samples we obtained during the 2014-2016 campaigns is shown in Figure 2.A.l, because accurate pressure measurements were possible only late during the measurements. A linear regression between sample internai pressure and the
ô
180-C02 is calculated for the CP-GF samples. A minimum threshold of 2 bar is observed from the regression (Fig. 2.A.1 ). This threshold may reflect the lower amount of C02 that probably approaches the limit of detection of the IRMS. The resulting equation and coefficient ofdetermination (R2) are 2748.7 - 193.91(x) and 0.78 respectively. No correlation can be observed between the sample intemal pressure and the
ô
13C-C02 values (Fig. 2.A.1 ). Thus, it indicates that theô
180-C02 may be fractionated in function of the fluid pressure flowing through the copper tube. Therefore, for further geothermal gas sampling, we propose to close the downstream pinch-off clamp and let the sample equilibrated with the production line for 5 minutes. This would prevent any fractionation of ô180-C02 caused by pressure variation relative to the production well.T o full y understand the source of the oxygen fractionation, we also measured the ô180 of condensate water from agas sample and compared it to the ô180-C02. We consistently obtained values that are coherent with equilibrium between the two molecules at the laboratory temperature (Table 2.A.2). Therefore, the
ô
180-C02 variability might have been also caused by partial re-equilibrium between C02 and water at low temperature.The geothermal field sampled, the type of fluid collected, the year of sampling, 613C-C02 and 6180-C02 (with their analytical uncertainties) are reported in Table 2.1. The C02 stable isotopie compositions are reported using the delta notation in per mil (e.g.,
ô
13C= (
13C/12C)samp1e/(13Cf12C)s1d) -1 x 1000) and against VPDB (Coplen, 2011).Figure 2.3 reports the
ô
13C-C02 vs Ô180-C02 values measured in production wells, hot springs and in fumaroles, where the values in each field is discretely highlighted by ellipsoids of different colors which represents the total method variability around a mean value which is represented by the cross sign. Except for a few outliers, each sampled geothermal field has a unique and distinct isotopie signature of C and O of the C02 molecule. In this figure and in the following one, LosAzufres results from this study and from Pinti et al. (2013) will be considered as a whole. The CP-GF samples show C02 with a 613C-C02 ranging from -5.59 to -3.11 %0 (median value of -4.13%o) and 6180-C02 from -12.32 to + 1.57%o (median value of -4.2%0). The LA-GF fluids contain C with a 613C-C02 ranging from -9.79 to -6.60%0 (median value of -7.51%0) and oxygen with a 6180-C02 from -2.90 to +9.60%0 (median value of +4.62%0). The isotopie composition of C02 in the CP-GF and LA-GF falls mainly inside the canonical mantle 613C value range of -6 ±2%o (Javoy et al., 1986; Mason et al., 2017). Los Humeros C02 shows 613C-C02 ranging from -5.25 to -2.24%0 (median value of -3.29%0) and 6180-C02 from +3.09 to +6.85%0 (median value of +4.42%0 ). L TV-GF fluids shows a restricted range of 613C-C02 ranging from
-11.27 to -I0.28o/oo (median value of -10.63%0) and oxygen with a ô180C02 from -5.82 to +2.16%o (median value of -l.78%o) (Fig. 2.3; Table 2.1). The C isotopie composition of L TV-GF and LH-GF fluids show thus deviations from the C mantle value of -6 ±2o/oo, with lower and higher isotopie compositions, respectively.
In Figure 2.4 the ô13C-C02 values measured in the four geothermal fields of this study are compared to values reported in the literature, often during the first phases of activity of the field (Birkle et al., 2001; Birkle et al., 2006; Gonzalez-Partida et al., 1993; Janik et al., 1982; Portugal et al., 2002; Portugal et al., 1994; Tabaco et al., 1991; Truesdell et al., 1979). We can notice that except for LA-GF and L TV-GF, most of the measured C isotopie composition are within the canonical values of mantle C (-6±2%0; Javoy et al., 1986), indicating that this is the main source of carbon in the fields. lt can be observed that CP-GF and LH-GF have a C02 carbon isotopie composition slightly higher than those measured previously in these fields. This could be caused by the continuous exploitation of the fields and boiling processes, being 13C preferentially fractionated in the steam phase (Tabaco et al., 1991 ). However, the difference between initial values and those after 30-50 years of exploitation differ by less than l.5%o (Fig. 2.4), except for LA-GF. Here, a notable difference is observed where depleted C values down to -16.1 %o are reported in the literature (Birkle et al., 2001). However, the median value of the previous dataset of Birkle et al. (2001) is -8.1 %0 which is close to the median value of -7 .5%o of our dataset. These few lower values could indicate organic contamination of the samples
or that sedimentary C could have mixed with the dominant magmatic C component (Tabaco et al., 1991).
2.5 Discussion
2.5.1 Inter-field C and O isotopie variability
In Figure 2.3, variations of ô13C values are expected to be controlled by terrestrial C sources (mantle, carbonate and organic matter (sedimentary) carbon) and/or reactions with carbonates at lower temperatures (e.g., Tabaco et al., 1991; Mook et al., 1974; Javoy et al., 1986; Sano and Marty, 1995).
The ô180 should be controlled principally by the 180 exchange between steam and carbon dioxide ( e.g., Chiodini et al., 2000), which extent depends on the temperature at which this exchange proceeds ( e.g., Bottinga, 1969) and the initial 180 composition of both water and C02. A study of the 8180 measured in fumaroles and hot springs in several volcano-hydrothermal systems by Chiodini et al. (2000) has shown that 180 exchange between C02 and steam is fast enough in natural gas phases to allow rapid isotopie re-equilibration within a wide temperature range (100 -1000°C). As for most isotopie exchanges, the effect of fractionation decreases with increasing temperature, becoming practically negligible above the critical temperature of water ( e.g., Bottinga, 1969; Richet et al., 1977). In the following two sections, both the O and the C isotopie variability among the studied fields will be discussed.
2.5.2 The O isotopie variability
Figure 2.5 shows 8180 values of water in the studied GFs (data from Pinti et al., 2013; Pinti et al., 2017; Pinti et al., 2018; Nufiez-Hernandéz et al., 2018) plotted against the 8180 values of C02 from this study and recalculated by normalizing against VSMOW (Eqn. 2). There is a rough general trend indicating that the oxygen stable isotopie composition of the two phases are related and thus partial or total re-equilibration between the two phases occurs. The large scattering around a linear trend could be caused by the overlapping of other processes at depth, such as 180 exchange with silicates or carbonates (e.g., Clayton and Steiner, 1975; Hedenquist and Lowerstern, 1994 ). Most important for our discussion, this plot highlights the fact that each field has a distinct 8180 signature of water, particularly for CP and LA (Fig. 2.5). This initial water composition can explain partially the 8180-C02
distribution observed in Figure 2.3. lndeed, water from CP-GF is isotopically the lightest among the four fields with a median 8180-H20 value of -7.38%0 while water from LA-GF is the heaviest, with a median 8180-H20 value of -0.58%0. Since the equilibrium isotopie fractionation between 180 of water and of C02 depends on the temperature and the initial 180-water composition, then the lower composition of water of CP-GF is likely to explain the lower 8180-C02 composition observed in Figure 2.3, compared to that ofLA-GF. LH-GF and LTV-GF which show intermediate 8180-H20 median values of -3.19 and -2.97o/oo, respectively.
The initial o 180-H20 value of the L TV-GF (Fig. 2.5) eannot sol el y explain the o180-C02 observed in the field (Fig. 2.3). Indeed, the median o180-H20 ofLTV-GF is only 3%o lower than that of LA-GF, yet the differenee (~ 180) of the final o180-C02 among the two fields is more than 7%o (Fig. 2.3). This means that temperature
differences between the two fields or ineomplete re-equilibration of 180 between the C02 and H20 phase eould oeeur, to explain the relatively low o180-C02 ofLTV-GF (Fig. 2.2).
Chiodini et al. (2000), based on analyses of hot springs around the world, showed that the 180 exehange between steam and earbon dioxide in volcanie and hydrothermal gases is very fast, and thus isotopie equilibrium are attained in a hydrothermal system. Figure 2.6 shows the equilibrium in the oxygen isotope exehanges between C02 and H20, represented by the "per mil fraetionation" or "lOOOlna", whieh is ealculated as follows:
lOOOlna(C02-H20)
=
1000ln[(IOOO+o180-C02)/(IOOO+o180-H20)] (1)where the o180-C02 (vs VPDB; Table 2.1) ean be reealculated on the VSMOW seale as follows:
o180-C02 (VSMOW)
=
30.92 + 1.03092 x o180-C02 (VPDB)The per mil fraetionation is plotted against the temperature of the isotopie equilibrium, here ealculated as 1000/(T(°C) + 273.15°C), i.e. the inverse of the
temperature in kelvins. Chiodini et al. (2000) obtained a relationship that can be represented by a third-order polynomial equation:
lOOOlna(C02-H20)
=
-5.0103 + 19.271 x (103/T) -11.485 x (103/T)2 + 3.6664 x (103/T)3 (3)This equation slightly deviates from the theoretical one calculated by Richet et al. (1977) for the C02-H20 system. In Figure 2.6, we simulated with boxes the range of per mil fractionation we should obtain for each field (based on the measured 818 0-C02 and 8180-H20 range values for each field) at the expected temperature ranges at the Webre separator. Because present-day separation temperatures were not available from CFE for each well, we used temperature ranges from literature for LA-GF (Barragan et al., 2005), LH-GF (Arellano et al., 2003), LTV-GF (Barragan et al., 2010) and CP-GF (Nieva et al., 1982). The per mil fractionation simulated at these temperatures are close to the expected equilibration. Shift from the full
re-equilibration could be related to the initial 8180-H20 used. Indeed here we used measured values at the weirboxes, while these values should be corrected for
fractionation produced when the total discharge fluid is separated between the liquid phases and vapor ( e.g., Nieva et al., 1983; Barragan et al., 2005). Y et previous studies in those fields have shown that the differences between weirbox and separator 818 0-H20 values are of the order of 0.5-2%0, yet insufficient to explain the deviation from the full equilibration for our samples. Partial re-equilibration of C02 and H20 in the
copper tube samplers (Table 2.A.2) also cannot be excluded as a cause of the shift towards lower temperatures of re-equilibration in the diagram of Fig. 2.6, although a generalization of this phenomenon is difficult to demonstrate.
Finally, when we plot data from other fields, such as Larderello in Italy (Panichi et al., 1977), one can observe that full equilibration does not seem to be attained in geothermal wells. This suggests that the 180 variability observed in C02 from the different fields can be explained by the partial 180 exchange between steam and carbon dioxide at separation temperatures. These results indicate that the use of the C02-H20 geothermometer should be carefully evaluated when applied to geothermal well data (Panichi et al., 1977).
2.5.3 The C isotopie variability
Although the convective geothermal play (Moeck and Beardsmore, 2014) indicates that the Mexican fields should have a strong magmatic component, the C isotopie composition should have a canonical upper mantle value of -6 ± 2 %0 (Sano and Marty, 1995). Sorne physicochemical reactions ( e.g. carbonate precipitation, crustal assimilation or contamination, C02 dissolution and equilibrium with CI--4) (Gilfillan et al., 2009; Güleç and Hilton, 2016; Mason et al., 2017; Roulleau et al., 2013) can induce shifts in the C02-C isotopie composition.
The four distinct groups of isotopie compositions of C02 in Mexican fields (Fig. 2.3) can partly be explained by C sources and kinetics processes. The CP-GF
and LA-GF show ô13C-C02 values which are within the mantle carbon canonicat value of -6±2o/oo. Differences between the two fields will be discussed later in the discussion. However, the LH-GF shows ô13C-C02 which shift towards higher values up to 2.24±0.02%0, while the L TVGF is characterized by very low values down to
-11.27±0.01 %o.
The lower C isotopie compositions measured at L TV-GF can be explained by two different processes which will be investigate further: carbonate precipitation ( calcium carbonate scale deposition), which is a major problem in this field (Ocampo-Diaz and Rojas-Bribiesca, 2004; Tello-L6pez and Torres-Rodriguez, 2015); or mixing with an isotopically depleted source, i.e. organic matter in sediments ( <-20o/oo) (e.g., Javoy et al., 1986; Sano and Marty, 1995; Barry et al., 2014; Patemoster et al., 2017).
The first hypothesis suggests carbon isotope fractionation associated with calcite precipitation (Hoefs, 2015), as possible process of 13C depletion at L TV-GF. T o model the amount of C02 that has to precipitate as carbonates to shift an initial mantle C (with 613C of -6 to -8%0; Fig. 2.3) to the average L TV-GF ô 13C-C02 value of -10.72 %0, we used a simple open system fractionation equation (Gilfillan et al., 2009; Güleç and Hilton, 2016). The fractionation factor alpha (a) is determined using the relation developed by Bottinga (1969):
-0.8910(109) 8.557(106) -18.110(103)
=
T
3+
T2+
T
+8.270 (4)
Where the temperature T is calculated in kelvin units. Fractionation is assumed to follow a Rayleigh distillation ( open system). The equation is then:
613C-C0rmeasured + 1000
=
(613C-C02-mantle + lOOO)fCa-l)(5)
where f is the fraction of the residual C02 which did not undergo carbonate precipitation.
Results from Eqn. 5 suggest that 85-97% of the initial C02 in L TV -GF need to have undergone carbonate precipitation. The calculations were made considering an initial mantle value of -6%0 and well-head separation temperatures of 128-155°C; Barragan et al., 2010), which are well below the temperature range of L TV-GF reservoir (250-275°C; Tello-L6pez et Torres-Rodriguez, 2015). Utilization of these values is supported by the fact that L TV-GF fluids becomes supersaturated in CaC03 below temperatures of ca. 200-150°C (Tello-L6pez and Torres-Rodriguez, 2015). Scaling is likely produced when fluids rise and start to boil at lower temperatures than those in the reservoir (Ocampo-Diaz and Rojas-Bribiesca, 2004). If we assume the most depleted value for mantle C of -8%0, and the same well-head temperatures, then 67-88% of the initial amount of C02 is needed to reproduce the low ô13C composition
at L TV-GF fluids (Table 2.1; Fig. 2.3). Considering that the amount of C02 trapped by carbonates precipitation is commonly less than 25 % (Gilfillan et al., 2009; Güleç and Hilton, 2016), the extreme loss of C02 in the LTV-GF reservoir seems highly unlikely. Moreover, if carbonate precipitation occurs the COi/3He ratio should dramatically decrease from the initial value (Gilfillan et al., 2009), i.e. the mantle (2 x10⁹; Marty and Jambon, 1987). We did not measure C02 concentrations but in LTV C02 is relatively constant at 97-99 wto/o. 3He contents range from 1.79 to 5.69 x 10⁻¹¹ cm3STP/cm3. The corresponding Cüi/3He ratios should range from 1.72 and 5.49 x 10¹⁰, which is higher than the mantle value, suggesting that carbonate precipitation is not a viable process to explain the lower
ô
13C composition of LTV C02. These estimated C02!3He ratios, together with the lower ô 13C composition suggest a mixing with a 3He-depleted source such as organic C-rich sediments (Sano and Marty, 1995).Modem contamination with organic matter have been discarded to explain low
ô
13C-C02 values considering that L TV-GF is actually an extremely arid area and thus recharge water is likely depleted in organic matter (Birkle et al., 2016). L TV-GF fluids are considered to be a mixture of late Pleistocene meteoritic water and of non-evaporated seawater (Birkle et al., 2016). Hence, paleo-organic contamination can be modelled with a simple mixing equation:where OM and RW are orgarnc matter and recharge water, respectively. Measurements of the ~Be of the DOC (Dissolved Organic Carbon) in LTV-GF fluids (Pinti et al., 2018) show an average value of -27.8%0. Assuming this value for the organic matter and an average mantle ôBC-C02 of -6%o (Javoy et al., 1986), then Eqn. 6 suggests a 21.6% contribution of carbon from organic matter and of 78.4 % of mantle carbon.
L TV-GF low ô BC-C02 values could derive from a contamination of organic matter-rich oceanic sediments during Tertiary paleo-subduction events. C-bearing molecules would mostly be organic-rich sediments accumulated on top of the slab. The L TV-GF is part of the Santa Rosalia basin which is known to contain adakites of 23 to 13 Ma ago, linked to the subduction of the Farallon plate that formed the Comondu volcanic arc (Fig. 2.1; Ferrari et al., 2012). Adakites are produced by the melting of subducted young oceanic crust at high thermal regime (Aguill6n-Robles et al., 2001). Adakites are found all around the pacifie ring of fire in subduction context, notably in the Aleutian and the Cascadia where ôBC-C02 values as low as at LTV-GF have been observed (Mason et al., 2017).
To confirm this hypothesis, prox1es of sediment assimilation should be compared to the ô Be values. One is the C02!3He ratio, which is compatible with a mixing between mantle and sedimentary C (the latter having a COi/3He of 1010 to 1012; O'Nions and Oxburgh, 1988). Another is the helium isotopie ratio 3HefHe (normally reported as R, and normalized to the atmospheric ratio Ra= 1.384 x 10⁻⁶;
Craig and Lupton et al., 1976). lndeed, high 3HefHe ratios are an indication of the presence of mantle fluids which are enriched in 3He, compared to 4He, with R/Ra values as high as 8±1 in MORB sourced upper mantle (e.g., Graham, 2002). If there is sedimentary addition, the canonical upper mantle R/Ra value of 8 will be lowered by addition of radiogenic 4He which is normally produced by U and Th decay in sediments (e.g., Pinti and Marty, 1998).
In Figure 2.7, the Re/Ra values measured in the four geothermal fields (CP-GF, Pinti et al., 2018; LTV-GF, Pinti et al., 2018; LA-GF, Wen et al., 2018; LH-GF, Pinti et al., 2017) are plotted against the ô13C-C02 values measured in this study. Dashed lines are mixing hyperbolas (Langmuir et al., 1978) calculated for a mixture of mantle C and He (R/Ra
=
8±1 and ô13C-C02 of -6±2%0) and two distinct sedimentary sources: organic matter-rich sediment (R/Ra = 0.02 and ô13C-C02 of -20 to -25%0; Sano and Marty, 1995) and carbonates (R/Ra=
0.02 and ô13C-C02 of -2 to+
2%o; Pinti and Marty, 1998; Sano and Marty, 1995). The parameter "r" defines the degree of curvature between the two end-members, here the mantle and the two sedimentary sources. The helium and carbon signatures of the L TV -GF fluids is compatible with a mixing with organic-rich sediments, possibly to the addition of either slab- or crustal-derived carbon (e.g., Mason et al., 2017). Measured 87Sr/86Sr from LTV-GF fluids (0.7043, unpublished data) are consistent with either local granitic sources or subduction sediments ( approx. O. 7045) (Thirlwall et al., 1996).On the other hand, LH-GF fluids, which are characterized by ô13C values slightly higher than the mande carbon value (Fig. 2.3) may have undergone carbonate dissolution of the meta-carbonates composing the basement of the reservoir (Fig. 2.7), as suggested by Gonz.alez-Partida et al. (1993) and Peiffer et al. (2018). The occurrence of 87Sr/86Sr ratios higher than 0.709 measured in the fluids (Pinti et al., 2017) supports this hypothesis. Isotopie fractionation does not occur when passing from solid carbonates to dissolved C02• Thus, a simple binary mixing equation such as Eqn. ( 6) can be used to model the interaction of carbonates with the geothermal fluids. Therefore, using in Eqn. (6) the canonical 813C value of marine carbonates of 0±2 %0 (Sano and Marty, 1995) and a canonical mande 813C value of -6±2%0 (Javoy et al., 1986), the average LH-GF 813C-C02 value of -3.30 %0 requires a contribution of35 to 47% of carbonate Cinto the geothermal fluids of Los Humeros.
It is interesting to note that LH-GF, LA-GF and CP-GF show initial ô13C-C02 compatible with a mande source but different helium isotopie compositions which seems to not reflect the geodynamic context of each geothermal field. LA-GF contain a pure mande C and He source as those sourcing the MORBs {ô13C
= -7.5%0 and
Re/Ra= 7.9) mixed with a radiogenic helium source as observed in volcanic arcs
(R/Ra=
5.4 ± 1.9; Hilton et al., 2002). LH-GF fluids seem to have an initial ô13C and Re/Ra value compatible with MORB-like source. Now both fields are within the Trans-Mexican Volcanic Belt (Fig. 2.8) which is the surface expression of the subduction of the Cocos plate under central Mexico (Fig. 2.1; Peréz-Campo et al.,2008). It would be expected that mantle He shows isotopie composition similar to volcanic arcs, which is characterized by a 3He/4He ratio lower than a pure upper mantle signature of 8±1Ra (Hilton et al., 2002). The difference could be explained by the particular geometry of the slab under central Mexico. The plate plunges into the mantle near Mexico City (Fig. 2.8) almost vertically, which may explain that LH, which is at the northem border of the TMVB could receive almost direcdy lithospheric mande material feeding the field with mostly pure upper mande volatiles, including C02 and He (Fig. 2.7). LA is slightly northem than Mexico City (about 200
km west) on the vertical of the slab edge. Here, volatiles from both the lithospheric mande and the subducting slab could reach the field. The occurrence of a mostly pure He mande signal in LA is in agreement with recent findings of Wen et al. (2018) which shows, on the basis of Sr isotopie composition of fluids that MORB-like melts are feeding the field with heat and volatiles.
Most intriguing is the signature of the CP-GF fluids, which shows a pure mantle C signature but contain helium exclusively with an isotopie signature typical of volcanic arcs rather than from the upper mantle sourcing the MORBs (Fig. 2.7). Now CP is within a pull-apart basin corresponding to a continental extension with MORB-like melts at its base (Schmitt et al., 2013) and MORB-like 3