HAL Id: hal-01666267
https://hal.archives-ouvertes.fr/hal-01666267
Submitted on 5 Dec 2018
HAL is a multi-disciplinary open access
archive for the deposit and dissemination of
sci-entific research documents, whether they are
pub-lished or not. The documents may come from
teaching and research institutions in France or
abroad, or from public or private research centers.
L’archive ouverte pluridisciplinaire HAL, est
destinée au dépôt et à la diffusion de documents
scientifiques de niveau recherche, publiés ou non,
émanant des établissements d’enseignement et de
recherche français ou étrangers, des laboratoires
publics ou privés.
Decision support system for risk management in
complex project design
I. Deniaud, François Marmier, Didier Gourc
To cite this version:
I. Deniaud, François Marmier, Didier Gourc. Decision support system for risk management in complex
project design. ICPR 22 - 22nd International Conference on Production Research., Jul 2013, Iguassu
Falls, Brazil. �hal-01666267�
DECISION SUPPORT SYSTEM FOR RISK MANAGEMENT
IN COMPLEX PROJECT DESIGN
I. Deniaud1, F. Marmier2, D. Gourc2
1 Université de Strasbourg, BETA Laboratory, 61 av. de la Forêt Noire, 67085 Strasbourg Cedex, France 2 Université deToulouse, Mines Albi, Centre Génie Industriel, Route de Teillet, 81013 Albi Cedex 09, France
Abstract
This paper outlines how to make strategic decisions in NPD project according to risk. The complexity of the problems to be solved in NPD depends on both the nature of design problem solving and the difficulty of managing the project (activities, risks). The interactions between product subsystems in NPD often lead to conflicts requiring arbitration between alternative solutions. To give an overview of the links between activities to the Project Manager, we propose a joint process of design, project management and risk management. It takes into consideration the design activities and risk activities to generate a design project planning. During the project design, if different strategies can be used only for solving design problems, different others can help deal with the project risks. All of them lead to different possible scenarios. We present a decision tree to show the decisions steps and possible project scenarios. A generic decision support system is proposed. A case study of a satellite design project is developed to demonstrate the effectiveness of the proposition.
Keywords:
Design project, complex product, risk management, systems engineering.
1 INTRODUCTION
With rapidly changing markets and technologies, today companies are facing the same issue: to offer increasingly complex innovative products. Complexity is difficult to manage both at the product design [1], but also in the organization of the project design and process control. Thus, a growing number of companies must both manage the development of their standard products and launch innovative products continuously. To meet this requirement, they must master two forms of design process: exploration and exploitation [2]. The more we go towards an exploration project, the more important the innovation capacity of the company should be. It increases with uncertainty (and therefore risk) on design projects. The effects of risk are measured according to the criteria of classic project management such as cost and time. To manage this complexity we propose a model integrating the risk management in design projects.
This paper outlines strategic decisions making in NPD project according to risk. Firstly we characterize different design processes. Then we present different models used to manage design complexity. We show that Systems Engineering models reduce the complexity in product design. A multi-level system decomposition helps to evidence technical or organizational problem. We give a flow chart illustrating the processes leading to arbitration management in design project. To give an overview of the links between activities to the Project Manager, we propose a joint process of design, project management and risk management. A methodology is presented supported by a case study.
2 PROJECT RISK MANAGEMENT IN PRODUCT DESIGN
2.1 Product Design
In the literature different model types are proposed for exploitation or for exploration projects:
Design projects models based on exploitation develop a
variant of a known product, using in projects predefined existing skills. Design projects are based on pre-specified models: e.g. the single-step waterfall model which does not present the feed-back possibility [3]; Pahl and Beitz model [4] with iterations requiring costly and very long development time [5; 6]. The project is structured in a number of sequential and linear steps [7].
There are two types of Design models based on
exploration:
A. Concurrent models: e.g. Vee initial model [8] and spiral
models [9]. In this case many researchers think that design is a problem-solving process and the objective is to identify a satisfactory solution [10]. It consists of a set of hierarchical problems that are solved in a parallel manner. This is the case when interdependences between design parameters for the system to be designed are decoupled [11]. Here, an order exists that allows the successive definition of each parameter without ever having to modify those that were previously defined.
B. Emergent models: e.g. innovation models,
“chained-linked model” [12]. When the problem to be solved is new and complex, the problem formulation phase is critical. According to Suh [13] when a product to be designed is very complex, this sequential model no longer applies because system design parameters are strongly interdependent [11; 14]. This exploratory project is non-structured: the goal is constructed as the activity progresses during negotiations between participants.
The resolution of a design problem sometimes implies, to overcoming contradictions [15]. That means developing new concepts and new technologies in order to create a new framework and a new solution area. Emergent models are based on the dynamic system development method, and innovation-based processes presented in the next section.
Systems Engineering was developed to guarantee that the system matches real needs [16]. To control exploratory projects, tasks have to be parallelized and use different models (e.g. activity-based model and Vee system model). These models have the advantages of: (1) dividing a system into modules [17] distributed in different layers: from the system to the components (Figure 1a) [8]; (2) developing the solution, organizing the project into interrelated subprojects, often represented with the "V-cycle" (figure 1b); (3) transferring the design effort to the front of the design process. This implies that managers and designers become able to guarantee the performance of the design process and to anticipate or prevent major risks of future projects.
a)
b)
Figure 1:Vee cycle.
The nature of the interactions between subsystems often leads to a series of conflicts requiring arbitration. This arbitration process can lead to a redefinition of the initial functions, of the product initial requirements or even to a redesign of the organization (activity structure) of the project design. A design project implies strategic choices. Figure 2 illustrates the processes leading to arbitration or contradiction management [18]. At first, arbitration, where the actors use an existing knowledge base, implies that the solution is already known. Arbitration may thus lead to a compromise situation.
Applying this model means: (1) to verify requirements at different stages of the design process leading to a validated solution;(2) to identify and analyze in details the contradictions using systems engineering tools; (3) to overcome contradictions when they appear during the design project.
Figure 2:Exploratory design activity based model. Each design solution implies different risks that must be take into account in project management.
2.2 Project risk management
In the literature, the risk management methodologies refer to a standard process presenting the well-known steps: risk identification, risk evaluation and quantification, risk mitigation for treatment and/or impact minimization and risk monitoring [19], [20]. Tixier et al. propose a classification of sixty two existing approaches [21]. They sort methods as being deterministic and/or probabilistic, but also qualitative or quantitative. Several academic research works propose methods to complement the different phases of the global approaches, such as the optimisation of different criteria during the schedule or after the identification phase [22]. In parallel to these global approaches, several authors propose methodologies to manage the risk in projects. Gourc et al. propose a reading grid of the risk management approaches as follows [23]: the symptomatic approach and the analytic approach. The first group of approaches, called risk-uncertainty, is associated with approaches where project risk management is transformed into project uncertainty management [24] using the Monte Carlo simulation method [25]. The second approach family considers risk as an event that can affect the achievement of the project objectives [26]. "Risk can be defined as the combination of the probability of an event and its consequences" [27]. Risk is described as an event, which has occurrence characteristics and consequence characteristics on the project objectives (impact in the event of occurrence). Pingaud and Gourc [28] propose a project management approach based on a synchronised process of project schedule and risk management. Nguyen et al. propose Prorisk which can model and evaluate the impact of risks on the project cost and the schedule cost [29]. They define the concepts of risk scenario, treatment scenario and project scenario.
In the project management literature, two themes are well-known for their reference to the innovation and then for the omnipresence of risk: the project management of new product development (NPD) at an operational level and the portfolio management of NPD at a tactical level. A first definition of portfolio management is given in 1999 [30]: a dynamic decision-making process that allows the project lists to be always updated. Its construction is mainly difficult due to the omnipresence of the evaluation of the balance benefits versus risks. One of the problems is to be able to evaluate and compare several possible portfolios with a global risk indicator. Risks are also intrinsic in new product development (NPD) in all industries [31]. Thus firms need to take initiatives to reduce risks that are related to NPD. The risk management framework should integrate the three most important risk factors that affect NPD performance: technology, marketing, and organization [32]. In NPD management, decision-makers have to choose
exclusively one orientation as strategy development according to a global risk level tolerance. As an answer, decision trees (DT) are regularly used in the literature on decision [33]. It makes it possible to find optimal solution to short time dynamic decision problems [34]. Based on decision variables, decision tree allows managers to choose one way and to react within this way in front of events. To increase the efficiency of innovative the link between the selection of innovative technological solution and the modification the project structures has to be made. There is no tools helping the project manager evaluate the solution of the project design problem and its consequences on (1) the planning of the duration of a design project, (2) the risks and their associated treatment strategies.
3 PROPOSED DEVELOPMENT
In this work, we focus on in the decision making process in design project management and risk management by analysing the consequences of the risk “as an event” in the design project. As observed in this literature review, little account is taken of risk and the strategies to deal with it regarding their repercussions on design project. Our objective is to propose a complete framework helping decision-makers to decide innovation and risk prevention strategy.
3.1 Hypotheses
The proposed model is based on three main hypotheses. -Risk integration into the project management is done regarding the duration and the cost criteria.
-The resource aspects such as the availability of skills are not considered for the moment in the model.
-When the decision of treatment strategy and technological solution has to be taken, characteristic relative to the risks are known. This work does not aim at developing a tool which eases the data-gathering.
At any time, the objectives of the model are (1) to analyse the possible scenarios, (2) to evaluate the global risk level, i.e. the global risk level represents the chance, for the project, to satisfy commitments, (3) to select the best treatment strategies.
3.2 Formalization of the decision process in design project
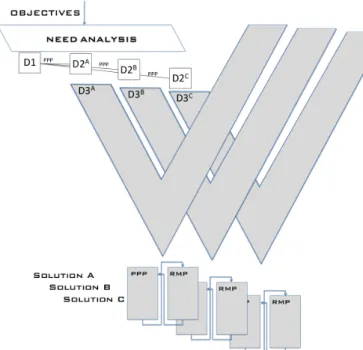
At the first step of the Vee-cycle, the need is analyzed. Different technical solutions are possible answers to the same functional need. The first decision at the end of the need analysis is to select the solution that will be developed during the design project. This decision is represented by the square D1 in the illustration presented in Figure 3. Several outputs are most often the time possible. In the Figure 3, three technical solutions (A to C) are possible.
Figure 3: Link between the V cycle, the decision tree and the synchronized process.
For each one of these solutions, it is possible to draw up a planning using the Project Planning Process (noted PPP) of the synchronized process described in [28]. Based on the planning the Project Manager (PM) has to organize the treatment of the risks over the design project. In that way, the decision, noted D2(A to C), consists in deciding the preventive risk treatment strategy in the project for the chosen technical solution. The Risk Management Process (RMP) is performed to identify the risk treatment and the PPP is developed a second time to plan the risk treatment tasks as well as to integrate others modifications of the planning. These two decisions are made in the preparation phase of the project.
The PM has also to plan the possible project development. In that way the chance node E characterizes the possible occurrence of risks. In front of each possible set of occurrences, D3(A to C) represents the decision of corrective strategy that could be carried on during the whole design project. D3 is planned during the preparation phase in order to meet risk occurrence during the project running phase. D3 supposes to reprocess the RMP and the PPP as well as to integrate new information and to obtain the final planning.
The decision tree, in Figure 4, gives a complementary view of the succession of decisions. The example concerns the choice of the technical solution A in D1. The PPP is then developed. The second decision (D2A) concerns the preventive risk treatment strategy. For all decision, the RMP has to be developed followed by a second cycle of the PPP (PPP’). Then, in front of all possible sets of risk occurrence, the last decision (D3A) concerns the corrective risk treatment strategy. D3A gives a planned and global
vision of all the possible corrective risk treatments that will be carried out over the whole duration of the design project. A second cycle of the RMP and a third cycle of the PPP are therefore processed (RMP’ & PPP”).
Figure 4: Decision tree in design project A.
3.3 Data
Pts (ts=0,...,TS) is a Project associated to a particular
technological solution ts, TS being the number of possible technological solutions and then potential projects. Each Pts is described by its tasks T
tts (t=1... Tts), Tts being
the number of project tasks of Pts. The planning process gives an initial planning Pits that does not integrate any risks. A project is also described by its set ERts of identified
risks Rits (i=1...nts), nts being the number of identified risks
in Pts. Each Rits is characterised via the risks management
process. A risk Rits is also characterized by its period of
occurrence, i.e. the tasks during which the risk can occur. It has a probability proba(Rits) (the probability that the event
related to Rits occurs) and impacts in costs CI(Rits) and/or
in duration DI(Rits) on a task. This task can be different
from the period of occurrence. These probability and impact are also called initial probability and initial impact. The initial impact allows consideration of the fact that the task is running in a graceful degradation.
A risk scenario ScRsts corresponds to a combination of the
risks that are considered as occurring during a project Pts. It has a probability proba(ScRsts).
!"#$%(!"#!!") = !"#$% !! !" !" ( ! ! !" ∈ !"# !!" ) 1 − !"#$% !!!" !" !!!" ∉ !"#!!" ! !!! (1)
Each risk can be treated in various ways that can be preventive, corrective or a combination of several actions. A risk Rits can be associated to one or more treatment
strategies StTijts (j=1...mts), mts being the number of
identified strategies for Rits. A treatment strategy StTijts
groups a set of treatment actions Aijα (α = 1...a) to avoid or
reduce the risk Rits, a being the number of identified
treatment actions. A treatment action can be materialized by a task to achieve and it can introduce modification to the WBS.
A treatment strategy is a preventive strategy if it contains at least a preventive treatment action. Otherwise, it is a corrective strategy. If the strategy consists in running no action at all, it is noted as being an empty set such as Ø (i.e. graceful degradation).
The treatment actions can be common to several risk treatment strategies. The set of all the identified StTijts for a
risk Rits is written StRits.
Then StRits = (Ø,StTi1ts,..,StTijts,..,StTimts) and
Card(StRits)=mts+1.
A treatment scenario ScTdts (d=1...Dts) corresponds to a
combination of the treatment strategies chosen to deal with the different risks of Pts. The set of treatment scenarios is given by: E!"#= !!!!StR!. For each Pts, EScTts may contain
a set of preventive treatment scenarios EScTprevts and
corrective treatment scenarios EScTcorrects.
The proba(Rits|StTijts) is the probability that the event
related to Rits occurs knowing that StTijts (preventive
strategy) has been done. This probability, as well as the impacts CI(Rits|StTijts) and DI(Rits|StTijts), are then qualified
as “reduced”.
A project scenario ScPpts (p=1...P) is defined as being a
possible project achievement that is built with a risk scenario and treatment scenario (ScPpts=<Pits, ScRsts,
ScTdts>). The set of project scenarios ESts is obtained by
combining the set of risk scenario and the set of treatment scenario.
proba(ScPpts) is the probability of a given ScPpts. It takes
into account (2) the probability of the occurring risks (Rits∈
ScRsts), (3) the probability that several risks does not occur
(Rits∉ ScRsts), (4) the probability of the occurring risks (Rits
∈ ScRsts) knowing that a treatment strategy is developed
(StTijts∈ ScTdts) (5) the probability that Rits does not occur
(Rits∉ ScRsts) knowing that a preventive strategy has been
processed and the initial probability has been modified
(StTijts∈ ScTdts). !"#$% !"#!!" = !"#$% !!!" (2) 1 − !"#$% !!!" 3 !"#$% !!!"!"#!"!" (4) 1 − !"#$% !!!"!"#!"!" (5) !!!"!!"# ! !",!"# !"!"!!"#!!" !,!
The cost of a project scenario is noticed C(ScPpts). It
includes the cost of the Tts tasks that constitute the initial planning of the project, the ScRsts and the chosen ScTpts
and (6) The Global Cost GCinitial(Rits) of the occurring risks
that are not treated by the treatment strategies. It includes the cost impact that is composed by a fixed part of the total cost (materials, tools, parts, etc.) and by an indirect cost that depends on the action duration, through the Delay Impact, and the actors charge. (7) The reduced global cost impact GCreduced(Rits) that is obtained taking into account
the different strategies StTijts applied to treat Rits and its
reduced repercussions on the project cost and duration. (8) The cost of the treatment strategies StTijts that is
determined by the cost of the action is composed by a direct cost (materials, tools, etc.) and by an indirect cost that depends on the action duration and on the actors.
! !"#!!" = !(!!!") ! !!! + !"!"!#!$% ! !!" (6) !"!"#$%"# ! !!" !"#!"!" 7 ! !"#!"!"∈!"#!!" !!"!" !" (8) !!!!"#!!" !,!
Each ScPpts can be characterized by a criticity Cr(ScPpts).
This criticity measure is based on its probability of occurrence proba(ScPpts), and a duration and a cost
metrics of the project scenario respectively αpts and βpts:
∝!!" = !"(!"#! !") !"# (!"(!"#!!")) and β! !"= !"(!"#!!") !"# (!"(!"#!!")) (p =1,…,P), (ts=0,...,TS) (9) then αpts, βpts ∈ [0,1].
Where CI(ScPpts) and DI(ScPpts) are respectively the
distance between the Cost and Duration Impacts and the budget and duration thresholds defined in the contractual agreement of the project. max(CI(ScPpts)) and
max(CI(ScPpts)) the distance of the costly and longest
project scenario possible over the whole design project. The global impact, weighted and normalised,
Impact(ScPpts) is then obtained through the following
formula:
Impact(ScPpts)=q x αpts + q’ x βpts (10)
Where q and q′ (respecting q + q′ = 1) are two coefficients that are chosen by the project manager in accordance with the importance of the duration relatively to the cost. Then, ∀p, ∀!", Cr(ScPpts) = proba(ScPpts) × impact(ScPpts)
(11)
3.4 Objectives
Taking decisions in the choice of a technological solution to reach the functional needs is a multicriteria problem. When the project manager makes the decision, the number of criteria used to evaluate the proposal is often reduced to the main ones: the cost, which is a sensitive
and finite resource and the duration, which traditionally is a matter of contractual commitment.
4 RESOLUTION APPROACH
In the preparation phase of a project, the technical orientations and the way of managing risks have to be chosen. It has to be done both for the planning and for the potential to react in front of an event during the running phase. Therefore, our method includes input data provided by the schedule process (management team) and from the risk management process;
The body of the approach is composed of two main phases: (a) the construction of the Decision Tree (DT), from the first decision node to the leaves, (b) the resolution of the DT in a backward way.
(a) The construction of the DT
The generation of the DT consists in building all the possible project scenarios and their evaluations for each technological solution studied. The project scenarios are the leaves of the tree. An initial schedule for each technical solution is generated, without integrating the notions of risk and risk treatment. Depending on the difference between the technical solutions, plannings can be more or less different from each others.
It is then necessary to calculate the different risks and treatment scenarios. These scenarios allow the set of the project scenarios to be constructed. Finally, when the project scenarios are known it is possible to obtain their durations and costs. The approach called ProRisk proposed in [29] is then used to generate ESts. The probability calculation method for each project scenario differs, depending on whether the project scenarios contain a treatment strategy or not. For each project scenario, the calculation the probability, the cost and the duration take into account potential modifications induced by the achievement of treatment strategies at the schedule level. Once the initial schedules adapted, the project scenario duration is computed using the PERT method and the earliest starting dates.
(b) The resolution of the DT
The resolution in the backward way consists in studying the effects of the different decisions from the leaves to the root of the tree (i.e. from D3 to D1 in Fig 4). The use of the knowledge of the tree makes it possible to become proactive.
Step (1) consists in finding for each branch of the DT, the best D3 faced to each ScRsts. They are selected in order to
avoid scenarios that would not be possible in the reality. D3 is made by choosing the corrective strategies that minimize Cr
(
ScPpts) for all the leaves of the tree.Step (2) D2 consists in deciding the preventive treatment strategy that is the most adequate for each technical solution. It is made for each studied design project knowing the best D3 made for all the branches. D2 consists in avoiding the worst possible cases (project scenarios) as defined by the Savage’s criterion often used in decision-making theory [35]. D2 is made by choosing the preventive strategies that minimize Crmax
(
ScPpts |ScTprevts), ∀ tsknowing the selections realized in D3
Step (3) D1 is the selection of the best technical solution based on its design project. The project management team wants to maximize the chance of meeting the commitments. D1 consists in selecting the technical solution that maximizes the number of possible ScPpts.
respecting the contracted duration and cost.
5 A SATELLITE DESIGN PROJECT BASED CASE STUDY
5.1 Presentation of the satellite design project
The case study, developed here to illustrate this research work, considered the development of a small satellite for a scientific mission, based on different platform. The platform would carry out a predetermined useful load of scientific / technological instruments. Two technological solutions can potentially meet this need: (A) a classical one using ergol liquid for its propulsion to reach its final orbit consecutive to its launch. (B) an innovative solution, fully electrical with the motor using xenon gas ionised and accelerated with the electrical energy provided by two photovoltaic panels. The second solution allows gaining the load of the ergols and of the associated structure: about half of the weigh of the final satellite. Thanks to this, it provides for lighter satellites for the same capacity. Therefore, the cost of the launch can be divided by up to two since two satellites can be launched with the same booster rocket. The inconvenient is the six months duration necessary to reach its final orbits due to the low power.
The selected solution would go through the different phases of the Vee-cycle. Table 1 presents the phases of the projects for both solutions.
Table 1: Phases of the two projects
General design tasks Solution A Solution B Time Cost Time Cost T1 Need analysis 2 2 2 2 T2 Requirement specification 3 2 3 2 T3 Functional architecture design 2 3 2 3 T4 Physical architecture design 2 2 2 2 T5 Detailed design 3 3 4 4 T6 Production stage 4 4 4 4 T7 Test 3 5 3 5 T8 Integration 2 4 3 4 T9 Verification 2 3 2 3 T10 Validation 1 1 1 1 T11 Flight 2 8 4 4 Total 26 37 30 34
The phase durations are presented in Time Unit (TU) with a fixed rate and their costs in Monetary Unit (MU). Antagonist requirements complicate the project. Per example the need of a high onboard power (>100 W), a low satellite mass (<120 kg), a low volume (<1m3), a life time (>2 years)…
An associated provision for risks makes the contractual commitment for this part of the global satellite project of 37 TU and 44 MU whatever the solution retained. Different risks were identified during the project (Table 2).
Table 2: Risks in the 2 versions of the project Risk Version of
the project Occurrence probability Occurrence period Impact Strategies (c: corrective, p: preventive) TU/MU
R1 Non accepted component A 0.1 T5 T5+2 / 2 StT11A(c)
B 0.8 T5+3 / 2 StT11B(p), StT12B(c)
R2 Difficulties of communication A 0.05 T5 T5+4 / 4 StT21A(p), StT21A(c)
B 0.3 T5+4 / 4 StT21B(p), StT22B(c)
R3 Lateness of material reception B 0.2 T6 T6+2 / 10 StT31A(p)
R4 Failure of a component or
software
A 0.25 T7 ∞ / ∞ StT41A(p), StT42A(c)
B 0.35 ∞ / ∞ StT41B(p), StT42B(c)
Their associated cost is a fixed cost that is added to the one based on the new task duration. Possible treatment strategies characterize them (Table 3). The impacts of one risk are judged as ∞ since the costs and delays will continually increase until an action is decided. NC (Not Changed) means that the strategy does not modify the impact of the risk. As an example, the risk R4, expresses the anomaly observed during the material integration on the satellite (error of wiring, systems presenting default...).
R4 is relatively probable since all the failures are recorded.
If such a risk occurs, the production is immediately stopped until a strategy is implemented. Then two strategies are possible in both versions of the project: a preventive one and a corrective one. StT41A and StT41B, consists in
carefully check critical material at the subcontractor plant by participating to the reviews, auditing etc. If it did not suppress the risks, it reduced their probability of occurrence by 10%. The cost of these actions is estimated at 2 MU for an associated duration that is not located on the critical path. StT42A and StT42B aims to modify the
material or the software when problems are observed. Such a strategy costs 1 MU and makes the satellite unavailable for 1 TU. If (R4) occurs even if a preventive
strategy has been carried out, it is still possible to develop the corrective strategy. However, only its duration will be taken into account, since the cost will be supported by the suppliers.
Table 3: Available risk treatment strategies Strategies Reduced probability (if preventive) Treatme nt action Reduced impact TU/Mu TU/Mu StT11A 0.5 / 0.5 T5+0.5 / 0.5 StT11B 0.1 2 / 1 NC StT12B 0.5 / 0.5 T5+0.5 / 0.5 StT21A 0.01 0 / 2 NC StT22A 1 / 1 0 / 2 StT21B 0.05 0 / 2 NC StT22B 1 / 1 0 / 2 StT31A 0.01 0 / 3 NC StT41A 0.1 0 / 4 NC StT42A 1 / 2 T7+1 / 1 StT41B 0.05 0 / 4 NC StT42B 1 / 2 T7+1 / 1
5.2 Results and discussion
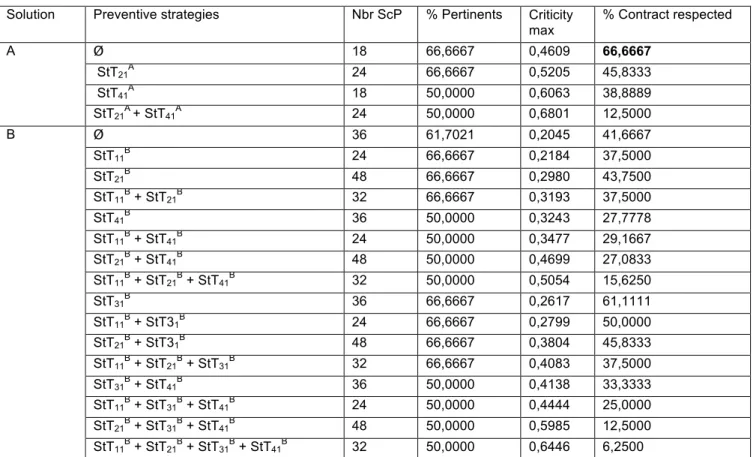
Table 4 presents the results obtained with this approach. The first column shows the different technical solutions. The second column gives the possible preventive strategies. Ø means that the preventive strategy consists in undertaking no action. The third column presents the number of project scenarios containing the previously mentioned preventive strategies. The column entitled "% Pertinents" refers to the percentage of pertinent project scenarios. Are considered as non-pertinent scenarios, the scenarios in which one or more risks occurred, stopping the project without any corrective strategies despite the presence of possible preventive strategies. We consider that corrective strategies should have been applied to that case. The next column presents the maximal criticity among the pertinent scenarios. Still, among the pertinent scenarios, the last column shows the percentage of scenarios that respect the contractual commitments. The
variant that maximizes the project scenario number in the zone of agreement is presented in bold in the last column of Table 4. This result means that by choosing the solution A and by applying no preventive treatment strategy, 66% of the pertinent project scenario respects the contractual commitments. Based on these results, the recommendation to the project manager would be simple: choose solution A and apply no preventive strategy. The weight of the different criteria could influence the results and an expertise is required for the selection of the used data.
The case study is voluntarily simplified for the sake of the demonstration. The approach is flexible since it can be used in different context.
Table 4: The results of our approach
Solution Preventive strategies Nbr ScP % Pertinents Criticity max % Contract respected A Ø 18 66,6667 0,4609 66,6667 StT21A 24 66,6667 0,5205 45,8333 StT41A 18 50,0000 0,6063 38,8889 StT21A+ StT41A 24 50,0000 0,6801 12,5000 B Ø 36 61,7021 0,2045 41,6667 StT11B 24 66,6667 0,2184 37,5000 StT21B 48 66,6667 0,2980 43,7500 StT11B + StT21B 32 66,6667 0,3193 37,5000 StT41B 36 50,0000 0,3243 27,7778 StT11B + StT41B 24 50,0000 0,3477 29,1667 StT21B + StT41B 48 50,0000 0,4699 27,0833 StT11B + StT21B + StT41B 32 50,0000 0,5054 15,6250 StT31B 36 66,6667 0,2617 61,1111 StT11B + StT31B 24 66,6667 0,2799 50,0000 StT21B + StT31B 48 66,6667 0,3804 45,8333 StT11B + StT21B + StT31B 32 66,6667 0,4083 37,5000 StT31B + StT41B 36 50,0000 0,4138 33,3333 StT11B + StT31B + StT41B 24 50,0000 0,4444 25,0000 StT21B + StT31B + StT41B 48 50,0000 0,5985 12,5000 StT11B + StT21B + StT31B + StT41B 32 50,0000 0,6446 6,2500
6 CONCLUSIONS AND PERSPECTIVES
In NPD the interaction between the subsystems of the product often leads to conflicts requiring arbitration between alternative solutions. To choose the best solution to develop and the best-associated risk treatment strategy in the preparation phase of a project is often tricky. Especially when the project should deliver a product presenting technological innovation. If the benefit of such a solution is easy to qualitatively evaluate, each possible solution potentially developed through the design project generates different plannings and different costs and durations but also different risk levels. To estimate the risk level for each project variant, we propose an approach to model and evaluate the impact of risks on the project cost and the schedule cost. This approach uses the synchronized process principle and integrates the repercussion of the project structure modifications on risks and the global risk level. We use the concepts of risk scenario, treatment scenario and project scenario to characterize and evaluate the project solutions. We illustrate the principles of our approach through a case study from the aerospace industry. This methodology analyses the possible scenarios, evaluates the global risk level and selects the best treatment scenarios at any time. An estimate of the global risk level of each solution can be made and gives a vision of the possible scenarios: from the least to the most probable, from the most disastrous to the most optimistic! A software tool has been developed (Java platform). The main perspectives for this research work will be to examine the influence of previously occurring risks on the probability scenarios, but also to integrate human resources constraints into the model, as well as the limiting availability that can be shared over several projects or skill, since particular actors can be assigned/required for specific tasks.
7 REFERENCES
[1] Hobday, M., 1998, Product complexity, innovation and industrial organisation, Research Policy, 26, 689-710.
[2] March J., 1991, Exploration and exploitation in organizational learning, Organization Science, 2(1), 71-87.
[3] Royce W., 1970, Managing the Development of Large Software Systems: Concepts and Techniques, Proceedings of IEEE WESCON, 26, 1–9.
[4] Pahl G., Beitz W., Feldhusen J., Grote K.H., 2007, Engineering Design, A Systematic Approach, 3rd Edition, Springer,.
[5] Anand G., Kodali R., 2008, Development of a conceptual framework for lean new product development process, International Journal of Product Development, 6(2), 190–224.
[6] Biazzo S., 2009, Flexibility, structuration, and simultaneity in new product development, The Journal of Product Innovation Management, 26(3), 336–353.
[7] Sanchez, R., Mahoney, J.,1996. Modularity, Flexibility, and Knowledge Management in Product and Organization Design, Strategic Management Journal 17, 63-76.
[8] Forsberg, K. and H. Mooz,1991, The Relationship of System Engineering to the Project Cycle, INCOSE, 57-65.
[9] Boehm B.W., 1988, A spiral Model of Software développement. Tutorial : Software Engineering Project Management, Washington D.C., IEEE Computer Society Press, 128-142.
[10] H. A. Simon, The science of the artificial, MIT Press, Cambridge, 1969.
[11] Suh N. P., 2005, Complexity in Engineering, CIRP Annals, Manufacturing Technology, 54(2), 46-63. [12] Kline, S.J. & Rosenberg, N., 1986, An Overview of
Innovation, The Positive sum strategy: harnessing technology for economic growth, R. Landau & N. Rosenberg (ed.), National Academies Press, Washington, D.C., 275–307.
[13] Suh N. P., 1990, The Principles of Design, Oxford University Press, New York.
[14] Nightingale P., 2000, The product-process-organisation relationship in complex developpement projects », Research Policy, 29, 913-930.
[15] Altshuller G.S., 1984, Creativity as an Exact Science: The Theory of the Solution of Inventive Problems, New York: Gordon and Breach Publishers.
[16] Liu T., 2000, Creativity or novelty? : Cognitive-computational versus Social-cultural, Design Studies, 1(3), 261–276.
[17] Ulrich, K-T., Eppinger, S-D., 2000, Product Design and Development, New York, McGraw-Hill.
[18] Belleval C., Deniaud I., Lerch C. 2010, A model for the management of design project issues: The case of the microsatellites design, International Journal of Design and Innovation Research, 5(1).
[19] BSI, 2000. BS 6079-3: Project management – guide to the management of business related project related.
[20] ISO31000, 2009. International Standards for Business, Risk management - Principles and guidelines.
[21] Tixier, J., Dusserre, G., Salvi, O. and Gaston, D., 2002. Review of 62 risk analysis methodologies of industrial plants, Journal of Loss Prevention in the Process Industries 15(4), 291–303.
[22] Kiliç, M., Ulusoy, G. and Serifoglu, F. S., 2008. A bi-objective genetic algorithm approach to risk mitigation in project scheduling, International Journal of Production Economics 112(1), 202–216.
[23] Gourc, D., 2006. Towards a general risk model for piloting goods and service related activities. HDR, INP Toulouse, France.
[24] Ward, S. and Chapman, C., 2003. Transforming project risk management into project uncertainty management, International Journal of Project Management 21(2), 97–105.
[25] Kalos, M. H. and Whitlock, P. A., 2008. Monte carlo methods, Wiley-VCH.
[26] Carter, B., Hancock, T., Morin, J. and Robin, N., 1996. Introducing RISKMAN: the European project risk management methodology, The Stationery Office.
[27] ISO-Guide73, 2002. Risk management vocabulary: guidelines for use in standards, Technical report. [28] Pingaud, H. and Gourc, D., 2003. Approach of
controlling an industrial project by the risk analysis, 5e Congrès de Génie Industriel, Canada.
[29] Nguyen, T., Marmier, F. and Gourc, D., 2010. A decision-making tool to maximize chances of meeting project commitments, International Journal of Production
[30] Cooper, R. G., Edgett, S. J. and Kleinschmidt, E. J., 1999. New product portfolio management: Practices and performance, Journal of Product Innovation Management 16(4), 333–351.
[31] Kwak, Y. H. and LaPlace, K. S., 2005. Examining risk tolerance in project-driven organization, Technovation 25(6), 691–695.
[32] Doering, D. S. and Parayre, R., 2000. Identification and assessment of emerging technologies, Wharton on Emerging Technologies, john wiley &sons edn, New York.
[33] Chiu, Y., Chen, B., Shyu, J. Z. and Tzeng, G., 2006. An evaluation model of new product launch strategy, Technovation 26(11), 1244–1252.
[34] Clemen, R. T., 1997. Making Hard Decisions: An Introduction to Decision Analysis, 2edn, Duxbury. [35] Petar, J., 1999. Application of sensitivity analysis in
investment project evaluation under uncertainty and risk, International Journal of Project Management 17(4), 217–222.
![Figure 2 illustrates the processes leading to arbitration or contradiction management [18]](https://thumb-eu.123doks.com/thumbv2/123doknet/11540902.295893/3.892.111.402.445.876/figure-illustrates-processes-leading-arbitration-contradiction-management.webp)