HAL Id: hal-01833332
https://hal.archives-ouvertes.fr/hal-01833332
Submitted on 13 Jul 2018
HAL is a multi-disciplinary open access
archive for the deposit and dissemination of
sci-entific research documents, whether they are
pub-lished or not. The documents may come from
teaching and research institutions in France or
abroad, or from public or private research centers.
L’archive ouverte pluridisciplinaire HAL, est
destinée au dépôt et à la diffusion de documents
scientifiques de niveau recherche, publiés ou non,
émanant des établissements d’enseignement et de
recherche français ou étrangers, des laboratoires
publics ou privés.
Vincent Portero, Ronald Wilders, Simona Casini, Flavien Charpentier, Arie
O. Verkerk, Carol Ann Remme
To cite this version:
Vincent Portero, Ronald Wilders, Simona Casini, Flavien Charpentier, Arie O. Verkerk, et al.. KV4.3
Expression Modulates NaV1.5 Sodium Current. Frontiers in Physiology, Frontiers, 2018, 9, pp.178.
�10.3389/fphys.2018.00178�. �hal-01833332�
Edited by: Marcel van der Heyden, University Medical Center Utrecht, Netherlands Reviewed by: Anthony Varghese, University of Wisconsin–River Falls, United States Ricardo Caballero, Complutense University of Madrid, Spain Susanne Kämmerer, Institut für Pharmakologie und Toxikologie, Technische Universität Dresden, Germany *Correspondence: Carol Ann Remme [email protected]
†
These authors have contributed equally to this work.
Specialty section: This article was submitted to Cardiac Electrophysiology, a section of the journal Frontiers in Physiology Received: 06 December 2017 Accepted: 20 February 2018 Published: 12 March 2018 Citation: Portero V, Wilders R, Casini S, Charpentier F, Verkerk AO and Remme CA (2018) KV4.3 Expression
Modulates NaV1.5 Sodium Current.
Front. Physiol. 9:178. doi: 10.3389/fphys.2018.00178
K
V
4.3 Expression Modulates Na
V
1.5
Sodium Current
Vincent Portero1, Ronald Wilders2, Simona Casini1, Flavien Charpentier3,
Arie O. Verkerk1,2†and Carol Ann Remme1*†
1Department of Experimental Cardiology, Academic Medical Center, Amsterdam, Netherlands,2Department of Medical
Biology, Academic Medical Center, Amsterdam, Netherlands,3L’Institut du Thorax, INSERM, CNRS, Université de Nantes,
Nantes, France
In cardiomyocytes, the voltage-gated transient outward potassium current (Ito) is
responsible for the phase-1 repolarization of the action potential (AP). Gain-of-function mutations in KCND3, the gene encoding the Ito carrying KV4.3 channel, have been
associated with Brugada syndrome (BrS). While the role of Ito in the pro-arrhythmic
mechanism of BrS has been debated, recent studies have suggested that an increased Ito may directly affect cardiac conduction. However, the effects of an increased Ito
on AP upstroke velocity or sodium current at the cellular level remain unknown. We here investigated the consequences of KV4.3 overexpression on NaV1.5 current
and consequent sodium channel availability. We found that overexpression of KV4.3
protein in HEK293 cells stably expressing NaV1.5 (HEK293-NaV1.5 cells) significantly
reduced NaV1.5 current density without affecting its kinetic properties. In addition, KV4.3
overexpression decreased AP upstroke velocity in HEK293-NaV1.5 cells, as measured
with the alternating voltage/current clamp technique. These effects of KV4.3 could
not be explained by alterations in total NaV1.5 protein expression. Using computer
simulations employing a multicellular in silico model, we furthermore demonstrate that the experimentally observed increase in KV4.3 current and concurrent decrease in NaV1.5
current may result in a loss of conduction, underlining the potential functional relevance of our findings. This study gives the first proof of concept that KV4.3 directly impacts on
NaV1.5 current. Future studies employing appropriate disease models should explore the
potential electrophysiological implications in (patho)physiological conditions, including BrS associated with KCND3 gain-of-function mutations.
Keywords: transient outward current, sodium current, channels, action potential, myocyte, arrhythmias, computer simulation
INTRODUCTION
The cardiac sodium current (INa), generated by the SCN5A-encoded voltage-gated Na+ channel
(NaV1.5) (Gellens et al., 1992), is responsible for the initial fast upstroke of the cardiac action
potential (AP). It determines excitability of myocardial cells and ensures proper conduction of the electrical impulse within the heart. Consequently, NaV1.5 channel dysfunction may lead to
conduction slowing, ventricular arrhythmias, and sudden cardiac death. In particular, SCN5A mutations leading to loss of sodium channel function are associated with isolated (progressive) conduction slowing or block (Schott et al., 1999), sick sinus syndrome (Benson et al., 2003), and Brugada syndrome (BrS) (Chen et al., 1998; Crotti et al., 2012; Le Scouarnec et al., 2015).
In cardiomyocytes, the voltage-gated transient outward K+
current (Ito) is responsible for the phase-1 repolarization of the
cardiac AP and thereby contributes to the refractory period and inotropic state of the myocardium. In human, Ito is generated
by the KV4.3 channel, which is encoded by the gene KCND3
(Niwa and Nerbonne, 2010). Gain-of-function mutations in KCND3, or its regulatory subunits, have also been associated with BrS (Delpón et al., 2008; You et al., 2015; Portero et al., 2016), giving rise to an ongoing discussion on the apparent role of Ito in the pro-arrhythmic mechanism of BrS (Wilde et al.,
2010). Previous studies have suggested that an increased Ito
may directly affect cardiac conduction due to a current-to-load mismatch during the depolarization process (Hoogendijk et al., 2010a,b). However, the effects of a gain-of-function of Ito on
the AP upstroke velocity at the cellular level remain unknown. The characterization of various knock-out mouse models of α-subunits generating the fast component of Ito (Kcnd3, Kcnd2)
confirmed the involvement of Itoin phase-1 repolarization, but
its impact on AP upstroke velocity or INa density were not
investigated (Niwa et al., 2008; Liu et al., 2015). We recently evaluated the effects of an in silico Itoinjection on AP upstroke
and repolarization velocity using the dynamic clamp technique (Verkerk et al., 2016). In that study, we observed a minimal effect (≈2%) of in-silico Ito injection on upstroke velocity but
only when the injected current was large and rapidly activated at very negative potentials (around −50 mV). However, while an Ito-like current does not appear to directly affect the fast
depolarization, evidence is increasing that various ion channel proteins may interact and thus modulate each other’s expression, function, or membrane trafficking (Balse and Boycott, 2017). For example, studies highlighted an interaction and co-regulation of the Kir2.1 and NaV1.5 proteins with a direct effect on their
electrophysiological properties and thus important for cardiac excitability (Milstein et al., 2012). Moreover, a recent study demonstrated a direct interaction between the KV4.3 and hERG
proteins, resulting in an increase in hERG current density upon co-expression of hERG with KV4.3 (Zhao et al., 2017).
Considering these novel studies and the involvement of both INa
and Itoin BrS, we hypothesized that the level of expression of
KV4.3 may impact on INa.
We addressed this hypothesis by evaluating the impact of KV4.3 protein overexpression on NaV1.5-based current and
sodium channel availability in HEK293 cells stably expressing NaV1.5 (HEK293-NaV1.5). We show that an overexpression of
KV4.3 channels leads to a reduction of NaV1.5 current density
and lower AP upstroke velocity, as measured with the alternating voltage/current clamp (VC/CC) technique. These effects of KV4.3 overexpression could not be explained by alterations
in total NaV1.5 protein expression. Computer simulations
furthermore indicate that the experimentally observed decreased upstroke velocity is not directly due to an increase in the KV4.3-based Ito, but instead a consequence of the KV4.3
protein itself. We also demonstrate that an increase in Ito
as well as a decrease in INa can affect cardiac conduction
and that a combination of both can lead to dramatic consequences, underlining the potential functional relevance of our findings.
MATERIALS AND METHODS
HEK293-Na
V1.5 Cell Culture and
Transfection
To avoid artifacts due to co-transfections, we evaluated the effect of the overexpression of KV4.3 protein on NaV1.5 currents using
a genetically modified cell line constitutively overexpressing the human NaV1.5 channel (van Bemmelen et al., 2004). HEK293
cells stably expressing hNaV1.5 (HEK293-NaV1.5, kindly
provided by Drs. Hugues Abriel and Jean-Sébastien Rougier) were cultured in DMEM (Gibco) supplemented with 10% FBS (Biowest), L-glutamine (Gibco), penicillin-streptomycin (Gibco), and Zeomycin (Invitrogen) in a 5% CO2incubator at 37◦C. Cells
were transfected at 70% confluency in 36.8 mm culture wells with 1 µg IRES-GFP or 1 µg KCND3-IRES-GFP cDNA using lipofectamine (Invitrogen, Carlsbad, USA). Both IRES-GFP and KCND3-IRES-GFP (human KCND3 transcript reference: NM_004980.4) constructs contained the same M61 vector plasmid backbone (Addgene). Gene-transfer was monitored by means of green fluorescence from the IRES-GFP or KCND3-IRES-GFP bicistronic vector. Patch clamp experiments were performed on single fluorescent cells 2 days after transfection.
Ventricular Cell Preparation
Animal procedures were performed in accordance with governmental and institutional guidelines for animal use in research and were approved by the Animal Experimental Committee of the Academic Medical Center, Amsterdam, The Netherlands. Single left ventricular myocytes were isolated from 3 to 5 months old FVB/N mice by enzymatic dissociation (Remme et al., 2006). Therefore, mice were anesthetized by an intraperitoneal injection of pentobarbital prior to cervical dislocation, after which the heart was excised, cannulated, and mounted on a Langendorff perfusion set-up. The hearts were perfused for 5 min with Tyrode’s solution containing (in mM): 140 NaCl, 5.4 KCl, 1.8 CaCl2, 1 MgCl2, 5.5 glucose, 5 HEPES;
pH 7.4 (NaOH). Subsequently, the heart was perfused for 8 min with a similar solution in which the calcium concentration was lowered to 1 µM, after which the enzyme Liberase Blendzyme type 4 (Roche; 0.05 mg/ml) and trypsin (Boehringer, 1 µl/ml of 2.5% solution) were added for 10 minutes. Single myocytes were obtained by gently triturating the digested tissue in the low calcium enzyme solution supplemented with bovine serum albumin (BSA, 50 mg/ml). Myocytes were washed twice in normal calcium Tyrode’s solution and quiescent, rod-shaped cross-striated cells with smooth surface were selected for measurements.
Western Blot Experiment for Total Na
V1.5
Quantification
Forty-eight hours after transfection (1 µg IRES-GFP or 1 µg KCND3-IRES-GFP plasmid), HEK293-NaV1.5 cells were washed
twice with PBS and lysed in PBS containing 0.1% Triton and complete mini EDTA-free protease inhibitor mixture tablet (Roche). Cell lysates were then sonicated twice for 10 s and centrifuged for 10 min at 8.000 rpm. The supernatant was quantified using the BCA kit and 40 µg of each separated
cell lysate was loaded on a 4–20% gradient gel (Bio-Rad) after 5 min of denaturation at 60◦C in Laemmli buffer. The RbαGFP antibody used for Western blotting was purchased from Santa Cruz Biotechnology, RbαCalnexin from Calbiochem, and RbαNaV1.5 from Sigma-Aldrich. Goat anti-rabbit horseradish
peroxidase–conjugated secondary antibodies were purchased from GE Healthcare Life Science. Chemo luminescence signal was acquired with the ImageQuant LAS 4000 instrument. Band intensities were quantified using the public domain ImageJ software (USA National Institutes of Health). Total NaV1.5
protein expression protein was normalized to the calnexin signal.
Electrophysiology
Data Acquisition
NaV1.5 and KV4.3 currents and upstroke velocities (dV/dt)
were measured in the whole-cell configuration of the patch-clamp technique using an Axopatch 200B amplifier (Molecular Devices Corporation, Sunnyvale, CA, USA) or a custom-made amplifier, capable of fast switching between voltage clamp (VC) and current clamp (CC) modes (Berecki et al., 2010). Voltage control, data acquisition, and analysis were accomplished using custom software. Potentials were corrected for the calculated liquid junction potentials (Barry and Lynch, 1991). Signals were low-pass filtered with a cut-off frequency of 5 kHz and digitized at 20, 4, and 40 kHz for NaV1.5, KV4.3, and upstroke velocities,
respectively. Patch pipettes were pulled from borosilicate glass (Harvard Apparatus) and had resistances of ≈2.0 M after filling with the solutions as indicated below. Series resistance was compensated by ≥80%. Cell membrane capacitance (Cm)
was calculated by dividing the time constant of the decay of the capacitive transient upon 5 mV hyperpolarizing voltage step from −40 mV by the series resistance. The average Cmwas not
significantly different between the IRES-GFP and KV
4.3-IRES-GFP cells [IRES-4.3-IRES-GFP: 12.27 ± 0.76 pF (n = 36); KV
4.3-IRES-GFP: 12.00 ± 0.99 pF (n = 37); mean±standard error of the mean (SEM)].
KV4.3 and NaV1.5 Current Measurements With Conventional VC
NaV1.5 current was measured at room temperature (21◦C) with
patch pipettes containing (in mM): 60 CsCl, 50 aspartic acid, 11 EGTA, 1.0 CaCl2, 1.0 MgCl2, 5.0 Na2ATP, 10 HEPES, pH
7.2 (CsOH). Bath solution for NaV1.5 current measurements
contained (in mM): 20 NaCl, 130 CsCl, 2 CaCl2, 1 MgCl2,
5 glucose, 10 HEPES, pH 7.4 (CsOH). KV4.3 current was
measured at 37◦C in Tyrode’s solution with the aforementioned composition. Patch pipettes for KV4.3 current measurements
were filled with solution containing (in mM): 125 K-gluc, 20 KCl, 5 NaCl, 1 MgCl2, 10 BAPTA, 5 MgATP, 10 HEPES, pH 7.2
(NMDG-OH).
Current density and gating properties were determined by means of custom voltage-clamp protocols as indicated in figure insets. Cycle lengths were 5 and 10 s for NaV1.5
and KV4.3 current, respectively. Both NaV1.5 and KV4.3
current densities were defined as the difference between peak and steady-state current, divided by Cm. To determine
the activation characteristics of NaV1.5 current,
current-voltage (I-V) curves were corrected for driving force and
normalized to maximum peak current. Steady-state activation and inactivation curves were fitted using the Boltzmann equation I/Imax =A/{1.0+exp[(V1/2−V)/k]} to determine V1/2
(membrane potential for the half-maximal (in)activation) and the slope factor k.
Upstroke Velocity Measurements Using Alternating VC/CC
The alternating VC/CC technique was used to measure NaV1.5
current-driven upstrokes at physiological temperature and Na+ concentrations, as described previously (Berecki et al., 2010). Patch pipette and bath solutions were similar to those used for KV4.3 current measurements (see above). HEK293-NaV1.5
cells and freshly isolated myocytes were voltage clamped at a holding potential of −85 mV, a value close to the resting membrane potential of working cardiomyocytes. Next, upstroke and repolarization were elucidated by switching for 20 ms to the CC mode of the patch clamp amplifier. Upstrokes were elicited by 1.2× threshold current pulses through the patch pipette at 0.5 Hz and the stimulus current was present during the entire 20 ms in CC mode. Maximal upstroke velocity (dV/dtmax) during VC/CC,
offline corrected for the contribution of stimulus current (Istim),
served as an indicator of NaV1.5 current availability.
Computer Simulations
Numerical Reconstruction of NaV1.5 and KV4.3 Currents in HEK293 Cells
Alternating VC/CC experiments in HEK293 cells expressing NaV1.5 and KV4.3 channels were simulated in a standard cell
model with intracellular and extracellular sodium and potassium concentrations similar to those of the patch-clamp experiments. The cell model contained equations for INa, Ito, and Istim. The
INaand Itoequations were taken from the human ventricular cell
model byTen Tusscher and Panfilov (2006)with the INaand Ito
densities scaled by a factor of 1.8 and 6.0, respectively, to arrive at the experimentally observed values for the maximum upstroke velocity and repolarization velocity. Istimwas set to 6.5 pA/pF to
ensure that the maximum upstroke velocity was reached at ≈4 ms after the stimulus onset as in the experiments. For numerical integration of the differential equations we applied a simple and efficient Euler-type integration scheme (Rush and Larsen, 1978) with a 1-µs time step.
Maximum Upstroke Velocity and Repolarization Velocity in Murine Left Ventricular Myocytes
The alternating VC/CC protocol of the experiments on single left ventricular myocytes was implemented in the CellML code (Cuellar et al., 2003) of the apical version of the mouse ventricular AP model byBondarenko et al. (2004). The amplitude of the 20 ms stimulus current was set to 10 pA/pF, which made the AP upstroke occur at ≈4 ms after the stimulus onset. The maximum upstroke velocity and repolarization velocity were determined from the time derivative of the action potential trace. The CellML code was edited and run in version 0.9.31.1409 of the Windows based Cellular Open Resource (COR) environment (Garny et al., 2003) with its standard CVODE integrator.
Action Potential Transfer in Human Left Ventricular Myocytes
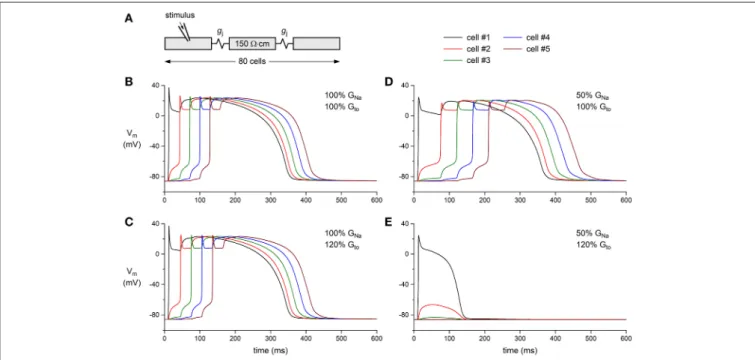
AP transfer was studied in a one-dimensional strand of human left ventricular myocytes. The strand consisted of 80 longitudinally coupled cells, each described by the Ten Tusscher and Panfilov model of a single human ventricular myocyte (Ten Tusscher and Panfilov, 2006). The intercellular coupling conductance was set to 6 nS and the myoplasmic resistivity was set to 150 ·cm. The first cell of the strand was stimulated at a rate of 1 Hz with a 2-ms, ≈20% supra-threshold stimulus current with an amplitude of 3.2 nA. As in other studies (Shaw and Rudy, 1997; Thomas et al., 2003; Wilders, 2012), the entire cell length (of 74 µm) was used as the spatial discretization element, with elements connected by the lumped myoplasmic resistance (calculated from the myocyte dimensions and the myoplasmic resistivity of 150 ·cm) and gap junctional resistance. At the selected gap junctional conductance of 6 nS, this lumped resistance was almost completely determined by the gap junctional resistance (Wilders, 2012). The aforementioned Euler-type integration scheme was used for numerical integration.
Statistics
Data are expressed as mean±SEM. Mann-Whitney Rank Sum test, Student t-test, or Two-Way Repeated Measures ANOVA followed by pairwise comparison using the Student-Newman-Keuls test were used when appropriate. The level of statistical significance was set to p < 0.05.
RESULTS
Characterization of K
V4.3 Current in
HEK293 Cells Stably Expressing Na
V1.5
First, we characterized the KV4.3-driven current resulting from
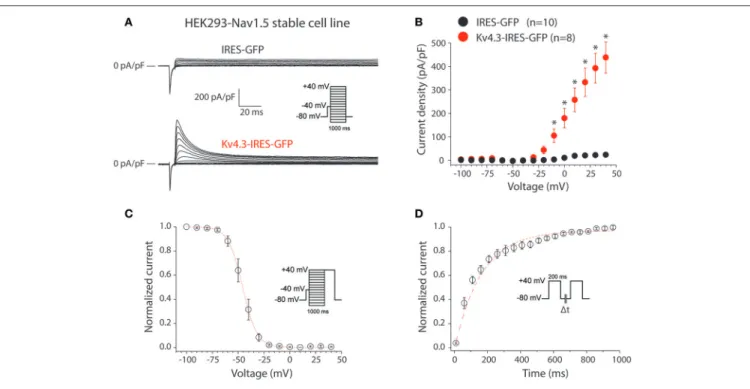
transfection of the KCND3-IRES-GFP plasmid in HEK293 cells stably expressing NaV1.5 (HEK293-NaV1.5). Figure 1A shows
representative currents measured between −100 to 40 mV (with 10 mV increment) during 1-s voltage clamp steps from a holding potential of −80 mV in a HEK293-NaV1.5 cell transfected
with either IRES-GFP (top) or KCND3-IRES-GFP (bottom). A prepulse of 5 ms to −40 mV was applied to activate and inactivate the NaV1.5-based sodium current present in these
HEK293-NaV1.5 cells (Figure 1A, inset). Similar to previous reports, cells
transfected with IRES-GFP showed a small endogenous current upon depolarization (Figure 1A, top) (Niwa et al., 2008). In contrast, cells transfected with KCND3-IRES-GFP displayed a large KV4.3 current which started to activate around −40 mV
and increased in amplitude upon further depolarization due to enhanced activation and increased K+driving force (Figure 1A,
bottom) (Giles and van Ginneken, 1985). Figure 1B shows the average I-V relationships of the KV4.3 current, which was defined
as the difference between the peak and steady-state current. Its density was defined as the current amplitude divided by the membrane capacitance (Cm), amounting to ≈450 pA/pF at
40 mV in the KCND3-IRES-GFP transfected HEK293-NaV1.5
cells, and >20 times smaller in the IRES-GFP transfected cells.
Figure 1Cshows the voltage-dependency of inactivation for the KV4.3 current in the cells transfected with KCND3-IRES-GFP,
measured using a two-pulse protocol with a 1-s prepulse to a potential between −100 and 40 mV followed by a 500-ms test pulse to 40 mV, demonstrating that the KV4.3 current is fully
available at −70 mV and more negative potentials. The V1/2and
k of the voltage-dependency of inactivation were −45.9 ± 2.6 and −5.6 ± 0.4 mV, respectively. Figure 1D shows the recovery from inactivation in KCND3-IRES-GFP transfected HEK293-NaV1.5
cells analyzed with 200-ms pulses to 40 mV with variable inter-pulse intervals. The time constant of recovery from inactivation, analyzed with a mono-exponential fit (Figure 1D, dashed line) was 160 ± 29 ms, demonstrating that recovery from inactivation was completed with an inter-pulse interval of 1 s and longer. The KV4.3 current biophysical properties are summarized in Table S1.
These data indicate that overexpression of KCND3-IRES-GFP in HEK293-NaV1.5 cells results in a large Ito, confirming the
functional expression of KV4.3 channels at the cell membrane.
K
V4.3 Expression Reduces Na
V1.5 Current
in HEK293-Na
V1.5 Cells
Secondly, we characterized the effects of KV4.3 overexpression
on NaV1.5-based current in HEK293-NaV1.5 cells. Figure 2A
shows representative NaV1.5 current activated by 500-ms
depolarizing voltage clamp steps of 5 mV increment from a holding potential of −120 mV in a IRES-GFP or KCND3-IRES-GFP transfected HEK293-NaV1.5 cell. In both conditions,
NaV1.5 current started to activate around −60 mV, peaked
around −30 mV, and subsequently decreased in amplitude due to the reduction in Na+ driving force. As shown in the average I-V relationships in Figure 2B, NaV1.5 current density
was significantly smaller in the KCND3-IRES-GFP transfected cells compared to IRES-GFP transfected cells. For example, at −40 mV NaV1.5 current density was −609 ± 62 and −447 ± 61
pA/pF (p < 0.05; pairwise comparison using a Student-Newman-Keuls test following two-way repeated measures ANOVA) in IRES-GFP and KCND3-IRES-GFP transfected HEK293-NaV1.5
cells, respectively, indicating a decrease in NaV1.5 current density
by ≈25% due to KV4.3 overexpression. Next, we determined
whether the NaV1.5 current density decrease was accompanied
by gating property changes. Because the current decay could not be reliably fit to a 2-exponential function, the time course of inactivation was instead determined by analyzing the time required for 50% of current decay to occur (t50%) at −30 mV
(Remme et al., 2006). t50%did not differ significantly between
IRES-GFP and KCND3-IRES-GFP transfected cells [0.88 ± 0.06 ms (n = 15) vs. 0.84 ± 0.03 ms (n = 19), respectively, p = 0.41; Student’s t-test]. For determining the voltage-dependency of activation for IRES-GFP and KCND3-IRES-GFP transfected cells, I-V relationships, as shown in Figure 2B, were first corrected for the Na+ driving force. Of note, the reversal potential of NaV1.5 current calculated using the Nernst equation is evaluated
at +17.58 mV, which is in line with the sodium current recordings represented in Figure 2A. Next, currents were normalized to their maximal amplitude and the curves were fitted to a Boltzmann distribution curve. Figure 2C shows overlapping curves of voltage-dependency of inactivation. The latter curves were constructed by normalizing currents to their maximal
FIGURE 1 | KV4.3 currents in HEK293-NaV1.5 cells transfected with KCND3. (A) Typical current traces in response to voltage clamp steps to test potentials ranging from −100 to 40 mV recorded from HEK293 cells stably expressing NaV1.5 (HEK293-NaV1.5) and transfected with IRES-GFP (top) or KCND3-IRES-GFP (bottom). Inset: voltage clamp protocol used. (B) Current-voltage (I-V) relationships of the peak outward current in KCND3-IRES-GFP and IRES-GFP transfected cells. Asterisks denote p < 0.05. (C) Voltage-dependency of KV4.3 inactivation in KV4.3-IRES-GFP cells (n = 8). The dotted line is the Boltzmann fit to the average data. Inset:
voltage clamp protocol used. (D) Average recovery from inactivation curve measured with two subsequent 200-ms pulses from −80 to +40 mV with variable inter-pulse durations (1t) of 1–1,000-ms (n = 4). Inset: voltage clamp protocol used. The red dashed line is a mono-exponential fit of the average data.
current during the voltage clamp step to −20 mV. Similarly,
Figure 2Dshows overlapping curves of voltage-dependency of activation for IRES-GFP and KCND3-IRES-GFP transfected cells. These data demonstrate that neither the voltage-dependency of activation nor the voltage-dependency of inactivation of NaV1.5
current were affected by KV4.3 expression. The NaV1.5 current
biophysical properties are summarized in Table S1. Western blot analysis showed no differences in NaV1.5 protein expression
levels between HEK293-NaV1.5 cells with overexpression of
KCND3-IRES-GFP or GFP (Figure 3; original images provided in the Supplementary Material, Figure S1). Thus, our data demonstrate that KV4.3 expression reduces NaV1.5 current
without affecting its gating properties or the NaV1.5 expression
level.
K
V4.3 Expression Reduces Action Potential
Upstroke Velocity
Thirdly, we assessed upstroke velocities in the HEK293-NaV1.5
cells, transfected with either IRES-GFP or KCND3-IRES-GFP plasmids. Noteworthy, HEK293 cells expressing NaV1.5 display
fast depolarizations upon switching from voltage clamp (VC) to current clamp (CC) due to Na+ channel activation as
previously shown (Berecki et al., 2010; Verkerk et al., 2016; Lieve et al., 2017). Thus, the alternating VC/CC technique allows for a more dynamic assessment of NaV1.5 current
as compared to measurements in VC configuration, in the
setting of more physiological temperature and Na+ gradients
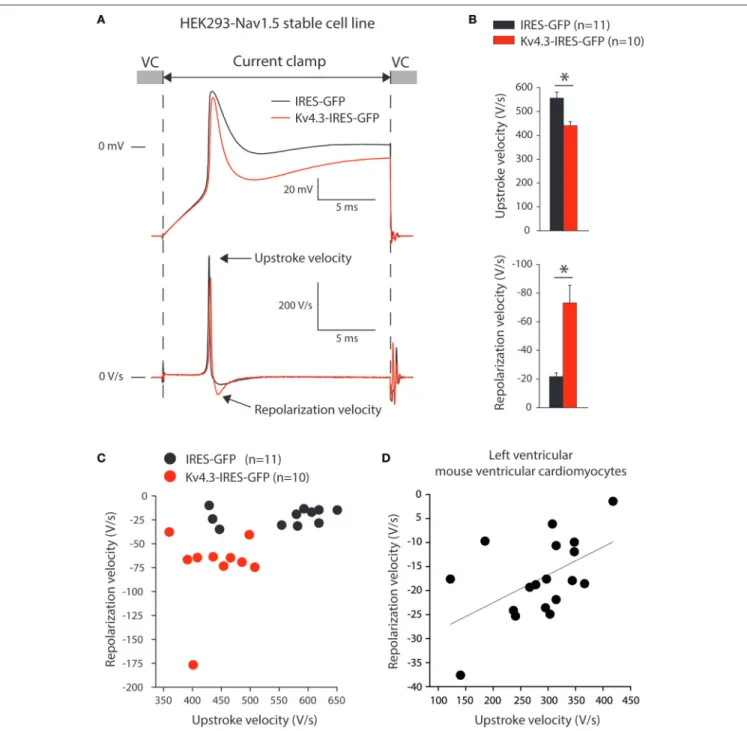
across the membrane. Figure 4A shows typical upstrokes (top) and their time derivatives (bottom) measured upon switching from a holding potential of −85 mV in VC to CC for 20-ms. Upstrokes were evoked at 0.5 Hz, a stimulus frequency at which KV4.3 current is fully available (cf. Figure 1D).
Figure 4Bsummarizes the maximum upstroke velocities (top) and maximum repolarization velocities (bottom). On average, the maximum upstroke velocity of KCND3-IRES-GFP transfected cells was 21% lower than that of IRES-GFP transfected cells (441 ± 17 vs. 556 ± 24 V/s; p < 0.05). Both cell types displayed a repolarization phase following the upstroke (Figure 4A) with a significantly larger maximum velocity (73 ± 13 vs. 22 ± 3 V/s) in KCND3-GFP as compared to IRES-GFP transfected cells (Figure 4B, bottom). In Figure 4C, we plotted for each cell its maximum repolarization velocity vs. its maximum upstroke velocity, further demonstrating an inverse relationship between NaV1.5-induced depolarization and KV
4.3-induced repolarization velocities: KV4.3 expression increases
repolarization velocity, but reduces upstroke velocity.
Relation Between Repolarization and
Depolarization in Ventricular Myocytes of
Mice
The above presented data indicate that KV4.3 (over)expression
FIGURE 2 | KV4.3 overexpression reduces NaV1.5 currents. (A) Typical NaV1.5 current traces in response to 500-ms depolarizing voltage steps from a holding
potential of −120 mV to test potentials ranging from −160 to 50 mV in IRES-GFP (top) and KCND3-IRES-GFP (bottom) transfected HEK293-NaV1.5 cells. Inset: voltage clamp protocol used. (B) Average I-V relationships of the NaV1.5 peak current in IRES-GFP and KCND3-IRES-GFP transfected cells. Asterisks denote p < 0.05. (C,D) Average steady-state inactivation (C) and activation (D) curves. Insets: voltage clamp protocol used. Voltage-dependency of inactivation was measured using a two-pulse protocol where a 500-ms conditioning prepulse to membrane potentials between −160 and 50 mV (to induce steady-state inactivation), was followed by a 50-ms test pulse to −20 mV. Voltage-dependency of activation was measured using the same protocol described as described in (A).
FIGURE 3 | NaV1.5 total expression is not affected by KV4.3 overexpression. (A) Representative Western blots of NaV1.5, calnexin and GFP protein expression in HEK293-NaV1.5 cells. Data from IRES-GFP and KCND3-IRES-GFP transfected cells as well as untransfected cells. Total lysate of HEK293 cells lacking the NaV1.5
overexpression cassette (leftmost lane) was used as negative control for NaV1.5 antibody specificity. (B) Average total NaV1.5 expression normalized to calnexin
FIGURE 4 | KV4.3 overexpression reduces upstroke velocities. (A) Typical examples of upstrokes in KCND3-IRES-GFP and IRES-GFP transfected HEK293-NaV1.5
cells measured with the alternating voltage/current clamp (VC/CC) technique (top) and time derivatives of these upstrokes (bottom). Arrows indicate the maximum AP upstroke and repolarization velocities. (B) Average AP upstroke (top) and repolarization velocities (bottom). Asterisks denote p < 0.05. (C) Relationship of upstroke and repolarization velocities in HEK293-NaV1.5 cells. (D) Relationship of AP upstroke and repolarization velocities in murine isolated left ventricular myocytes. The solid line represents the linear fit (Pearson’s coefficient: r = 0.53).
(Figure 4B), resulting in an inverse relationship between the maximum velocities of depolarization and repolarization (Figure 4C). Next, we determined whether a relationship between repolarization and depolarization also exists in cardiomyocytes. Therefore, we re-analyzed data of alternating VC/CC measurements in murine isolated left ventricular myocytes performed for a previous study (Remme et al., 2006).
In mouse ventricular myocytes, the maximum upstroke and repolarization velocities were 285 ± 19 and −18 ± 2 V/s (n = 18), respectively. In Figure 4D, we plotted for each cell its maximum repolarization velocity vs. its maximum upstroke velocity, demonstrating an inverse relationship, similar to our experiments on HEK293 cells (Figure 4C).
Computer Simulations
To assess the functional relevance of the aforementioned findings, we first carried out computer simulations to explore whether the presence of a KV4.3-based Itoper se may affect the
maximum upstroke velocity of the HEK293-NaV1.5 cells. To
this end, we constructed a model of a HEK293 cell expressing both INa and Ito channels to further explore the findings of
the alternating VC/CC experiment of Figures 4A,B. The INa
and Ito equations were taken from the human ventricular cell
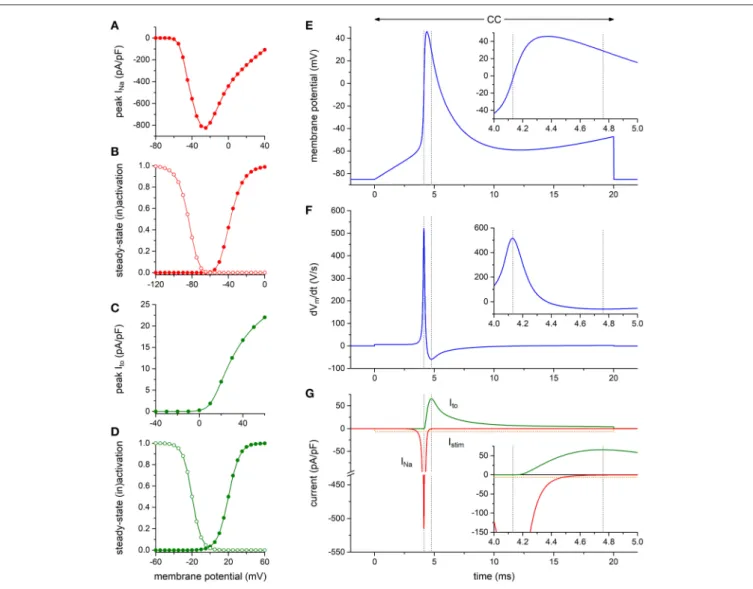
model byTen Tusscher and Panfilov (2006). The characteristics of the simulated INa and Ito are shown in Figures 5A–D
(and also in Figures S2, S3). As illustrated in Figures 5E–G, Ito is effectively zero at the moment of maximum upstroke
velocity, indicating that this maximum upstroke velocity is fully determined by INa. Conversely, INa is almost zero at the
moment of maximum repolarization velocity. Accordingly, there is no direct contribution of INato the maximum repolarization
velocity, although it must be noted that INa may still affect
repolarization velocity through its effect on AP shape. If the voltage-dependency of the Itochannels is shifted by −30 mV, thus
letting them start to activate near −40 mV, Itois still effectively
zero at the moment of maximum upstroke velocity (data not shown).
Next, we established to which extent the KV4.3-based Ito
and the NaV1.5-based INa per se modulate the maximum
upstroke velocity and repolarization velocity of murine left
FIGURE 5 | Numerical reconstruction of NaV1.5 and KV4.3 currents in alternating VC/CC experiments. (A–D) Characteristics of the simulated hNaV1.5 driven fast
sodium current (INa) and hKV4.3 driven transient outward current (Ito). (A) INapeak current as obtained with the voltage clamp protocol of Figure 2. (B) INa
steady-state activation and inactivation curves (closed and open symbols, respectively) as obtained with the voltage clamp protocol of Figure 2. (C) Itopeak current
as obtained with the voltage clamp protocol of Figure 1. (D) Itosteady-state activation and inactivation curves (closed and open symbols, respectively). (E–G)
Reconstruction of the alternating VC/CC experiment. (E) Membrane potential (Vm) during the 20-ms current clamp (CC) phase. Inset: Vmon an expanded time scale.
(F) Time derivative of the membrane potential trace of (E). Inset: dVm/dt on an expanded time scale. (G) Individual time courses of INa, Ito, and the 20-ms inward
stimulus current (Istim). Note the axis break. Inset: INa, Ito, and Istimon an expanded time scale. The vertical dashed lines in (E–G) indicate the time of the maximum
upstroke velocity (left lines) and the time of the maximum repolarization velocity (right lines). Alternating VC/CC protocol as in the patch-clamp experiments on HEK293-NaV1.5 cells.
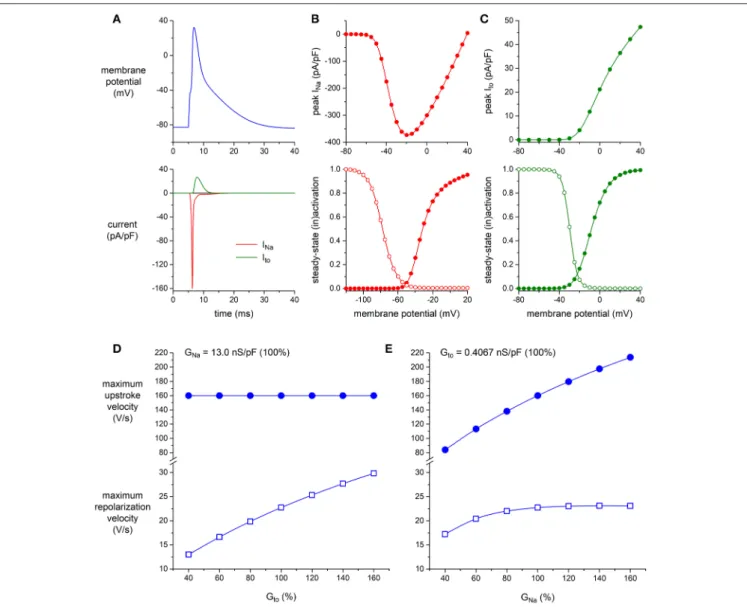
ventricular myocytes. To this end, we ran computer simulations of the alternating VC/CC experiment on mouse ventricular myocytes of Figure 4D using the apical version of the mouse ventricular AP model by Bondarenko et al. (2004), in which we increased or decreased the density of either Ito or INa. The
characteristics of INa and Ito of the Bondarenko et al. (2004)
model are shown in Figures 6A–C (and also in Figures S2, S3). As shown in Figure 6D, and as expected from Figure 5, the maximum upstroke velocity is independent of Ito conductance
(Gto), whereas Gtois an important determinant of repolarization
velocity. The maximum repolarization velocity increases almost linearly with Gto (Figure 6D, open squares), albeit not in a
1:1 fashion—a four times increase in Gto(from 40 to 160% of
its control value) results in a 2.3 times increase in maximum repolarization velocity, which can be explained by accompanying changes in AP shape (and thus in channel activation and inactivation) as well as the presence of other membrane currents. As shown in Figure 6E, the maximum upstroke velocity is strongly dependent on INa conductance (GNa), whereas
repolarization velocity is only substantially affected by GNa at
lower values of GNa. At these lower values, the AP reaches
a considerably lower peak (data not shown), which in turn results in less activation of Ito channels as well as a lower
driving force for these channels. At control or higher values
FIGURE 6 | Effect of INaand Itodensity on maximum upstroke and repolarization velocity in simulated murine left ventricular myocytes. (A–C) Characteristics of the
computer model of apical mouse ventricular myocytes (Bondarenko et al., 2004) used in the simulations. (A) Action potential (top) and associated INaand Ito(bottom). (B) INapeak current (top) and steady-state activation and inactivation curves (bottom; closed and open symbols, respectively), as obtained with the voltage clamp protocol of Figure 2. (C) Itopeak current (top) and steady-state activation and inactivation curves (bottom; closed and open symbols, respectively), as obtained with
the voltage clamp protocol of Figure 1. (D,E) Maximum upstroke velocity and maximum repolarization velocity as obtained in a reconstruction of the alternating VC/CC experiment. (D) Maximum upstroke velocity (filled symbols) and maximum repolarization velocity (open symbols) as a function of Itoconductance (Gto) at a
constant value of INaconductance (GNa). (E) Maximum upstroke velocity and maximum repolarization velocity as a function of GNaat a constant value of Gto. Alternating VC/CC protocol as in the patch-clamp experiments on murine left ventricular myocytes.
of GNa, repolarization velocity is not notably dependent on
GNa.
Finally, we tested whether a decrease in GNa can result
in a loss of conduction in the presence of a concomitant increase in Gto. This was studied in a one-dimensional strand
of poorly coupled human left ventricular myocytes, as illustrated in Figure 7A. Under control conditions (100% GNa and 100%
Gto), the stimulated leftmost cell of the strand was able to drive
its neighboring cells (Figure 7B). This was also observed upon a 20% increase in Gtoor a 50% decrease in GNa (Figures 7C,D,
respectively). The main effect of the decrease in GNa was a
slowing of conduction (cf. Table 1). However, the introduction of a concomitant 20% increase in Gtoled to loss of conduction:
an action potential was elicited in the first cell of the strand, but this cell was unable to transfer this action potential to its neighboring cells (Figure 7E). Thus, a simultaneous increase in Itoand decrease in INa in the setting of a compromised cellular
coupling, as may occur on a microscopic scale in BrS patients, may result in severe conduction alteration.
DISCUSSION
In the present study, we report for the first time a direct effect of KV4.3 expression on NaV1.5 current and consequent
sodium channel availability. We found that overexpression of KV4.3 protein reduces NaV1.5 current density (Figure 2) without
affecting total NaV1.5 protein expression. Moreover, KV4.3
overexpression decreased the upstroke velocity, which was not
due to a direct effect of the current generated by KV4.3. These
findings suggest that the observed effects of KV4.3 on NaV1.5
are due to a functional interaction between the two channel proteins rather than an electrophysiological interference. The physiological relevance of our findings was demonstrated in a multicellular in silico model where we found that an Itoincrease
and concomitant INadecrease is capable of impairing conduction
(Figure 7).
Decreased AP Upstroke Velocity
Secondary to K
V4.3 Overexpression
Using the alternating VC/CC technique, we observed in HEK293 cells stably expressing NaV1.5 a decrease in upstroke
velocity secondary to overexpression of KV4.3. Upstroke velocity
decreased to a similar extent as NaV1.5 sodium current
density (≈25%) in cells overexpressing KV4.3 compared to
cells overexpressing only GFP. Although the alternating VC/CC technique is not commonly used in cardiac electrophysiology, it allows detailed INa studies in a dynamic fashion under
close-to-physiological conditions as occurring during cardiac action potentials (Berecki et al., 2010). Previously it has been used to demonstrate changes in INa during heart failure (Berecki et al.,
2010), changes in intracellular Ca2+concentration (Casini et al., 2009), and in the setting of SCN5A mutations (Remme et al., 2006; Lieve et al., 2017). Using dynamic clamp, we have recently assessed the effect of an Ito-like current on the upstroke velocity
in HEK293 cells transiently overexpressing NaV1.5 channels.
That study revealed only a minor influence of Ito, if any, on
FIGURE 7 | Effect of INaand Itodensity on action potential propagation in a simulated strand of human left ventricular myocytes. (A) Geometry of the strand. The intercellular coupling conductance (gj) was set to 6 nS and the myoplasmic resistivity was set to 150 ·cm. (B–E) Action potential propagation in the strand as a function of INaconductance (GNa) and Itoconductance (Gto). (B) Control conditions: GNaand Gtoboth set to 100% of their control value. (C) Slight slowing of action
potential propagation upon an increase in Gtoto 120% of its control value. (D) Slowing of action potential propagation upon a decrease in GNato 50% of its control
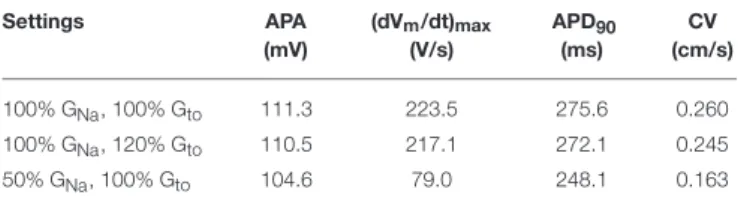
TABLE 1 | Action potential parameters and propagation in a strand of human left ventricular myocytes. Settings APA (mV) (dVm/dt)max (V/s) APD90 (ms) CV (cm/s) 100% GNa, 100% Gto 111.3 223.5 275.6 0.260 100% GNa, 120% Gto 110.5 217.1 272.1 0.245 50% GNa, 100% Gto 104.6 79.0 248.1 0.163 Data obtained from computer simulations with an intercellular coupling conductance of 6 nS. APA, action potential amplitude; (dVm/dt)max, maximum upstroke velocity; APD90,
action potential duration at 90% repolarization; CV, conduction velocity in the strand. Action potential parameters for cells in the middle of the strand.
upstroke velocity (Verkerk et al., 2016). Here, we confirmed these results using computer simulations based on the current densities recorded (Figure 5). The Itocurrent is not yet present
at the time of the maximum upstroke velocity confirming that Itodoes not affect the upstroke velocity in single cells. Moreover,
no correlation between Ito density and AP upstroke velocity
was observed during simulations of the electrical activity of cardiomyocytes (Figure 6). Thus, the observed KV4.3-induced
decrease in upstroke velocity is not a consequence of an increased KV4.3 current.
In freshly isolated left ventricular myocytes of mice, we found an inverse relationship between the maximum upstroke velocity and repolarization velocity (Figure 4D). It is tempting to speculate that such a relationship is due to effects of KV4.3
expression, but this observation might also be due to different currents or transcription gradient of both Kcnd3 and Scn5a through the myocardial wall. Nevertheless, it indicates that depolarization and repolarization are not independent factors. Future overexpression or knock-down experiments in myocytes are needed to provide further insight into the potential relevance of our observation.
Modulation of Na
V1.5 Current by K
V4.3
Expression
We found that KV4.3 overexpression resulted in a significantly
decreased NaV1.5 current density, while neither current kinetics
nor total NaV1.5 protein expression were affected. Several
studies have previously reported interactions and consequent inter-relationships between sodium and potassium channels, or their associated subunits, leading to electrophysiological modifications of either current (Hu et al., 2012; Milstein et al., 2012; Matamoros et al., 2016; Utrilla et al., 2017). For instance, Kir2.1 and NaV1.5 channels when co-expressed exert a synergic
effect on current density due to a distinct trafficking process as compared to when these channels are expressed separately (Utrilla et al., 2017). Concerning the direct interaction of KV4.3
and NaV1.5, a mutation in the SCN1B gene encoding the
cardiac sodium channel β1 subunit has been found in BrS and sudden infant death syndrome patients (Hu et al., 2012). This specific SCN1B mutation led to a decreased INatogether with an
increased Ito, suggesting that Nav1.5 may physically interact with
KV4.3 via β1 to form a macromolecular complex. In neurons,
both sodium and potassium channels mainly localize at the
axon initial segment (AIS), a subcellular region involved in AP genesis. Ion channel recruitment to the AIS is highly dependent on the cytoskeleton and associated proteins which densely populate this region (Brachet et al., 2010; Leterrier et al., 2011; Vacher et al., 2011). A comparable structure is observed at the intercalated discs in adult cardiomyocytes, a subcellular region also characterized by a high density of sodium channels ( Agullo-Pascual et al., 2014; Marsman et al., 2014; El Refaey et al., 2017). Our findings, together with existing knowledge, may suggest a potential subcellular co-localization of KV4.3 and NaV1.5 in
cardiomyocytes and a possible explanation for the co-regulation of channel function. Further studies should aim at unraveling the molecular mechanism involved in our observation. A recent work also highlighted the synergic impact of KV4.3 expression
on hERG channels in HEK293 cells (Zhao et al., 2017). This study together with our findings strongly suggest that the overexpression or knock-down of KV4.3 in cardiomyocytes
may lead to a complex modulation of ion channels initially seen as unrelated including NaV1.5, hERG, and Kir2.1
channels.
Potential (Patho)Physiological Implications
Our computer simulations show that a concomitant increase in Ito and decrease in INa are capable of significantly affecting
cardiac conduction. Our current observations may thus be particularly relevant in the phenotypical explanation of BrS patients presenting with mutations in the KCND3 gene or in genes encoding KV4.3 associated subunits leading to
gain-of-function through an increased protein stability or membrane trafficking of KV4.3 channels. In this context, an increased
Ito current could be associated with a simultaneous decrease
in INa and consequent conduction slowing (Kucera et al.,
2017). Such an effect is likely even more prominent within the subepicardium, a region with relatively low INa and
high Ito. This may be of particular relevance in the right
ventricular subepicardium and right ventricular outflow tract, where fractionated signals indicative of slowed conduction are often observed in BrS patients (Nademanee et al., 2011). Importantly, concomitant cardiac structural abnormalities, for example age-dependent development of fibrosis (Coronel et al., 2005), may further compromise conduction and hence unmask the impact of increased Ito(Hoogendijk et al., 2010a). Moreover,
one may speculate that the known gender differences in Ito
magnitude may also contribute to the male preponderance for BrS via an indirect effect on INa (Di Diego et al.,
2002).
Limitations
While we clearly demonstrated that KV4.3 is capable of
decreasing NaV1.5 current density, extrapolation to physiological
cardiomyocyte conditions must be done with some caution. The upstroke velocities measured in our experiments are in the same range of values as recorded in cardiomyocytes (Berecki et al., 2010; Veerman et al., 2017). However, KCND3 overexpression resulted in KV4.3 currents larger than the Ito
previously reported in various animal species and human ventricular cardiomyocytes (Niwa and Nerbonne, 2010).
Consequently, the KV4.3-induced ≈25% reduction of NaV1.5
current density and upstroke velocity reported in this study is likely smaller in animal species and human. Moreover, our experiments in HEK293 cells were performed without β subunits of either NaV1.5 or KV4.3. We therefore cannot
exclude a supplementary complexity of NaV1.5 macromolecular
complexes in cardiomyocytes. Nevertheless, our myocyte data at least demonstrate that depolarization is not independent of repolarization.
CONCLUSION
Overall, this study gives the first proof of concept that the KV4.3 protein directly impacts on NaV1.5 current. Future
studies employing appropriate disease models should explore the potential electrophysiological implications in (patho)physiological conditions, including BrS associated with gain-of-function mutations in KCND3.
AUTHOR CONTRIBUTIONS
Experimental design: VP, RW, FC, AV, and CR; Data acquisition: VP, RW, and AV; Analysis and interpretation of data: VP, RW, SC, AV, and CR; Drafting manuscript: VP, RW, AV, and CR;
Editing manuscript, and approval: VP, RW, SC, FC, AV, and CR; Funding: CR.
FUNDING
This study was supported by an Innovational Research Incentives Scheme Vidi grant from ZonMw (grant no. 91714371 to CR).
ACKNOWLEDGMENTS
We thank Drs. Hugues Abriel and Jean-Sebastien Rougier (Institute of Biochemistry and Molecular Medicine, Bern, Switzerland) for kindly providing the HEK293-NaV1.5 cell line,
Dr. Ruben Coronel (Academic Medical Center, Amsterdam, The Netherlands) for inspiring discussions, and Jan G. Zegers and Dr. Antoni C.G van Ginneken (Academic Medical Center, Amsterdam, The Netherlands) for developing and providing technical assistance with the soft- and hardware.
SUPPLEMENTARY MATERIAL
The Supplementary Material for this article can be found online at: https://www.frontiersin.org/articles/10.3389/fphys. 2018.00178/full#supplementary-material
REFERENCES
Agullo-Pascual, E., Lin, X., Leo-Macias, A., Zhang, M., Liang, F.-X., Li, Z., et al. (2014). Super-resolution imaging reveals that loss of the C-terminus of connexin43 limits microtubule plus-end capture and NaV1.5 localization
at the intercalated disc. Cardiovasc. Res. 104, 371–381. doi: 10.1093/cvr/ cvu195
Balse, E., and Boycott, H. E. (2017). Ion channel trafficking: control of ion channel density as a target for arrhythmias? Front. Physiol. 8:808. doi: 10.3389/fphys.2017.00808
Barry, P. H., and Lynch, J. W. (1991). Liquid junction potentials and small cell effects in patch-clamp analysis. J. Membr. Biol. 121, 101–117. doi: 10.1007/BF01870526
Benson, D. W., Wang, D. W., Dyment, M., Knilans, T. K., Fish, F. A., Strieper, M. J., et al. (2003). Congenital sick sinus syndrome caused by recessive mutations in the cardiac sodium channel gene (SCN5A). J. Clin. Invest. 112, 1019–1028. doi: 10.1172/JCI18062
Berecki, G., Wilders, R., de Jonge, B., van Ginneken, A. C. G., and Verkerk, A. O. (2010). Re-evaluation of the action potential upstroke velocity as a measure of the Na+current in cardiac myocytes at physiological conditions. PLoS ONE
5:e15772. doi: 10.1371/journal.pone.0015772
Bondarenko, V. E., Szigeti, G. P., Bett, G. C. L., Kim, S.-J., and Rasmusson, R. L. (2004). Computer model of action potential of mouse ventricular myocytes. Am. J. Physiol. Heart Circ. Physiol. 287, H1378–H1403. doi: 10.1152/ajpheart.00185.2003
Brachet, A., Leterrier, C., Irondelle, M., Fache, M.-P., Racine, V., Sibarita, J.-B., et al. (2010). Ankyrin G restricts ion channel diffusion at the axonal initial segment before the establishment of the diffusion barrier. J. Cell. Biol. 191, 383–395. doi: 10.1083/jcb.201003042
Casini, S., Verkerk, A. O., van Borren, M. M. G. J., van Ginneken, A. C. G., Veldkamp, M. W., de Bakker, J. M. T., et al. (2009). Intracellular calcium modulation of voltage-gated sodium channels in ventricular myocytes. Cardiovasc. Res. 81, 72–81. doi: 10.1093/cvr/cvn274
Chen, Q., Kirsch, G. E., Zhang, D., Brugada, R., Brugada, J., Brugada, P., et al. (1998). Genetic basis and molecular mechanism for idiopathic ventricular fibrillation. Nature 392, 293–296. doi: 10.1038/32675
Coronel, R., Casini, S., Koopmann, T. T., Wilms-Schopman, F. J. G., Verkerk, A. O., de Groot, J. R., et al. (2005). Right ventricular fibrosis and conduction delay in a patient with clinical signs of Brugada syndrome: a combined electrophysiological, genetic, histopathologic, and computational study. Circulation 112, 2769–2777. doi: 10.1161/CIRCULATIONAHA.105.532614 Crotti, L., Marcou, C. A., Tester, D. J., Castelletti, S., Giudicessi, J. R., Torchio, M.,
et al. (2012). Spectrum and prevalence of mutations involving BrS1- through BrS12-susceptibility genes in a cohort of unrelated patients referred for Brugada syndrome genetic testing: implications for genetic testing. J. Am. Coll. Cardiol. 60, 1410–1418. doi: 10.1016/j.jacc.2012.04.037
Cuellar, A. A., Lloyd, C. M., Nielsen, P. F., Bullivant, D. P., Nickerson, D. P., and Hunter, P. J. (2003). An overview of CellML 1.1, a biological model description language. Simulation 79, 740–747. doi: 10.1177/0037549703040939
Delpón, E., Cordeiro, J. M., Núñez, L., Thomsen, P. E. B., Guerchicoff, A., Pollevick, G. D., et al. (2008). Functional effects of KCNE3 mutation and its role in the development of Brugada syndrome. Circ. Arrhythm. Electrophysiol. 1, 209–218. doi: 10.1161/CIRCEP.107.748103
Di Diego, J. M., Cordeiro, J. M., Goodrow, R. J., Fish, J. M., Zygmunt, A. C., Pérez, G. J., et al. (2002). Ionic and cellular basis for the predominance of the Brugada syndrome phenotype in males. Circulation 106, 2004–2011. doi: 10.1161/01.CIR.0000032002.22105.7A
El Refaey, M. M., and Mohler, P. J. (2017). Ankyrins and spectrins in cardiovascular biology and disease. Front. Physiol. 8:852. doi: 10.3389/fphys.2017.00852 Garny, A., Kohl, P., and Noble, D. (2003). Cellular open resource (COR): a public
CellML based environment for modelling biological function. Int. J. Bifurcat. Chaos 13, 3579–3590. doi: 10.1142/S021812740300882X
Gellens, M. E., George, A. L., Chen, L. Q., Chahine, M., Horn, R., Barchi, R. L., et al. (1992). Primary structure and functional expression of the human cardiac tetrodotoxin-insensitive voltage-dependent sodium channel. Proc. Natl. Acad. Sci. U.S.A. 89, 554–558. doi: 10.1073/pnas.89.2.554
Giles, W. R., and van Ginneken, A. C. G. (1985). A transient outward current in isolated cells from the crista terminalis of rabbit heart. J. Physiol. 368, 243–264. doi: 10.1113/jphysiol.1985.sp015856
Hoogendijk, M. G., Opthof, T., Postema, P. G., Wilde, A. A. M., de Bakker, J. M. T., and Coronel, R. (2010a). The Brugada ECG pattern: a marker of channelopathy, structural heart disease, or neither? Toward a unifying
mechanism of the Brugada syndrome. Circ. Arrhythm. Electrophysiol. 3, 283–290. doi: 10.1161/CIRCEP.110.937029
Hoogendijk, M. G., Potse, M., Linnenbank, A. C., Verkerk, A. O., den Ruijter, H. M., van Amersfoorth, S. C. M., et al. (2010b). Mechanism of right precordial ST-segment elevation in structural heart disease: excitation failure by current-to-load mismatch. Heart Rhythm 7, 238–248. doi: 10.1016/j.hrthm.2009.10.007 Hu, D., Barajas-Martínez, H., Medeiros-Domingo, A., Crotti, L., Veltmann, C., Schimpf, R., et al. (2012). A novel rare variant in SCN1Bb linked to Brugada syndrome and SIDS by combined modulation of NaV1.5 and KV4.3 channel
currents. Heart Rhythm 9, 760–769. doi: 10.1016/j.hrthm.2011.12.006 Kucera, J. P., Rohr, S., and Kleber, A. G. (2017). Microstructure,
cell-to-cell coupling, and ion currents as determinants of electrical propagation and arrhythmogenesis. Circ. Arrhythm. Electrophysiol. 10:e004665. doi: 10.1161/CIRCEP.117.004665
Le Scouarnec, S., Karakachoff, M., Gourraud, J.-B., Lindenbaum, P., Bonnaud, S., Portero, V., et al. (2015). Testing the burden of rare variation in arrhythmia-susceptibility genes provides new insights into molecular diagnosis for Brugada syndrome. Hum. Mol. Genet. 24, 2757–2763. doi: 10.1093/hmg/ddv036 Leterrier, C., Vacher, H., Fache, M.-P., d’Ortoli, S. A., Castets, F., Autillo-Touati, A.,
et al. (2011). End-binding proteins EB3 and EB1 link microtubules to ankyrin G in the axon initial segment. Proc. Natl. Acad. Sci. U.S.A. 108, 8826–8831. doi: 10.1073/pnas.1018671108
Lieve, K. V., Verkerk, A. O., Podliesna, S., van der Werf, C., Tanck, M. W., Hofman, N., et al. (2017). Gain-of-function mutation in SCN5A causes ventricular arrhythmias and early onset atrial fibrillation. Int. J. Cardiol. 236, 187–193. doi: 10.1016/j.ijcard.2017.01.113
Liu, J., Kim, K.-H., Morales, M. J., Heximer, S. P., Hui, C.-C., and Backx, P. H. (2015). Kv4.3-encoded fast transient outward current is presented in Kv4.2 knockout mouse cardiomyocytes. PLoS ONE 10:e0133274. doi: 10.1371/journal.pone.0133274
Marsman, R. F. J., Bezzina, C. R., Freiberg, F., Verkerk, A. O., Adriaens, M. E., Podliesna, S., et al. (2014). Coxsackie and adenovirus receptor is a modifier of cardiac conduction and arrhythmia vulnerability in the setting of myocardial ischemia. J. Am. Coll. Cardiol. 63, 549–559. doi: 10.1016/j.jacc.2013.10.062 Matamoros, M., Pérez-Hernández, M., Guerrero-Serna, G., Amorós, I., Barana, A.,
Núñez, M., et al. (2016). Nav1.5 N-terminal domain binding to α1-syntrophin increases membrane density of human Kir2.1, Kir2.2 and Nav1.5 channels. Cardiovasc. Res. 110, 279–290. doi: 10.1093/cvr/cvw009
Milstein, M. L., Musa, H., Balbuena, D. P., Anumonwo, J. M. B., Auerbach, D. S., Furspan, P. B., et al. (2012). Dynamic reciprocity of sodium and potassium channel expression in a macromolecular complex controls cardiac excitability and arrhythmia. Proc. Natl. Acad. Sci. U.S.A. 109, E2134–E2143. doi: 10.1073/pnas.1109370109
Nademanee, K., Veerakul, G., Chandanamattha, P., Chaothawee, L., Ariyachaipanich, A., Jirasirirojanakorn, K., et al. (2011). Prevention of ventricular fibrillation episodes in Brugada syndrome by catheter ablation over the anterior right ventricular outflow tract epicardium. Circulation 123, 1270–1279. doi: 10.1161/CIRCULATIONAHA.110.972612
Niwa, N., and Nerbonne, J. M. (2010). Molecular determinants of cardiac transient outward potassium current (Ito) expression and regulation. J. Mol. Cell. Cardiol.
48, 12–25. doi: 10.1016/j.yjmcc.2009.07.013
Niwa, N., Wang, W., Sha, Q., Marionneau, C., and Nerbonne, J. M. (2008). Kv4.3 is not required for the generation of functional Ito,fchannels in adult mouse
ventricles. J. Mol. Cell. Cardiol. 44, 95–104. doi: 10.1016/j.yjmcc.2007.10.007 Portero, V., Le Scouarnec, S., Es-Salah-Lamoureux, Z., Burel, S., Gourraud, J.-B.,
Bonnaud, S., et al. (2016). Dysfunction of the voltage-gated K+channel β2
subunit in a familial case of Brugada syndrome. J. Am. Heart. Assoc. 5:e003122. doi: 10.1161/JAHA.115.003122
Remme, C. A., Verkerk, A. O., Nuyens, D., van Ginneken, A. C. G., van Brunschot, S., Belterman, C. N. W., et al. (2006). Overlap syndrome of cardiac sodium channel disease in mice carrying the equivalent mutation of human SCN5A-1795insD. Circulation 114, 2584–2594. doi: 10.1161/CIRCULATIONAHA.106.653949
Rush, S., and Larsen, H. (1978). A practical algorithm for solving dynamic membrane equations. IEEE Trans. Biomed. Eng. 25, 389–392. doi: 10.1109/TBME.1978.326270
Schott, J. J., Alshinawi, C., Kyndt, F., Probst, V., Hoorntje, T. M., Hulsbeek, M., et al. (1999). Cardiac conduction defects associate with mutations in SCN5A. Nat. Genet. 23, 20–21. doi: 10.1038/12618
Shaw, R. M., and Rudy, Y. (1997). Ionic mechanisms of propagation in cardiac tissue: roles of the sodium and L-type calcium currents during reduced excitability and decreased gap junction coupling. Circ. Res. 81, 727–741. doi: 10.1161/01.RES.81.5.727
Ten Tusscher, K. H. W. J., and Panfilov, A. V. (2006). Cell model for efficient simulation of wave propagation in human ventricular tissue under normal and pathological conditions. Phys. Med. Biol. 51, 6141–6156. doi: 10.1088/0031-9155/51/23/014
Thomas, S. P., Kucera, J. P., Bircher-Lehmann, L., Rudy, Y., Saffitz, J. E., and Kléber, A. G. (2003). Impulse propagation in synthetic strands of neonatal cardiac myocytes with genetically reduced levels of connexin43. Circ. Res. 92, 1209–1216. doi: 10.1161/01.RES.0000074916.41221.EA
Utrilla, R. G., Nieto-Marín, P., Alfayate, S., Tinaquero, D., Matamoros, M., Pérez-Hernández, M., et al. (2017). Kir2.1-Nav1.5 channel complexes are differently regulated than Kir2.1 and Nav1.5 channels alone. Front. Physiol. 8:903. doi: 10.3389/fphys.2017.00903
Vacher, H., Yang, J.-W., Cerda, O., Autillo-Touati, A., Dargent, B., and Trimmer, J. S. (2011). Cdk-mediated phosphorylation of the Kvβ2 auxiliary subunit regulates Kv1 channel axonal targeting. J. Cell. Biol. 192, 813–824. doi: 10.1083/jcb.201007113
van Bemmelen, M. X., van, Rougier, J.-S., Gavillet, B., Apothéloz, F., Daidié, D., Tateyama, M., et al. (2004). Cardiac voltage-gated sodium channel NaV1.5
is regulated by Nedd4-2 mediated ubiquitination. Circ. Res. 95, 284–291. doi: 10.1161/01.RES.0000136816.05109.89
Veerman, C. C., Podliesna, S., Tadros, R., Lodder, E. M., Mengarelli, I., de Jonge, B., et al. (2017). The Brugada syndrome susceptibility gene HEY2 modulates cardiac transmural ion channel patterning and electrical heterogeneity. Circ. Res. 121, 537–548. doi: 10.1161/CIRCRESAHA.117.310959
Verkerk, A. O., Veerman, C. C., Zegers, J. G., and Wilders, R. (2016). Effects of the transient outward potassium current on action potential upstroke velocities tested using the dynamic clamp technique. Comput. Cardiol. 43, 257–260. doi: 10.22489/CinC.2016.076-143
Wilde, A. A. M., Postema, P. G., Di Diego, J. M., Viskin, S., Morita, H., Fish, J. M., et al. (2010). The pathophysiological mechanism underlying Brugada syndrome: depolarization versus repolarization. J. Mol. Cell. Cardiol. 49, 543–553. doi: 10.1016/j.yjmcc.2010.07.012
Wilders, R. (2012). Arrhythmogenic right ventricular cardiomyopathy: considerations from in silico experiments. Front. Physiol. 3:168. doi: 10.3389/fphys.2012.00168
You, T., Mao, W., Cai, B., Li, F., and Xu, H. (2015). Two novel Brugada syndrome-associated mutations increase KV4.3 membrane expression and function. Int. J.
Mol. Med. 36, 309–315. doi: 10.3892/ijmm.2015.2223
Zhao, X.-J., Zhu, C., Tian, L.-Y., Fu, Y.-C., Zhang, Y., Chen, X., et al. (2017). Kv4.3 modulates the distribution of hERG. Sci. Rep. 7:17757. doi: 10.1038/s41598-017-17837-6
Conflict of Interest Statement: The authors declare that the research was conducted in the absence of any commercial or financial relationships that could be construed as a potential conflict of interest.
Copyright © 2018 Portero, Wilders, Casini, Charpentier, Verkerk and Remme. This is an open-access article distributed under the terms of the Creative Commons Attribution License (CC BY). The use, distribution or reproduction in other forums is permitted, provided the original author(s) and the copyright owner are credited and that the original publication in this journal is cited, in accordance with accepted academic practice. No use, distribution or reproduction is permitted which does not comply with these terms.