MULTI-LEVEL TRACE ABSTRACTION, LINKING AND DISPLAY
NASER EZZATI JIVAN
D´EPARTEMENT DE G´ENIE INFORMATIQUE ET G´ENIE LOGICIEL ´
ECOLE POLYTECHNIQUE DE MONTR´EAL
TH`ESE PR´ESENT´EE EN VUE DE L’OBTENTION DU DIPL ˆOME DE PHILOSOPHIÆ DOCTOR
(G ´ENIE INFORMATIQUE) AVRIL 2014
c
´
ECOLE POLYTECHNIQUE DE MONTR´EAL
Cette th`ese intitul´ee :
MULTI-LEVEL TRACE ABSTRACTION, LINKING AND DISPLAY
pr´esent´ee par : EZZATI JIVAN Naser
en vue de l’obtention du diplˆome de : Philosophiæ Doctor a ´et´e dˆument accept´ee par le jury d’examen constitu´e de :
M. ANTONIOL Giuliano, Ph.D., pr´esident
M. DAGENAIS Michel, Ph.D., membre et directeur de recherche M. GAGNON Michel, Ph.D., membre
I would like to dedicate this thesis to my wife Leila, for all of her constant love, support and inspiration.
ACKNOWLEDGEMENTS
I would like to thank all those who have supported me during my doctoral studies. I am particularly grateful to my supervisor, Professor Michel Dagenais, not only for his sincere support during my studies but also for his continuous encouragement and understanding. It was a great honor to work with such a wonderful supervisor. Without his precious advice, guidance and persistent help, this thesis would not have been possible.
My time at Ecole Polytechnique de Montreal has been an enjoyable, memorable and erudite journey. I have learned so much here that will help me in my future life. I would like to praise the Ecole Polytechnique de Montreal and the department of Computer and Software Engineering for giving me the opportunity of studying and working here.
I also acknowledge all my committee members : Professor Giuliano Antoniol, Professor Michel Gagnon, and Professor Ferhat Khendek for sparing their precious time in order to review and evaluate my research work.
Also I would like to thank my colleagues at DORSAL laboratory in the department of Computer and Software Engineering, for their thoughtful and interesting comments on my research. Their kindness helped make this journey so much more enjoyable and unforgettable. Last but not the least ; I want to thank my parents, for providing me the opportunity to follow the road that lead me to my scientific studies and also for all of their years of encouragement, support, patience and love.
And finally, my deepest and warmest thanks to Leila, my beloved wife, for dreaming with me, for being a constant source of encouragement and inspiration, for being tolerating and patient when I was busy and not available for her, and for providing me love, support and inspiration. I can’t even in imagination pay the immense debt of gratitude I owe her.
R´ESUM´E
Certains types de probl`emes logiciels et de bogues ne peuvent ˆetre identifi´es et r´esolus que lors de l’analyse de l’ex´ecution des applications. L’analyse d’ex´ecution (et le d´ebogage) des syst`emes parall`eles et distribu´es est tr`es difficile en utilisant uniquement le code source et les autres artefacts logiciels statiques. L’analyse dynamique par trace d’ex´ecution est de plus en plus utilis´ee pour ´etudier le comportement d’un syst`eme. Les traces d’ex´ecution contiennent g´en´eralement une grande quantit´e d’information sur l’ex´ecution du syst`eme, par exemple quel processus/module interagit avec quels autres processus/modules, ou encore quel fichier est touch´e par celui-ci, et ainsi de suite. Les traces au niveau du syst`eme d’exploitation sont un des types de donn´ees des plus utiles et efficaces qui peuvent ˆetre utilis´es pour d´etecter des probl`emes d’ex´ecution complexes. En effet, ils contiennent g´en´eralement des informations d´etaill´ees sur la communication inter-processus, sur l’utilisation de la m´emoire, le syst`eme de fichiers, les appels syst`eme, la couche r´eseau, les blocs de disque, etc. Cette information peut ˆetre utilis´ee pour raisonner sur le comportement d’ex´ecution du syst`eme et investiguer les bogues ainsi que les probl`emes d’ex´ecution.
D’un autre cˆot´e, les traces d’ex´ecution peuvent rapidement avoir une tr`es grande taille en peu de temps `a cause de la grande quantit´e d’information qu’elles contiennent. De plus, les traces contiennent g´en´eralement des donn´ees de bas niveau (appels syst`eme, interruptions, etc ) pour lesquelles l’analyse et la compr´ehension du contexte requi`erent des connaissances pouss´ees dans le domaine des syst`emes d’exploitation. Tr`es souvent, les administrateurs sys-t`eme et analystes pr´ef`erent des donn´ees de plus haut niveau pour avoir une id´ee plus g´en´erale du comportement du syst`eme, contrairement aux traces noyau dont le niveau d’abstraction est tr`es bas. Pour pouvoir g´en´erer efficacement des analyses de plus haut niveau, il est n´ eces-saire de d´evelopper des algorithmes et des outils efficaces pour analyser les traces noyau et mettre en ´evidence les ´ev`enements les plus pertinents.
Le caract`ere expressif des ´ev´enements de trace permet aux analystes de raisonner sur l’ex´ecution du syst`eme `a des niveaux plus ´elev´es, pour d´ecouvrir le sens de l’ex´ecution en diff´erents endroits, et d´etecter les comportements probl´ematiques et inattendus. Toutefois, pour permettre une telle analyse, un outil de visualisation suppl´ementaire est n´ecessaire pour afficher les ´ev´enements abstraits `a de plus hauts niveaux d’abstraction. Cet outil peut permettre aux utilisateurs de voir une liste des probl`emes d´etect´es, de les suivre dans les couches de plus bas niveau (ex. directement dans la trace d´etaill´ee) et ´eventuellement de d´ecouvrir les raisons des probl`emes d´etect´es.
taille d’une trace ainsi que sa complexit´e, g´en´erer plusieurs niveaux d’´ev´enements abstraits pour les organiser d’une fa¸con hi´erarchique et les visualiser `a de multiples niveaux, et enfin permettre aux utilisateurs d’effectuer une analyse verticale et `a plusieurs niveaux d’abstrac-tion, conduisant `a une meilleure connaissance et compr´ehension de l’ex´ecution du syst`eme.
Le cadre d’application propos´e est ´etudi´e en deux grandes parties : d’abord plusieurs niveaux d’abstraction de trace, et ensuite l’organisation de la trace `a plusieurs niveaux et sa visualisation. La premi`ere partie traite des techniques utilis´ees pour les donn´ees de trace abstraites en utilisant soit les traces des ´ev´enements contenus, un ensemble pr´ed´efini de para-m`etres et de mesures, ou une structure bas´ee l’abstraction pour extraire les ressources impli-qu´ees dans le syst`eme. La deuxi`eme partie, en revanche, indique l’organisation hi´erarchique des ´ev´enements abstraits g´en´er´es, l’´etablissement de liens entre les ´ev´enements connexes, et enfin la visualisation en utilisant une vue de la chronologie avec ´echelle ajustable. Cette vue affiche les ´ev´enements `a diff´erents niveaux de granularit´e, et permet une navigation hi´ erar-chique `a travers diff´erentes couches d’´ev´enements de trace, en soutenant la mise `a l’´echelle s´emantique. Grˆace `a cet outil, les utilisateurs peuvent tout d’abord avoir un aper¸cu de l’ex´ e-cution, contenant un ensemble de comportements de haut niveau, puis peuvent se d´eplacer dans la vue et se concentrer sur une zone d’int´erˆet pour obtenir plus de d´etails sur celle-ci.
L’outil propos´e synchronise et coordonne les diff´erents niveaux de la vue en ´etablissant des liens entre les donn´ees, structurellement ou s´emantiquement. La liaison structurelle utilise la d´elimitation par estampilles de temps des ´ev´enements pour lier les donn´ees, tandis que le second utilise une pr´e-analyse des ´ev´enements de trace pour trouver la pertinence entre eux ainsi que pour les lier. Lier les ´ev´enements relie les informations de diff´erentes couches qui appartiennent th´eoriquement `a la mˆeme proc´edure ou sp´ecifient le mˆeme comportement. Avec l’utilisation de la liaison de la correspondance, des ´ev´enements dans une couche peuvent ˆetre analys´es par rapport aux ´ev´enements et aux informations disponibles dans d’autres couches, ce qui conduit `a une analyse `a plusieurs niveaux et la compr´ehension de l’ex´ecution du syst`eme sous-jacent.
Les exemples et les r´esultats exp´erimentaux des techniques d’abstraction et de visualisa-tion propos´es sont pr´esent´es dans cette th`ese qui prouve l’efficacit´e de l’approche. Dans ce projet, toutes les ´evaluations et les exp´eriences ont ´et´e men´ees sur la base des ´ev´enements de trace au niveau du syst`eme d’exploitation recueillies par le traceur Linux Trace Toolkit Next Generation ( LTTng ). LTTng est un outil libre, l´eger et `a faible impact qui fournit des in-formations d’ex´ecution d´etaill´ees `a partir des diff´erents modules du syst`eme sous-jacent, tant au niveau du noyau Linux que de l’espace utilisateur. LTTng fonctionne en instrumentant le noyau et les applications utilisateur en ins´erant quelques points de traces `a des endroits diff´erents.
ABSTRACT
Some problems and bugs can only be identified and resolved using runtime application behavior analysis. Runtime analysis of multi-threaded and distributed systems is very diffi-cult, almost impossible, by only analyzing the source code and other static software artifacts. Therefore, dynamic analysis through execution traces is increasingly used to study system runtime behavior. Execution traces usually contain large amounts of valuable information about the system execution, e.g., which process/module interacts with which other process-es/modules, which file is touched by which process/module, which function is called by which process/module/function and so on. Operating system level traces are among the most use-ful and effective information sources that can be used to detect complex bugs and problems. Indeed, they contain detailed information about inter-process communication, memory us-age, file system, system calls, networking, disk blocks, etc. This information can be used to understand the system runtime behavior, and to identify a large class of bugs, problems, and misbehavior.
However, execution traces may become large, even within a few seconds or minutes of execution, making the analysis difficult. Moreover, traces are often filled with low-level data (system calls, interrupts, etc.) so that people need a complete understanding of the domain knowledge to analyze these data.
It is often preferable for analysts to look at relatively abstract and high-level events, which are more readable and representative than the original trace data, and reveal the same behavior but at higher levels of granularity. However, to achieve such high-level data, effective algorithms and tools must be developed to process trace events, remove less important ones, highlight only necessary data, generalize trace events, and finally aggregate and group similar and related events.
The expressive nature of the synthetic events allows analysts to reason about system execution at higher levels, to uncover execution behavior in different areas, and detect its problematic and unexpected aspects. However, to allow such analysis, an additional visual-ization tool may be required to display abstract events at different levels and explore them easily. This tool may enable users to see a list of detected problems, follow the problems in the detailed levels (e.g., within the raw trace events), analyze, and possibly discover the reasons for the detected problems.
In this thesis, a framework is presented to address those challenges: to reduce the execu-tion trace size and complexity, to generate several levels of abstract events, to organize the data in a hierarchy, to visualize them at multiple levels, and finally to enable users to perform
a top-down and multiscale analysis over trace data, leading to a better understanding and comprehension of underlying system execution.
The proposed framework is studied in two major parts: multi-level trace abstraction, and multi-level trace organization and visualization. The first part discusses the techniques used to abstract out trace data using either the trace events content, a predefined set of metrics and measures, or structure-based abstraction to extract the resources involved in the system execution. The second part determines the hierarchical organization of the generated abstract events, establishes links between the related events, and finally visualizes events using a zoomable timeline view. This view displays the events at different granularity levels, and enables a hierarchical navigation through different layers of trace events by supporting the semantic zooming. Using this tool, users can first see an overview of the execution, and then can pan around the view, and focus and zoom on any area of interest for more details and insight.
The proposed view synchronizes and coordinates the different view levels by establishing links between data, structurally or semantically. The structural linking uses bounding times-tamps of the events to link the data, while the latter uses a pre-analysis of the trace events to find their relevance, and to link them together. Establishing Links connects the information that are conceptually related together ( e.g., events belong to the same process or specify the same behavior), so that events in one layer can be analyzed with respect to events and information in other layers, leading to a multi-level analysis and a better comprehension of the underlying system execution.
In this project, all evaluations and experiments were conducted on operating system level traces obtained with the Linux Trace Toolkit Next Generation (LTTng). LTTng is a lightweight and low-impact open source tracing tool that provides valuable runtime infor-mation from the various modules of the underlying system at both the Linux kernel and user-space levels. LTTng works by instrumenting the (kernel and user-space) applications, with statically inserted tracepoints, and by generating log entries at runtime each time a tracepoint is hit.
CONTENTS DEDICATION . . . iii ACKNOWLEDGEMENTS . . . iv R´ESUM´E . . . v ABSTRACT . . . vii CONTENTS . . . ix
LIST OF TABLES . . . xiv
LIST OF FIGURES . . . xv
LIST OF SIGNS AND ABBREVIATIONS . . . xix
CHAPTER 1 INTRODUCTION . . . 1
1.1 Introduction . . . 1
1.2 Definition of Execution Trace and Abstract Events . . . 2
1.3 Objective . . . 4
1.4 Contributions . . . 5
1.4.1 Multi-level Trace Abstraction . . . 5
1.4.2 Multi-level Trace Visualization . . . 6
1.5 Thesis Outline . . . 7
1.6 Publications . . . 8
1.6.1 Main Journal Papers . . . 8
1.6.2 Secondary Papers . . . 9
CHAPTER 2 Paper 1 : Multilevel Abstraction and Visualization of Large Trace Data : A Survey . . . 10
2.1 Abstract . . . 10
2.2 Introduction . . . 10
2.3 Multi-level Trace Abstraction Techniques . . . 12
2.3.1 Content-based (data-based) Abstraction . . . 13
2.3.3 Visual Abstraction . . . 19
2.3.4 Resource Abstraction . . . 20
2.3.5 Applications of Trace Abstraction Techniques . . . 21
2.4 Multi-level Trace Visualization . . . 22
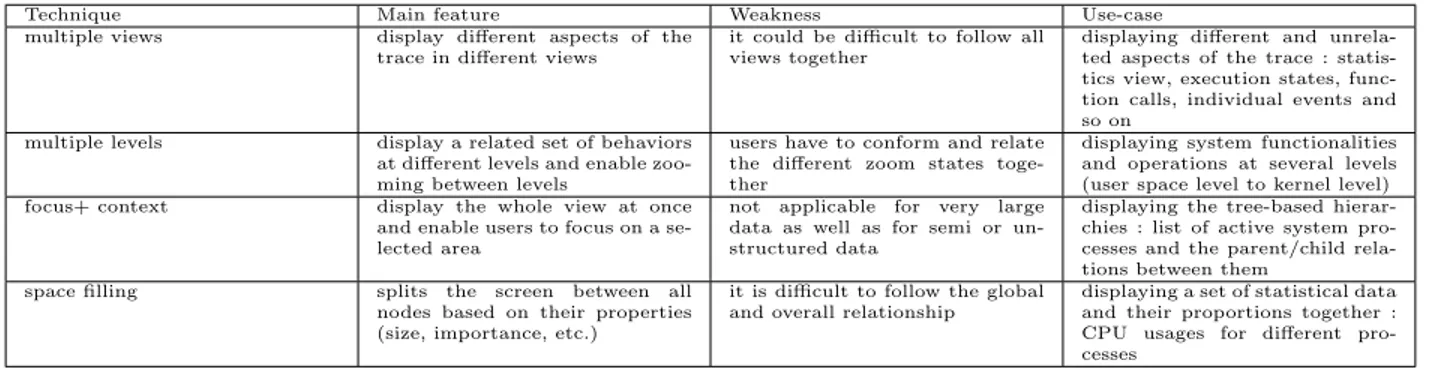
2.4.1 Hierarchy Visualization Techniques . . . 22
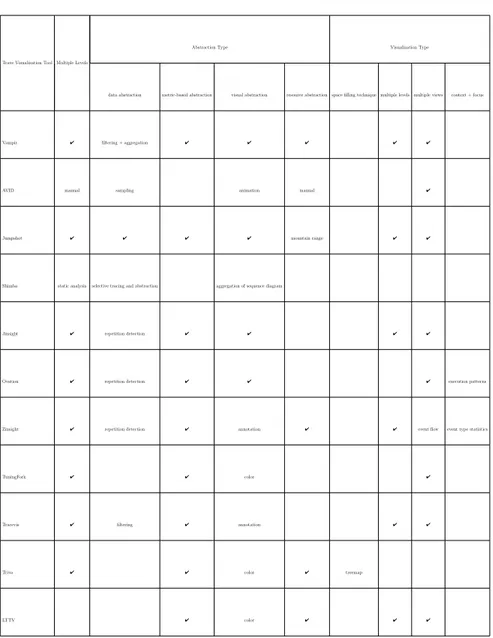
2.4.2 Visualization Tools . . . 28
2.5 Hierarchical Organization of Trace Data . . . 32
2.6 Discussion . . . 38
2.7 Conclusion . . . 42
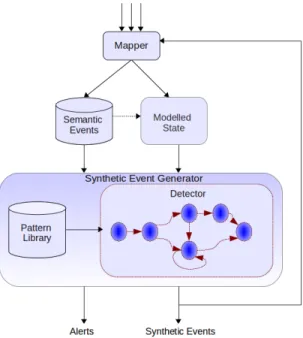
CHAPTER 3 Paper 2 : A Stateful Approach to Generate Synthetic Events From Kernel Traces . . . 44 3.1 Abstract . . . 44 3.2 Introduction . . . 44 3.3 Related Work . . . 46 3.4 Overview . . . 47 3.5 Architecture . . . 49 3.5.1 Mapper . . . 49 3.5.2 Modeled State . . . 50
3.5.3 Synthetic Event Generator . . . 52
3.6 Illustrative Examples . . . 53
3.6.1 System load and performance . . . 53
3.6.2 Denial of service attacks . . . 54
3.6.3 Network scan detection . . . 54
3.7 Implementation . . . 56
3.8 Performance . . . 57
3.8.1 Reduction ratio . . . 57
3.8.2 Patterns and containing events . . . 58
3.8.3 Execution time . . . 60
3.9 Conclusion and Further Work . . . 62
CHAPTER 4 Paper 3 : A Framework to Compute Statistics of System Parameters from Very Large Trace Files . . . 63
4.1 Abstract . . . 63
4.2 Introduction and Problem Statement . . . 63
4.3 Related Work . . . 65
4.5 Architecture . . . 70
4.6 Statistics Generator . . . 72
4.7 Experiments . . . 82
4.8 Conclusion and Future Work . . . 85
CHAPTER 5 Paper 4 : Cube Data Model for Multilevel Statistics Computation of Live Execution Traces . . . 86 5.1 Abstract . . . 86 5.2 Introduction . . . 86 5.3 Related Work . . . 88 5.4 Problem Statement . . . 89 5.4.1 Preliminary Definitions . . . 89 5.4.2 Statistics to Monitor . . . 91 5.5 Architecture . . . 92 5.5.1 Trace Reader . . . 93
5.5.2 Cube Data Model . . . 95
5.6 Query . . . 102
5.6.1 Range Queries . . . 103
5.6.2 Sliding Window Queries . . . 105
5.6.3 Multi-level Queries . . . 105
5.7 Experimental Results . . . 107
5.7.1 Processing Time . . . 108
5.7.2 Memory Usage . . . 110
5.7.3 Query Response Time . . . 113
5.8 Conclusion and Future work . . . 115
CHAPTER 6 Paper 5 : Fast Label Placement Technique for Multilevel Visualizations of Execution Trace . . . 117
6.1 Abstract . . . 117
6.2 Introduction . . . 117
6.3 Related Work . . . 120
6.3.1 Static vs. Dynamic Placement Algorithms . . . 120
6.3.2 Complexity of Algorithms . . . 121
6.4 Multi-level Label Placement . . . 121
6.4.1 Data Items . . . 122
6.4.2 Label Positions . . . 122
6.5.1 Appropriate Level Selection . . . 125
6.5.2 Static Label Assignment Algorithm . . . 126
6.5.3 Increasing the Quality . . . 131
6.5.4 Post Processing Phase . . . 132
6.5.5 Multiple Labels . . . 133
6.5.6 Complexity of the Algorithm . . . 134
6.6 Experimental Results . . . 134
6.6.1 Labeling Output . . . 135
6.6.2 Labeling Success Rate . . . 135
6.6.3 Labeling Quality . . . 137
6.6.4 Execution Time . . . 138
6.7 Conclusion and Future Work . . . 139
CHAPTER 7 Paper 6 : Multilevel Visualization of Large Execution Traces . . . 141
7.1 Abstract . . . 141
7.2 Introduction . . . 141
7.3 Related Work . . . 144
7.3.1 Trace Visualization Tools . . . 144
7.3.2 Data Structures . . . 145
7.4 Multi-level Exploration . . . 146
7.4.1 What to be shown . . . 146
7.4.2 Multi-level Data Generation . . . 149
7.5 Data Model . . . 151
7.6 Visualization Algorithms . . . 158
7.7 Experiments . . . 163
7.7.1 Implementation and Outputs . . . 163
7.7.2 Reduction Rate . . . 165
7.7.3 Construction Time . . . 165
7.7.4 Disk Size . . . 166
7.7.5 Query Time . . . 167
7.7.6 Discussion . . . 168
7.8 Conclusion and Future work . . . 172
CHAPTER 8 GENERAL DISCUSSION . . . 174
LIST OF TABLES
Table 2.1 Trace visualization tools and their features. . . 33
Table 2.2 Comparison of hierarchy visualization techniques . . . 40
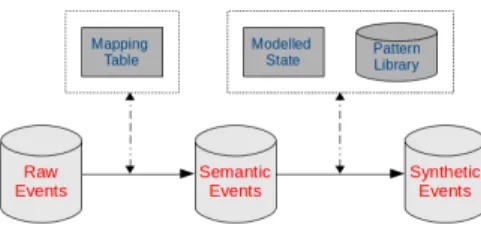
Table 3.1 Raw Events To Semantic Events . . . 48
Table 3.2 Semantic Events To State Changes . . . 49
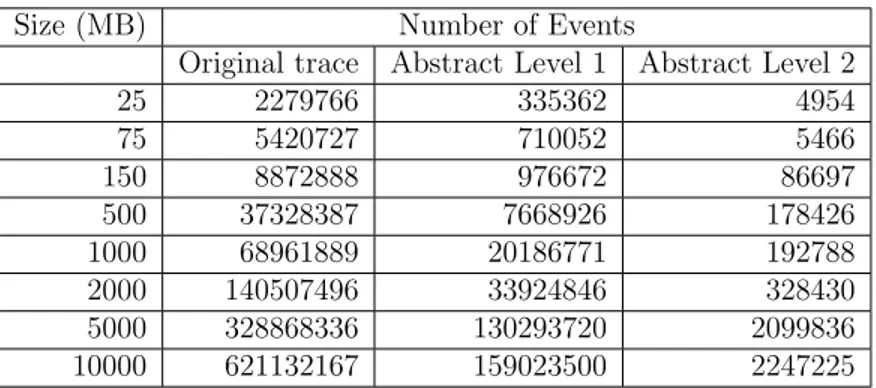
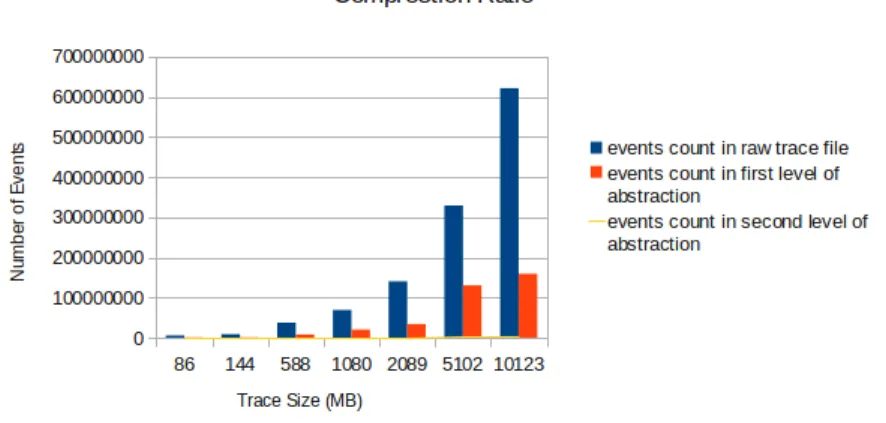
Table 3.3 Number of events in different abstraction levels . . . 57
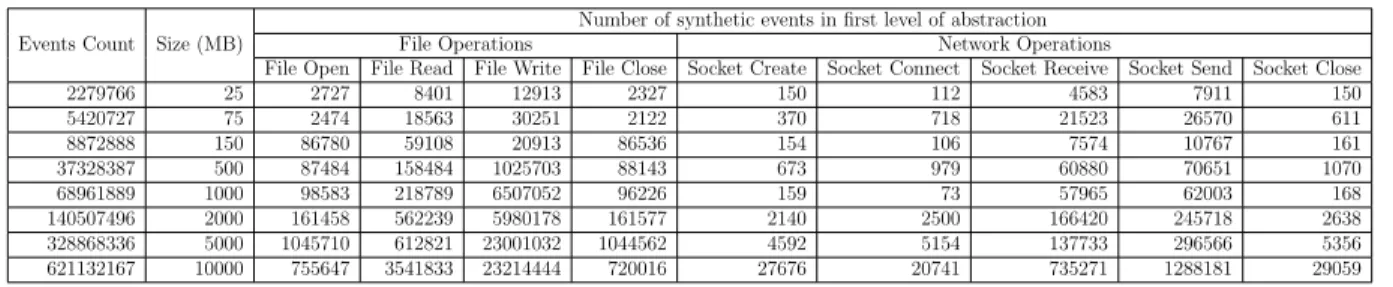
Table 3.4 Count of different event types in first level of abstraction . . . 59
Table 3.5 Count of different event types in second level of abstraction . . . 60
Table 3.6 Average number of containing events for generating the upper level synthetic events . . . 60
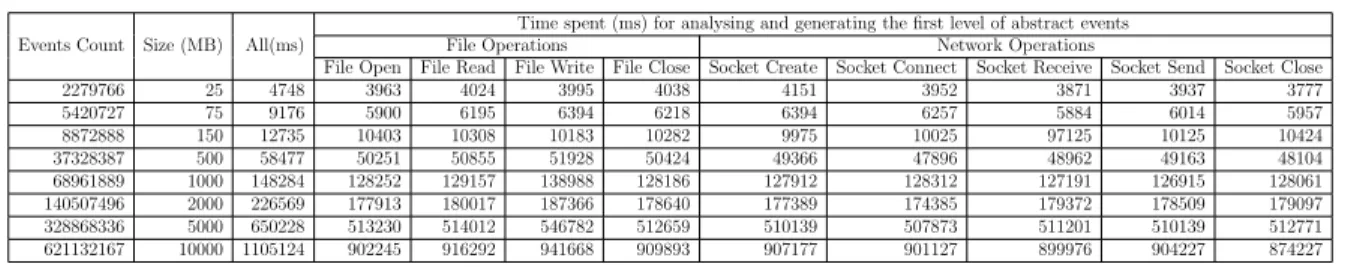
Table 3.7 execution time for generating the first abstraction level . . . 60
LIST OF FIGURES
Figure 1.1 Architectural view of the proposed work. . . 5
Figure 2.1 Taxonomy of topics discussed in this paper. . . 13
Figure 2.2 Recovering a ”file read” event from trace events. . . 16
Figure 2.3 Trace aggregation time comparisons for stateful and stateless approaches [48]. . . 17
Figure 2.4 Hierarchical abstraction of resources extracted from trace events. . . 20
Figure 2.5 Visualization of one million items using treemap. . . 23
Figure 2.6 An example of a hyperbolic browser. . . 24
Figure 2.7 Overivew + Detail method (TMF LTTng viewer). . . 26
Figure 2.8 Context-preserving visualization of related items and links. . . 27
Figure 2.9 Visualization of related items and the links between them. . . 29
Figure 2.10 Examples of the segment and interval tree. . . 36
Figure 2.11 Segments versus intervals. . . 37
Figure 2.12 An example of the R-tree. . . 38
Figure 2.13 An example of the R+-tree. . . 38
Figure 2.14 An example of the R*-tree. . . 39
Figure 3.1 raw, semantic and synthetic events and conversion between them . . . 48
Figure 3.2 architectural view of the stateful synthetic event generator . . . 50
Figure 3.3 typical organization of the modeled state elements . . . 51
Figure 3.4 generating several levels of synthetic events . . . 54
Figure 3.5 state transition for detecting the fork bomb attack . . . 55
Figure 3.6 state transition for detecting the port scanning . . . 56
Figure 3.7 a view of the implemented stateful synthetic event generator . . . 58
Figure 3.8 reduction ratio . . . 58
Figure 3.9 execution time comparisons . . . 61
Figure 4.1 General architecture of the framework. . . 71
Figure 4.2 Database updates for granularity degree = 1. . . 74
Figure 4.3 Database updates for granularity degree = 5. . . 74
Figure 4.4 Using linear interpolation to find a halfway value. . . 75
Figure 4.5 Example of using linear interpolation and granularity degree parameter. 75 Figure 4.6 An example of the CPU scheduling. . . 76
Figure 4.7 A general view of the metric tree. . . 77
Figure 4.9 Disk size of the interval tree data structure. . . 83
Figure 4.10 Construction time for different trace sizes. . . 83
Figure 4.11 Query time for different trace sizes. . . 84
Figure 4.12 Comparison of different approaches for supporting the hierarchical ope-rations. . . 84
Figure 5.1 Examples of dimension schemas. . . 89
Figure 5.2 An instance of the Process dimension schema. . . 90
Figure 5.3 A high-level view of the architecture. . . 92
Figure 5.4 Circular buffer to read and process the stream events. . . 93
Figure 5.5 LTTng trace events for common files accesses. . . 94
Figure 5.6 Two internal structures of the cube data model. . . 95
Figure 5.7 Dimension hierarchies and metrics. . . 96
Figure 5.8 Efficient updating the history data store. . . 98
Figure 5.9 Different granularity degrees for different time durations. . . 99
Figure 5.10 A separate sub-cube for each time unit. . . 99
Figure 5.11 Moving the aggregated values from one tree to another. . . 100
Figure 5.12 Supporting the moving sliding window by delaying the aggregate updates.102 Figure 5.13 Performing range query in the stream history. . . 103
Figure 5.14 Hierarchical queries. 1) Minimal cube materialization, using aggregate functions to compute hierarchical values, 2) Partial cube materializa-tion, storing data at the multiple levels. . . 107
Figure 5.15 Delay between trace events and processing time for one event (average over a batch of 10000 events). . . 108
Figure 5.16 Processing time for different stream processing steps. . . 109
Figure 5.17 Processing time for parallel cube updating . . . 109
Figure 5.18 Memory usage for different trace areas. . . 110
Figure 5.19 Memory usages comparison for tilted and non-tilted time units. . . 111
Figure 5.20 Memory usages for different number of measures. . . 112
Figure 5.21 Memory usages for different cube materialization strategies. . . 112
Figure 5.22 Response time for single point queries. . . 113
Figure 5.23 Response time for range queries. . . 114
Figure 5.24 Response time for roll-up queries. . . 114
Figure 6.1 A view of the visualization pane. . . 118
Figure 6.2 A view of 4-position model. . . 122
Figure 6.3 Candidate label positions and their preferences ranking. . . 123
Figure 6.5 Hierarchy of events used as an input for multi-level labeling algorithm . 126
Figure 6.6 Candidate label positions and corresponding conflict graph . . . 129
Figure 6.7 Labeling algorithm running on the example of Figure 6.6 . . . 129
Figure 6.8 N-Space : an area around each item that might contain overlapping items130 Figure 6.9 Association values of the different labels . . . 131
Figure 6.10 Merging the repetitive items . . . 132
Figure 6.11 Aggregating the related items . . . 133
Figure 6.12 Output of the proposed algorithm for 200 items. 88.5% were labeled without conflict. . . 135
Figure 6.13 Output of the proposed algorithm for the same input as previous example, considering the association between labels and items. . . 136
Figure 6.14 Percentages of conflict-free labels for different set of items in a normal screen . . . 136
Figure 6.15 Percentages of conflict-free labels assigned in a tight screen . . . 137
Figure 6.16 Percentages of conflict-free labels for different set of items . . . 138
Figure 6.17 Percentages of conflict-free labels for different set of items . . . 138
Figure 6.18 Execution time comparison for different algorithms . . . 139
Figure 7.1 Single level visualization of kernel traces (TMF viewer). . . 147
Figure 7.2 Standard zooming of the WGET process (different levels of background layer). . . 147
Figure 7.3 Semantic zooming of the WGET process (different levels of foreground layer). . . 148
Figure 7.4 Highest level view of the multi-scale visualization tool. . . 149
Figure 7.5 Different levels of data generated from the kernel trace events. . . 150
Figure 7.6 The lowest level events generated directly by the tracer module. . . 150
Figure 7.7 Different approaches to support multi-level visualization. . . 151
Figure 7.8 Different levels of events and hierarchical relations between them. . . . 152
Figure 7.9 The data structure used to store the abstract events and the links between them. . . 153
Figure 7.10 An example of linking the events using the S-Link data structure. . . . 154
Figure 7.11 Hybrid solution and storing of only some important events in the check-points. . . 156
Figure 7.12 Store only some events (snapshots) of each level. . . 157
Figure 7.13 The higher level of the input trace log in the ”zoomable timeline view”. 164 Figure 7.14 A middle level showing different DNS connections . . . 164
Figure 7.16 The system calls belong to a high-level DNS connection. . . 165 Figure 7.17 The lowest level of the input trace log in the ”zoomable timeline view”. 165 Figure 7.18 Construction time comparison of the different approaches. . . 167 Figure 7.19 Comparison of construction time of our solution with R-Tree. . . 167 Figure 7.20 Disk usage comparison of the different approaches. . . 168 Figure 7.21 Comparison of time required to fetch the data from the stored databases.169 Figure 7.22 Linking the communicating nodes using the proposed tool. . . 171 Figure 7.23 Visualizing the function calls from user space trace data and kernel
LIST OF SIGNS AND ABBREVIATIONS
FSM Finite State Machine (FSM) IDS Intrusion Detection System
LTTng Linux Trace Toolkit Next Generation LTTV Linux Trace Toolkit Viewer
TMF Trace Monitoring Framework OS Operating System
SHD State History Database UST User-Space Tracer DNS Domain Name System DoS Denial of Service
OLAP Online Analytical Processing CPN Colored Petri Nets
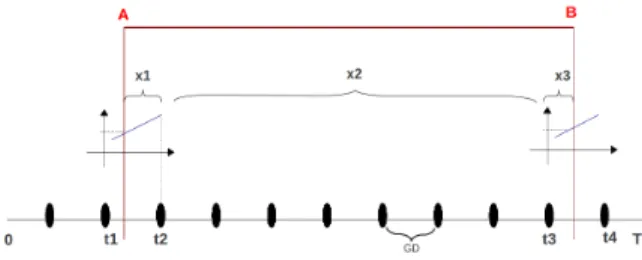
DCA Directed Acyclic Graphs GD Granularity Degree
CHAPTER 1
INTRODUCTION
1.1 Introduction
Software debugging and profiling require an understanding of how programs behave at runtime. Program comprehension is an important step for both software forward and reverse engineering, which can facilitate software optimization, maintenance, bug fixing, and perfor-mance analysis [28]. However, program analysis and comprehension has become a difficult and challenging task in recent years, due to the appearance of complex multi-threaded and distributed systems and applications.
Static properties (e.g., source code, documentation and other artifacts) of a software can be used to predict its runtime behavior and comprehend its execution. However, they may be of limited use, for instance in distributed systems, or operating system level applications, where a set of modules is running concurrently and interacting through message passing. For a simple example, consider the late/dynamic binding in C++ or JAVA, in which the real execution flow is decided in runtime. It then becomes difficult to predict the execution flow of complex systems by only inspecting the source code.
Dynamic analysis, on the other hand, is better suited to analyze system runtime behavior [15, 86]. Dynamic analysis is the inspection of the program’s actions and messages, typically in logs gathered by program tracing. Program tracing is the process that instruments some parts of a program binary or source code to insert hooks and generate trace logs while the program is running [28]. Tracing can produce precise and detailed information from various system levels, from the hardware and operating system level [37] to high architectural levels [125].
Although dynamic analysis through trace data can be used to analyze a program’s runtime behavior and comprehend its execution, this can be challenging. Because, tracing an operating system or a software module at a detailed level, even for a short execution period, may generate very large traces. Therefore, the main challenge of dynamic analysis is dealing with the huge amount of data and finding solutions to analyze huge volumes of execution trace data to understand and comprehend the runtime behavior of software programs with minimal performance impact.
Several techniques are proposed in the related literature to cope with this challenge : e.g., reducing the trace size and abstracting the data by compressing the trace events [67, 78],
filtering out useless information [56], generalizing the data [120], aggregating trace events and generating compound events [56, 99, 142], and finally mining trace data and extracting some interesting patterns (e.g., suspicious activities, resource overuses, etc.) [86]. Visualization is another approach, used in combination with these techniques, to facilitate the dynamic analysis and runtime behavior comprehension [8, 34, 122].
Even with trace abstraction techniques and interactive visualization, the resulting in-formation may still be too large for effective trace analysis and system comprehension. An interesting technique to alleviate this problem is to organize, visualize, and analyze the in-formation at multiple levels of detail[127, 136]. This way, multi-level visualization can enable a top-down/bottom-up analysis by displaying an overview of the data first and letting users go back and forth, as well as up and down, for any areas of interest, to focus, dig into and get more detailed information [107, 126].
Of the many different trace abstraction and visualization techniques proposed in the literature, only a few of them support operating system (kernel) level trace data. Kernel traces provide valuable information about system execution at different levels and from different points of view, which can be very helpful to analyze system execution, debug, and find a large class of system problems (e.g., excessive process/thread migration, non-optimal cache utilization, repeated writes of small data to disk, brute force requests, security problems and so on). Nonetheless, these traces have some specific features and need additional processing. For example, there is a discontinuity between the events from a single process, because of the CPU scheduling policies. Another difference is that kernel traces usually contain events from different modules (disk blocks, memory, file system, processes, interrupts, etc.), which may complicate the analysis.
The main focus of this thesis is on the efforts to facilitate the analysis of operating system execution traces, and to enhance the comprehension of application execution. This includes the development of a scalable multi-level trace abstraction and visualization framework, with support for various analysis techniques targeting trace size and complexity reduction, and for visualization of the reduced traces at multiple levels of detail.
1.2 Definition of Execution Trace and Abstract Events
We define an execution trace as a set of punctual events ei. Each event contains a
ti-mestamp ti which indicates the time when the event occurred, CPU number, channel name
(group to which the event belongs : kernel, file system, memory management, disk block, etc.), event name, corresponding thread name or identification, parent process name or iden-tification, execution mode in which the event was executed (user mode, system call, interrupt,
etc.), and finally the event parameters including file name, network ip and port, etc.
An execution trace may contain several threads : each trace is a mixed set of events from different threads, in which there is a partially ordered set of events for each thread (based on the event timestamp) : if ti < tj then eti < etj.
Abstract events are in turn defined as events generated by applying one or more trace analysis (i.e., abstraction) techniques over the original execution trace. Each abstract event contains a name, key (a running process or a combination of processes), boundary information (start ts and end te), and possible event parameters.
Among the different tracing tools used to instrument the applications at user and ope-rating system (kernel) levels ( LTTng [38], Dtrace [16], SystemTap [46] ), our thesis focuses mainly on the Linux kernel-level trace data gathered by the Linux Trace Toolkit Next Gene-ration (LTTng) [38] tracer. LTTng [38] is a low impact [133], lightweight, open source Linux tracing tool that provides useful information about different kernel operations :
• Running processes, their execution name, ID, parent and children ;
• CPU states and scheduling events, used to reason about scheduling algorithms and CPU utilization ;
• File operations like open, read, write, seek, and close, used to reason about file system operations and IO throughput ;
• Disk level operations, used to gather statistics about disk access latencies ;
• Network operations and the details of network packets, used to analyze network IO throughput and network faults and attacks ;
• Memory management information like allocating or releasing a page, used to analyze memory usage.
Kernel traces have specific features that make trace analysis a difficult and challenging task.
Challenges of Kernel Trace Analysis
The first issue facing kernel trace analysis is the discontinuous nature of the operating system execution. Sometimes, a process is preempted in the middle of execution and another task is executed instead. This process may be resumed at a later time and continued using the same or a different CPU, but different separate sets of logs are generated for each CPU [48].
A second challenge is that only analyzing the events of a particular process may not be enough. For instance, when an attacker gains control of the Apache web server and creates a remote shell, all events of the remote shell will be recorded as a new process (e.g., /ls/bash) instead of the Apache process. Therefore, analyzing only the Apache process is not sufficient
to detect the attack or to determine what the attacker is doing. In essence, the control may be passed from one process to another, and this information is required to reach an extensive comprehension [48, 63].
The third challenge is the existence of very detailed low-level data (i.e, interrupts, memory page, page faults, scheduling, timers, disk block operations, etc.) in the kernel trace. This complicates the analysis because understanding such data requires a deep knowledge of the operating system. It may also makes the analysis techniques and tools dependent upon a specific version of the operating system or trace format [49, 63].
The fourth and final challenge, not only with kernel trace data, is the size of trace data [56]. The trace logs can grow very rapidly, complicating the analysis, and threatening the scalability of the tools. Some techniques should be applied to reduce the trace size before conducting further analysis and visualization.
1.3 Objective
Tracing complete systems provides detailed data at several levels : operating system, virtual machine, and user space. This data is in the form of raw traced events and contains low-level information about the execution of different system modules. The first difficulty arises in how to deduce several synthetic events (e.g., high-level problems) from a set of raw trace events that represents the underlying system execution.
Many elaborate analysis modules may provide different levels of synthetic events. However, the relationship between the new synthetic events and the underlying detailed events may not be direct. For instance, a high concentration of network requests may indicate a cyber-attack ; no isolated network request is necessarily part of the cyber-attack, but together they form a strong symptom of a possible attack. Considering these modules that can generate different abstract events at different levels of granularity, a common underlying recurring need can be identified : the user must be able to navigate through the base raw events, as well as the new information generated by the analysis modules, through linked and coordinated views.
In summary, the challenges can be defined at three levels : conceptual (how to generate different levels of abstract events, modeling them and their links in a uniform way, covering different dimensions and levels) ; algorithmic (how to efficiently store and access these events and links, considering the large number of events involved) ; and ergonomic (how to present a simple and effective visualization of these events and links).
1.4 Contributions
Based on the architectural view shown in Figure 1.1, the contributions of this thesis belong in the two following main categories : (1) multi-level trace abstraction (2) multi-level trace visualization.
1.4.1 Multi-level Trace Abstraction
In this part, we propose different trace abstraction techniques, including data-driven trace abstraction, metric-driven trace abstraction, and structure-based trace abstraction. The main contributions in this category can be summarized as follows :
Figure 1.1 Architectural view of the proposed work.
– Presenting a stateful data-driven trace abstraction technique that uses different ap-proaches like generalization, aggregation and filtering to construct different levels of high-level compound events. A pattern library, including the execution model of va-rious low-level and high-level Linux operations (e.g., file, socket, process operations, fork bomb attack, frequent port scanning, etc.) is developed and used in this technique to extract and recognize specific system behaviors through pattern matching [48, 49] (Chapter 3).
– Proposing a metric-driven trace abstraction technique to extract statistical information from the traces of the underlying program execution. This technique aggregates the trace events based on a given set of metrics and measures the requested metrics and parameters. It also discusses the models and methods to organize, store and access the generated statistical information [50] (Chapter 4).
– Proposing a structure-based trace abstraction method that extracts and organizes the system resources (e.g., processes, files, etc.) involved in the execution of the underlying program. This organization is used later in the visualization phase to present (abstract) trace events in a proper way [50, 51] (Chapter 4).
– Introducing an architecture as well as corresponding data structures and algorithms to summarize trace streams and organize them hierarchically at different levels of
granula-rity, to conduct a multi-level and multi-dimensional analysis, similar to OLAP (Online Analytical Processing) analysis. The proposed solution aggregates the input streams and records them in a compact form at multiple granularity levels, enabling efficient access to data for any arbitrary time interval. It identifies and solves the problem of dealing with large volumes of timestamped trace data, primarily by modifying the gra-nularity of stored data as it ages. Unlike previous contributions used to analyze offline trace data, this approach works efficiently with streaming traces (live trace events), traces of theoretically unlimited size [51] (Chapter 5).
1.4.2 Multi-level Trace Visualization
This part mainly discusses the techniques that organize and visualize execution traces at different levels. Establishing links between trace events is also discussed in the following contributions :
– Proposing a collection of heuristics to place labels along multiple parallel lines with designated points or line-segments. This label placement technique is used in the visua-lization phase to place readable and legible labels on only a subsection of the selected visible events (e.g., those events that have specific features, and thus are important). Unlike cartography and graph labeling, the problem here is notably different because the two dimensions of the plane are used asymmetrically : label offsets along the x axis are more acceptable than label offsets that cross a lane boundary (in Y). This difference distinguishes this work from most prior research, and makes the needed algorithms dis-tinct from graph and cartographic labeling [52, 55](Chapter 6).
– Introducing a zoomable timeline view to visualize the trace data at multiple levels of granularity. The view integrates different abstraction levels in a single display and provides useful navigation mechanisms (i.e., drill-down and standard and semantic zoo-ming) to explore the trace data at various granularity levels. The proposed method uses a set of heuristics to increase the speed of labeling, the quantity of labeled items and the quality of the labels [47, 53] (Chapter 7).
– Presenting a data model to hierarchically organize both the abstract trace events at dif-ferent levels of granularity and also the relationships between them. This is used as the background data store for the zoomable timeline view. The hierarchical organization of the trace data already describes a hierarchical relation. However, it is sometimes requi-red to model and display other (non-trivial) links and relations between data elements, to enable following and digging into a special high-level behavior of the underlying sys-tem. This data organization technique enables a top-down navigation of trace events, resulting in a better comprehension of the underlying system [53] (Chapter 7).
1.5 Thesis Outline
In addition to the survey of the background work in Chapter 2, other parts of this thesis are presented as five journal publications (research papers) which are included in Chapters 3, 4, 5, 6 and 7. The chapters are organized as follows.
Chapter 2 presents a detailed review of the related literature and research, and is organi-zed as a survey paper [54]. It provides a taxonomy of different trace abstraction techniques and their applications. This chapter also presents various hierarchical organizations as well as multi-level visualization techniques for large trace data. A detailed discussion and a com-parison of the methods are also included in this chapter.
Chapters 3, 4, and 5 describe different trace abstraction methods. Chapter 3 discusses several ways to generate different levels of abstract events using data-driven techniques. It also describes a pattern library constructed for this method, containing a set of low-level patterns of ordinary Linux operations (e.g., file operations, socket operations, etc.) as well as some high-level behavioral scenarios (e.g., brute force attacks). The proposed abstraction techniques exploit a stateful approach to share the common states and information among the concurrent patterns, resulting in a better computation time and efficient memory usage. Chapter 4 illustrates a metric-driven trace abstraction approach. It describes the way to extract statistical information from raw trace data, using a predefined mapping table or a pattern library. It then discusses an organization of the extracted statistical information to support efficient point/range queries, for any arbitrary time interval, in the trace analysis phase. This chapter also proposes a structure (resource) based trace abstraction technique that focuses mainly on extracting and organizing system resources involved in a trace file. The resource organization may help later to easily query and access(e.g., filter out) the events of a specific resource or to compare utilization of the different resources.
Chapter 5 proposes a solution for the same problems in chapter 4, but in the context of live trace streams that are of unlimited size. This chapter illustrates how to store interme-diate snapshots of the statistical information in a tree-based data cube structure to support OLAP (Online Analytical Processing) style analysis of the trace data. The proposed solution supports static and dynamic time window queries to extract the aggregated information of the system for any duration in the past, or for any duration between a time in the past and the current time. This technique can be used to monitor and control critical systems and applications.
Chapters 6 and 7 focus on the techniques required for the visualization of the generated abstract events. Chapter 6 discusses an efficient way to place labels on the trace events represented in the different lanes on the screen. It discusses they ways to efficiently select a
set of master events, from the initial candidate events in order to place and display readable and unambiguous labels in the display screen.
Chapter 7 introduces a new visualization technique, called zoomable timeline view, to visualize trace events at multiple levels of granularity. This view first displays an overview of the trace (i.e., the highest abstract level of events) and enables users to move around in the trace, zoom or focus on any interesting area. It supports both standard zooming to enlarge the visible objects of the display, and semantic zooming to display more events and information (another level of trace data) when zooming on any selected area. This technique includes two linking mechanisms between objects at different levels to enable drilling down/rolling up operations : boundary-based links using event timestamps to synchronize the different level views, and content-driven links using preset relationships among data. Establishing links has direct applications in root-cause analysis to follow and dig into a selected problem within the related individual trace events and data.
Finally, chapters 8 and 9 discuss the techniques proposed in previous chapters, the general results, and possible avenues for future work.
1.6 Publications
Many chapters outlined above are based on the published/submitted papers mentioned in this section. The publications are divided into two sections : papers containing the main contributions and included in the thesis, and secondary papers mostly presented in confe-rences, which provide more further viewpoints on the work and sometimes involve other researchers as co-authors. The survey paper presented in Chapter 2 is also listed in the secondary papers.
1.6.1 Main Journal Papers
1- EZZATI-JIVAN, N. and DAGENAIS, M. R. (2012) ”A Stateful Approach to Generate Synthetic Events from Kernel Traces,” Advances in Software Engineering, vol. 2012, Article ID 140368, 12 pages, 2012. DOI=10.1155/2012/140368.
Presented in chapter 3 (Published).
2- EZZATI-JIVAN, N. and DAGENAIS, M. R. (2013) ”A framework to compute statistics of system parameters from very large trace files,”. ACM SIGOPS Operating Systems Review 47, 1 (January 2013), 43-54. DOI=10.1145/2433140.2433151.
Presented in chapter 4 (Published).
3- EZZATI-JIVAN, N. and DAGENAIS, M. R. (2014). ”Cube data model for multilevel statistics computation of live execution traces,” accepted in Concurrency and Computation :
Practice and Experience.
Presented in chapter 5 (Accepted).
4- EZZATI-JIVAN, N. and DAGENAIS, M. R. (2014). ”Fast label placement algorithm for multilevel visualization of execution traces,” submitted to Computing.
Presented in chapter 6 (Submitted).
5- EZZATI-JIVAN, N. and DAGENAIS, M. R. (2014). ”Multilevel visualization of large execution traces,” submitted to Journal of Visual Languages and Computing.
Presented in chapter 7 (Submitted). 1.6.2 Secondary Papers
1- EZZATI-JIVAN, N. and DAGENAIS, M. R. (2014). ”Multiscale abstraction and visua-lization of large trace data : A survey,” submitted to The VLDB Journal.
Presented in chapter 2 (Submitted).
2- EZZATI-JIVAN, N. and DAGENAIS, M. R. (2012). ”An efficient analysis approach for multi-core system tracing data,” Proceedings of the 16th IASTED International Conference on Software Engineering and Applications (SEA 2012).
Contain additional information for chapter 3 (Published).
3- EZZATI-JIVAN, N. and ShAMELl-SENDI, A. and DAGENAIS, M. R. (2013) ”Multi-level label placement for execution trace events,”, 26th Annual IEEE Canadian Conference on Electrical and Computer Engineering (CCECE 2013), vol., no., pp.1,6, 5-8 May 2013.
Contain additional information for chapter 6 (Published).
4- EZZATI-JIVAN, N. and DAGENAIS, M. (2014). ”Multiscale navigation in large trace data,” 27th Annual IEEE Canadian Conference on Electrical and Computer Engineering (CCECE 2014) .
CHAPTER 2
Paper 1 : Multilevel Abstraction and Visualization of Large Trace Data : A Survey
Naser Ezzati-Jivan and Michel Dagenais 2.1 Abstract
Dynamic analysis through execution traces is frequently used to analyze the runtime be-haviour of software systems. However, the large size of traces makes the analysis, and unders-tanding of systems, difficult and complex. Trace abstraction and visualization are potential solutions to alleviate this problem. Many analyses start with an inspection of an overview of the trace, before digging deeper and studying more focused and detailed data. These tech-niques are common and well supported in geographical information systems, automatically adjusting the level of details depending on the scale. However, most trace visualization tools operate at a single level of representation, which is not adequate to support multi-level ana-lysis. Sophisticated techniques and heuristics are needed to address this problem. Multi-scale (multi-level) visualization with support for zoom and focus operations is an effective way to enable this kind of analysis. Considerable research and several surveys are proposed in the literature in the field of trace visualization. However, multi-scale visualization has yet recei-ved little attention. In this paper, we provide a survey of techniques aiming at multi-scale visualization of trace data, and discuss the requirements and challenges faced in order to meet evolving user demands.
2.2 Introduction
Software comprehension is the process of understanding of how a software program be-haves. It is an important step for both software forward and reverse engineering, which facilitates software development, optimization, maintenance, bug fixing, as well as software performance analysis [28]. Software comprehension is usually achieved by using static or dynamic analysis [27].
Static analysis refers to the use of program source code and other software artifacts to understand the meaning and function of software modules and their interactions [137]. Although the software source codes and documents can be useful to understand the meaning of a program, there are situations where they are not very helpful. For instance, when the
documents are outdated, they may not be very useful. Similarly, a rarely occurring timing related bug in a distributed system may be very difficult to diagnose by only examining the software source code and documents.
Dynamic analysis, on the other hand, is a runtime analysis solution emphasizing dynamic data (instead of static data) gathered from program execution. Dynamic analysis records and examines the program’s actions, logs, messages, trace events, while it is being executed. Dynamic analysis is based on the program runtime behavior. This information is obtained by instrumenting the program’s binary or source code and putting hooks at different places (e.g., entry and exit points of each function) [28, 67].
The use of dynamic analysis (through execution traces) to study system behavior is in-creasing among system administrators and analysts [86, 100, 145]. Tracing can produce pre-cise and comprehensive information from various system levels, from (kernel) system calls [49, 56, 142] to high-level architectural levels [125], leading to the detection of more faults, (performance) problems, bugs and malwares than static analysis [44].
Although dynamic analysis is a useful method to analyze the runtime behavior of systems, this brings some formidable challenges. The first challenge is the size of trace logs. They can quickly become very large and make analysis difficult [68]. Tracing a software module or an operating system may generate very large trace logs (thousands of megabytes), even when run for only a few seconds. The second challenge is the low-level and system-dependent specificity of the trace data. Their comprehension thus requires a deep knowledge of the domain and system related tools [49].
In the literature, there are many techniques to cope with these problems : to reduce the trace size [27, 142], compress trace data [67, 78], decrease its complexity [99], filter out the useless and unwanted information [56] and generate high level generic information [48]. Visualization is another mechanism that can be used in combination with those techniques to reduce the complexity of the data, to facilitate analysis and thus to help for software understanding, debugging and profiling, performance analysis, attack detection, and high-lighting misbehavior while associating it to specific software sub-modules (or source code) [8, 34, 122].
Even using trace abstraction and visualization techniques, the resulting information may still be large, and its analysis complex and difficult. An efficient technique to alleviate this problem is to organize and display information at different levels of detail and enable some hierarchical analysis and navigation mechanism to easily explore and investigate the data [127, 136]. This way, multi-scale (multi-level) visualization, can enable a top-down/bottom-up analysis by displaying an overview of the data first, and letting users go back and forth, as well as up and down (focus and zoom) in any area of interest, to dig deeper and get more
detailed information [107, 126].
Of the many different trace visualization tools and techniques discussed in the literature [34, 137, 141, 150] and among those few interesting surveys on trace abstraction and vi-sualization techniques [28, 68, 122], only a small fraction discusses and supports multi-level visualization. This motivated the current survey, to discuss and summarize the techniques used in multi-level visualization tools and interfaces (whether used for tracing, spatial tools, online maps, etc.) and the way to adapt those solutions to execution trace analysis tools.
Indeed, constructing an interactive scalable multi-level visualization tool, capable of ana-lyzing and visualizing large traces and facilitating their comprehension, is a difficult and challenging task. It needs to address several issues. How to generate a hierarchy of abstract trace events ? How to organize them in a hierarchical manner, helping to understand the underlying system ? How to visualize and relate these events in various levels with support of appropriate LOD (Level of Details) techniques ?
Although the technique discussed here are rather generic and applicable for any tracing data, our focus will be more on operating system (kernel) level trace data, when this dis-tinction is relevant. Kernel traces have some specific features that differentiate them from application (user) level traces. For example, unlike in user level tracing, there is a discontinuity between the execution of events for a process, because of preemption and CPU scheduling policies. Another example is that, unlike other (user-level) tracers that monitor only one specific module or process, kernel traces usually contain events from different modules (disk blocks, memory, file system, processes, interrupts, etc.), which may complicate the analysis. The paper is structured as following. First, we discuss the techniques to generate multiple levels of trace events from the original logs, focusing on kernel trace data. Secondly, we present a taxonomy for multi-scale visualization methods targeting hierarchical data, looking at the existing trace visualization tools. Then, we study various solutions to model the hierarchical data. Finally, this paper will conclude with a summary and outline for future work. Figure 2.1 depicts the topics investigated in this paper.
2.3 Multi-level Trace Abstraction Techniques
As mentioned earlier, execution traces can be used to analyze system runtime data to understand its behavior and detect system bottlenecks, problems and misbehaviors [86, 145]. However, trace files can grow quickly to a huge size which makes the analysis difficult and cause a scalability problem. Therefore, special techniques are required to reduce the trace size and its complexity, and extract meaningful and useful information from original trace logs.
Figure 2.1 Taxonomy of topics discussed in this paper.
In the literature, various trace abstraction techniques are surveyed, including two recent systematic surveys [27, 28]. Here, we present a different taxonomy of trace abstraction tech-niques, based on their possible usages in a multi-level visualization tool.
We categorize trace abstraction techniques into three major categories : 1- Content-based (data-based) abstraction techniques, those techniques based on the content of events. 2-Visual abstraction, the techniques mostly used in the visualization steps. 3- Resource abs-traction techniques, those techniques about extracting and organizing the resources involved within trace data.
2.3.1 Content-based (data-based) Abstraction
Using the events content to abstract out the trace data is called content-based abstraction or data-based abstraction. Data-based abstraction can be used to reduce the trace size and its complexity, generalize the data representation, group similar or related events to generate larger compound events, and aggregate traces based on some (predefined) metrics. In the following, we study all of these content-based abstraction techniques.
Trace Size Reduction
In the literature, various techniques have been developed to deal with the trace size problem : selective tracing, sampling, filtering, compression, generalization and aggregation.
Selective tracing [100] refers to tracing only some selected modules/processes of the sys-tem, instead of the whole system. Abstract execution [87] is one of the selective tracing techniques. It stores only a small set of execution trace events for later analysis. Once nee-ded, for any area of interests, this technique re-generates a full trace data by re-executing the selected program module. Shimba [137], a trace visualization tool, also uses a selective tracing method.
Instead of processing all events, trace sampling selects and inspects only a variety of events from the trace data. Trace sampling is used in [19], [43], [59] and [117] and also in AVID visualization tool [141]. Since sampling filters trace events in an arbitrary manner, it may lose information and not preserve the actual system behavior.
Trace filtering is the removal of all redundant and unnecessary events from the trace events, highlighting the events that have some pre-specified importance. Filtering can be done based on various criteria such as event timestamp, event type, event arguments, function name, process name, class or package name, and also the priority and importance of events [29, 96]. Fadel et al. [56] use filtering in the context of kernel traces to remove uninteresting data (memory management events) and noise (page faults) from original data.
Trace compression is another technique used to reduce the trace size. It works by storing the trace events in a compact form by finding similarities and removing redundancies between them [67]. Compression has two common forms : lossy compression that may discard some parts of the source data (e.g., used in video and audio compression) and lossless compression that retains the exact source data (e.g., used in ZIP file format). Kaplan et al. [78] studied both lossy and lossless compression techniques for memory reference traces and proposed two methods to reduce the trace size by discarding useless information [78]. The drawback is that the compression technique cannot be used much for trace analysis purposes. Indeed, compression is more a storage reduction technique rather than an analysis simplification technique. Moreover, since trace compression is usually applied after generating trace events and storing them in memory or disk, it is not applicable for online trace analysis, when there is no real storage for all live trace events.
Event Generalization
Being dependent on a specific version of the operating system or particular version of tracer tool can be a weakness for the trace analysis tools. Generalization is one solution to this problem : the process of extracting common features from two or more events, and combining them into a generalized event [120]. Generalization can be used to convert the system related events into more generalized events. Especially in Linux, many system calls may have overlapping functionality. For example, the read, readv and pread64 system calls in
Linux may be used to read a file. However, from a higher level perspective, all of them can be seen as a single read operation. Another example is generalizing all file open/read/write/close events to a general ”file operation” event in the higher levels [49].
Event Grouping and Aggregation
Trace aggregation is one of the critical steps for enabling multi-scale analysis of trace events, because it can provide a high-level model of a program execution and ease its com-prehension and debugging [92]. In the literature, it is a broadly used method to reduce the size and complexity of the input trace, and generate several levels of high level events [13, 48, 56, 58, 92, 142]. In essence, trace aggregation integrates sets of related events, partici-pating in an operation, to form a set of compound and larger events, using pattern matching, pattern mining, pattern recognition and other techniques [58].
Using a set of successive aggregation functions, it is possible to create a hierarchy of abstract events, in which the highest level reveals more general behaviors, whereas the lowest level reveals more detailed information. The highest level can be built in a way that represents an overview of the whole trace. To generate such high level synthetic events, it is required to develop efficient tools and methods to read trace events, look for the sequences of similar and related events, group them, and generate high level expressive synthetic events [55, 58]. Fadel et al. [56] used pattern matching to aggregate kernel traces gathered by the LTTng Linux kernel tracer1. Since trace events usually contain entry and exit events (for function
calls, system calls, or interrupts), it is then possible to find and match these events and group them to make aggregated events, using pattern matching techniques. For example, they form a ”file read” event by grouping the ”read system call” entry and exit events [56], and some possible file system events between these two (Figure 2.2). A similar technique is exploited by [44] to group function calls into logically related sets, but in user-space level.
Wally et al. [142] used trace grouping and aggregation techniques to detect system faults and anomalies from kernel traces. However, their focus was on creating a language for des-cribing the aggregation patterns (i.e., attack scenarios). Both proposals [56, 142], although useful for many examples of trace aggregation and for applications to the fault identification field, do not offer the needed scalability to meet the demands of large trace sizes. Since they use disjoint patterns for aggregating the events, for large traces and for a large number of patterns, it will be a time-consuming task to take care all of patterns separately. Further op-timization work is required in order to support large trace sizes and a more efficient pattern processing engine [48].
Figure 2.2 Recovering a ”file read” event from trace events. Source [56]
Matni et al. [99] used an automata-based approach to detect faults like ”escaping a chroot jail” and ”SYN flood attacks”. They used a state machine language to describe the attack pat-terns. They initially defined their patterns in the SM language and using the SMC compiler2.
They were able to compile and convert the outlined patterns to C language. The problem with their work is that the analyzer is not optimized and does not consider common infor-mation sharing between patterns. Since their patterns mostly examine events belonging to a small set of system processes and resources, it would be possible to share internal states bet-ween different but related patterns. Without common shared states, patterns simply attempt to recreate and recompute those shared states and information, leading to reduced overall performance. Also, since preemptive scheduling in the operating system mixes events from different processes, the aforementioned solutions cannot be used directly to detect complex patterns, because of the time multiplexing brought by the scheduler. It needs to first split the events sequences for the execution of each process and then apply those pattern matching and fault identification techniques.
These problems were addressed in [48, 49]. They proposed a stateful synthetic event generator in the context of operating system kernel traces. Their trace aggregation method is designed for kernel traces considering all kernel specific features (extracting execution path, considering scheduling events, etc). They also show that sharing the common information simplifies the patterns, reduces the storage space required to retain and manage the patterns, increases the overall computation efficiency, and finally reduces the complexity of the trace analysis (Figure 2.3).
Pattern mining techniques are also used to aggregate traces and extract high level
Figure 2.3 Trace aggregation time comparisons for stateful and stateless approaches [48].
formation from trace logs [5]. It is used to find the patterns (e.g., system problems) that are frequently occurring in the system. Several pattern mining techniques have been stu-died in [20]. Han et al. [70] classified the pattern mining techniques into correlation mining, structured pattern mining, sequential pattern mining, frequent pattern-based clustering, and associative classification ; they described several applications for each category. They repor-ted that frequent pattern mining can lead to the discovery of interesting associations between various items, and can be used to capture the underlying semantics in input data.
Pattern mining may also be used to find system bugs and problems through mining live operating system trace logs as applied by Xu et al. [145] and LaRosa et al. [86]. LaRosa et al. [86] developed a kernel trace mining framework to detect excessive inter-process commu-nication from kernel traces gathered by LTT and dTrace kernel tracers. They used a frequent itemset mining algorithm by dividing up the kernel trace events into various window slices to find maximal frequent itemsets. Using this technique, they were able to detect the excessive inter-process interaction patterns affecting the system’s overall performance [86]. Similarly, they also could find the denial of service attacks by finding processes which use more system resources, and have more impact on the system performance. However, their solution cannot be used to find (critical bug) patterns that occur infrequently in the input trace.
Although pattern based approaches are used widely in the literature, they face some challenges and have some limitations, especially for use in the kernel trace context. Efficient evaluation of patterns has been studied in several experiments [4, 151]. Productive evaluation of the specified patterns is closely related to multiple-query optimization in database systems [151] that identifies common joins or filters between different queries. These studies are based on identification of sub-queries that can be shared between distinct concurrent queries to improve the computational efficiency. The idea of sharing the joint information and states has also been deployed by Agrawal et al. [4]. They proposed an automaton model titled
”N F Ab” for processing the event streams. They use the concept of sharing execution states and storage space, among all the possible concurrent matching processes, to gain efficiency. This technique is also used in the context of kernel trace data to share the storage and computation between different concurrent patterns [48].
2.3.2 Metric-based Abstraction
Besides the grouping of trace events and generation of compound events, used to reduce the trace size and its complexity, another method is to extract some measures and aggregated values from trace events, based on some predefined metrics. These measures (e.g., CPU load, IO throughput, failed and succeeded network connections, number of attack attempts, etc.) may present an overview of the trace and can be used to get an insight into what is really happening in the (particular portion of) trace, in order to find possible underlying problems. Bligh et al. [15], for instance, show how to use the statistics of system parameters to dig into the system behavior and find real problems. They use kernel traces to debug and discover intermittent system bugs like inefficient cache utilization and poor latency problems. Trace statistics, to analyze and find system problems, have been also used in [24, 25, 145]. Xu et al. [145] believe that system level performance indicators can denote the high-level application problems. Cohen et al. [24] firstly established a large number of metrics such as CPU utilization, I/O request, average response times and application layer metrics. They then related these metrics to the problematic intervals (e.g., periods with a high average response time) to find a list of metrics that are good indicators for these problems. These relations can be used to describe each problem type in terms of atypical values for a set of metrics [25]. They actually show how to use statistics of system metrics to diagnose system problems ; However, they do not consider scalability issues, where the traces are too large, and storing and retrieving statistics is a key challenge.
Ezzati et al. [50] proposed a framework to extract the important system statistics by aggregating kernel traces events. The following are examples of statistics that can be extracted from a kernel trace [36, 50] :
• CPU used by each process, proportion of busy or idle state of a process.
• Number of bytes read or written for each/all file and network operation(s), number of different accesses to a file.
• Number of fork operations done by each process, which application/user/process uses more resources.
• Which (area of a) disk is mostly used, what is the latency of disk operations, and what is the distribution of seek distances.
![Figure 2.3 Trace aggregation time comparisons for stateful and stateless approaches [48].](https://thumb-eu.123doks.com/thumbv2/123doknet/2329862.31429/36.918.290.624.153.314/figure-trace-aggregation-time-comparisons-stateful-stateless-approaches.webp)