HAL Id: hal-01610282
https://hal-mines-paristech.archives-ouvertes.fr/hal-01610282
Submitted on 28 Jun 2018
HAL is a multi-disciplinary open access
archive for the deposit and dissemination of
sci-entific research documents, whether they are
pub-lished or not. The documents may come from
teaching and research institutions in France or
abroad, or from public or private research centers.
L’archive ouverte pluridisciplinaire HAL, est
destinée au dépôt et à la diffusion de documents
scientifiques de niveau recherche, publiés ou non,
émanant des établissements d’enseignement et de
recherche français ou étrangers, des laboratoires
publics ou privés.
To cite this version:
William Hilth, David Ryckelynck. Fragmentation modeling of a resin bonded sand. EPJ Web of
Conferences, EDP Sciences, 2017, 140 (11004, 4 p.), �10.1051/epjconf/201714011004�. �hal-01610282�
Fragmentation modeling of a resin bonded sand
William Hilth1,?and David Ryckelynck1,??
1Mines ParisTech, PSL Research University, MAT - Centre des Matériaux,
CNRS UMR 7633, BP 87 91003 Evry, France
Abstract. Cemented sands exhibit a complex mechanical behavior that can lead to sophisticated models, with numerous parameters without real physical meaning. However, using a rather simple generalized critical state bonded soil model has proven to be a relevant compromise between an easy calibration and good results. The constitutive model formulation considers a non-associated elasto-plastic formulation within the critical state framework.
The calibration procedure, using standard laboratory tests, is complemented by the study of an uniaxial com-pression test observed by tomography. Using finite elements simulations, this test is simulated considering a non-homogeneous 3D media. The tomography of compression sample gives access to 3D displacement fields by using image correlation techniques. Unfortunately these fields have missing experimental data because of the low resolution of correlations for low displacement magnitudes. We propose a recovery method that re-constructs 3D full displacement fields and 2D boundary displacement fields. These fields are mandatory for the calibration of the constitutive parameters by using 3D finite element simulations. The proposed recovery technique is based on a singular value decomposition of available experimental data. This calibration protocol enables an accurate prediction of the fragmentation of the specimen.
1 Introduction
In casting foundry, resin bonded sand is used in the casting mold to create the internal cavities of cylinder heads for in-stance. After the solidification, the casting sand has to be extracted. This decoring operation is most commonly car-ried out by mechanical means, knocking on the part with pneumatic hammers to fracture the cores first, and then vi-brating to eliminate the fragmented pieces. Our main aim is to develop a mechanical model able to anticipate the fragmentation of the cemented sand. Nevertheless, this model has to be simple enough to be easily calibrated and used in finite elements simulations.
The literature concerning resin bonded sand is limited and mostly consists in industrial studies varying the resin or its amount, or the sand itself. The model highlighted here is adapted from the Clay And Sand Model (CASM) devel-opped by Yu [1] and the cementention model develdevel-opped by Gens and Nova [2]. This approach, called Cemented Clay And Sand Model (CCASM), has succesfully been ap-plied to cemented sands (see Rios et al. [3]).
The model is calibrated and validated with the use of stan-dard tests realized in collaboration with INSA of Lyon. It is completed with the study of an uniaxial compres-sion test observed by tomography. 3D FEM calculations should be able to predict the fracture surfaces initializa-tion of the cemented sand, therefore the comparison with a non-homogeneous 3D strain field is particularly crucial.
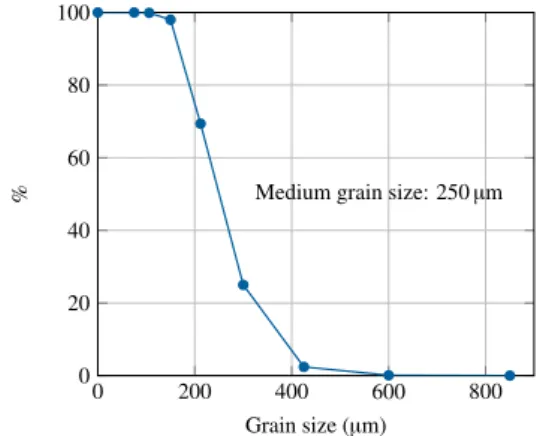
?e-mail: [email protected] ??e-mail: [email protected] 0 200 400 600 800 0 20 40 60 80 100
Medium grain size: 250µm
Grain size (µm)
%
Figure 1. Grain size distribution
This study is focused on a polyurethane bonded silica sand (1%wt. of resin). The grain size distribution is plotted in Figure 1.
2 Model
2.1 Yield surface and plastic flow
The constitutive elasto-plastic model, called Cemented Clay And Sand Model (CCASM), is the extension for ce-mented soils of the Clay And Sand Model developped by Yu. The cementation is taken into account by the introduc-tion of a scalar variable b named bonding parameter. This
variable and its evolution enable to model the intergranu-lar bonding and its decay.
The bonding parameter amplifies the yield surface, assum-ing that its shape is the same as the yield surface of the unbonded sand. The amplification of the yield surface is controled by the isotropic compression and tensile yields:
po= pc(1+ b)
pt= αpcb
where pcis the isotropic compression yield for the
unce-mented sand and α a constant scalar parameter for the trac-tion resistance. We assume here, for simplicity, a linear elasticity. The yield surface of the CCASM is:
f(σ∼; pc, b) = q M(p+ pt) !n + 1 ln rln p+ pt pc(1+ b) + pt ! (1)
where p is the hydrostatic pressure, q the equivalent von Mises stress and M is the stress ratio η=q/(p+pt) at
criti-cal state. For p → −ptwe impose f = 0.
In the critical state framework, the soil behavior is as-sumed to rely on the stress ratio:
• η > M: contraction of the soil.
• η = M: shearing can occur without any changes in stress or volume. In this case, the incremental volumetric plas-tic strain is zero.
• η < M: dilatation of the soil.
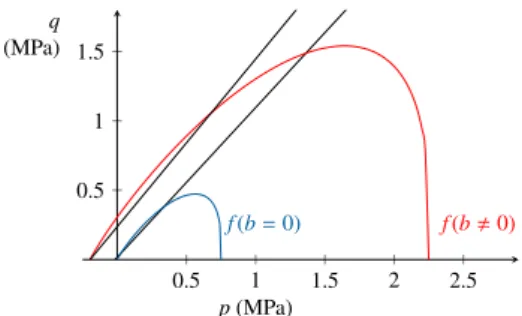
The yields surfaces for the bonded and unbonded soil are plotted in Figure 2. For each configuration, the Critical State Line (η= M) is plotted in black.
The expression of f is the sum of two terms:
• q
M(p+ pt)
!n
that controls the behavior of the core when sheared • 1 ln rln p+ pt pc(1+ b) + pt !
that controls the hydrostatic clo-sure of the yield locus
nand r are constant coefficients that control the shape of the yield. Increasing n tends to bring closer the yield locus to the critical state line and closes more abruptly the yield locus. The spacing ratio r enables to modulate the intersection of the yield locus and the Critical State Line, hence controlling the softening/hardening transition of the model.
Rowe flow rule for bonded soil has been developped for this model, based on the ratio between the incremental plastic volumetric strain and the incremental plastic shear strain:
˙εvp
˙εps
= 9(M − η)
9+ 3M − 2Mη (2) We note here that at the critical state, we have ˙εvp = 0 as
stated before. Moreover, for η > M, ˙εpv < 0 inducing
a dilatation of the soil (alternatively, for η < M, the soil contracts). 0.5 1 1.5 2 2.5 0.5 1 1.5 f(b= 0) f(b , 0) p(MPa) q (MPa)
Figure 2. Yield surfaces in the (p,q) plane
2.2 Evolution of the parameters
The model has a hardening variable pcand a plastic strain
damage mesure, h, which ensures the irrecoverable de-crease of b.
The evolution of the preconsolidation pressure is controled by the classical critical state rule:
˙ pc pc = v0 λ − κ˙ε p v (3)
where κ and λ are compressibility parameters of the unce-mented sand and v0the initial specific volume. Combining
this hardening rule and equation 2, we can see that for a contraction of the soil pcdecreases, leading to a softening
of the bonded soil.
The bonding parameter b decrease exponentially relatively to the plastic strain damage mesure evolution as:
b= b0exp(−h) ˙h= h0| ˙ε p v|+ h1| ˙ε p s|
where h0 and h1 are two material parameters that control
the sensibility of the material to plastic shear or volumetric strain.
Because of the decay of the intergranular bonding, we modeled the decrease of the effective stiffness modulus with a damage parameter D that only depends on the evo-lution of b. E= Eini(1 − D) D(b; k0, k1)= 1 − sinh(k0(b − k1))+ sinh(k1k0) sinh(k0(b0− k1))+ sinh(k1k0) (4) where k0and k1are constant parameters and b0 the initial
value of b. The evolution of D with respect to b/b0is
plot-ted in Figure 3. We considered here that the damage of the media is only caused by the intergranular debonding. No damage mechanisms due to the sand itself (involving pcfor instance) are considered. The damage law was
cali-brated using cycled uniaxial compression tests and assess-ing the loss of stiffness (E/Eini) during plastic loading.
3 Validation procedure
3.1 Idealized uniaxial compression test
The first step in the calibration and validation of the CCASM is to model an idealized test and compare the
0 0.2 0.4 0.6 0.8 1 0 0.2 0.4 0.6 0.8 1 b/b0 D
Figure 3. Evolution of D with respect to b/b0
p q f1 f2 f1 f2 M 1.4 1.1 n 3.8 4.75 r 6000 2500 α 0.42 0.46
Figure 4. Redoundancy forecast in the parameters space
results with laboratory tests. The literature generally fo-cuses on strain-stress curves or the evolution of plastic shear/volumetric strain during triaxial compression tests. This approach usually gives intervals of admissible param-eters especially for the ones involved in the formulation of the yield surface. Given the uncertainties due to the tests, whether in the mesures themselves or in test repeatabil-ity (variabilrepeatabil-ity of the samples, initial inhomogenerepeatabil-ity, ...), it is almost impossible to produce a single set of parameter values that can calibrate the model with only the data of standard tests. See for instance Figure 4 that shows two sets of parameters for the yield surface that lead to nearly the same yield locus.
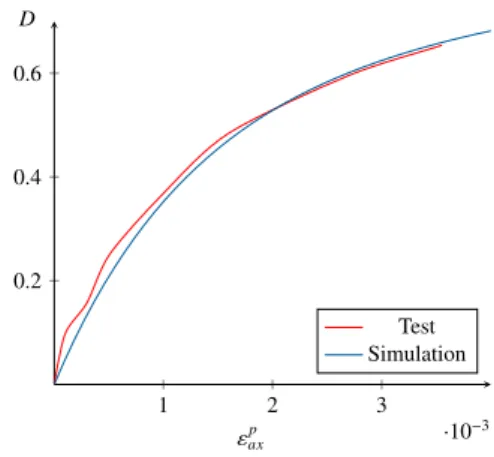
In Figure 5, strain-stress curve for an uniaxial com-pression test are plotted. The model doesn’t take into account for the pre-peak hardening as we considered the material elastic until the peak. This hypothesis tends to overevaluate the plastic strain. A modification of the CCASM with a multisurface approach can be imagined with one surface modeling the pre-peak hardening and the CCASM modeling the post-peak behavior (see for instance the Revised Modified Cam-clay model by Ami Saada et al. [6]). The damage law captures precisely the loss of stiffness through the loading. In Figure 6 the axial plastic strain and the damage parameter value taken from a cycled uniaxial compression test is compared to the FEM simulation.
Moreover, focusing only on these macroscopic curves doesn’t allow to compare the fracture surfaces between tests and FEM simulations. For instance, for uniaxial com-pression test, the strain and stress fields during the post-peak domain are widely inhomogeneous as the localisa-tion appears. This phenomenon makes troublesome to
0.3 0.6 0.9 1.2 ·10−2 1 2 3 4 5 ε q (MPa) Test Simulation
Figure 5. Comparison of strain-stress curves for uniaxial com-pression test 1 2 3 ·10−3 0.2 0.4 0.6 εp ax D Test Simulation
Figure 6. Evaluation of the damage law
evaluate the stress or strain with only the data of macro-scopic curves. The parameters involved in the plastic flow or hardening rules are not obvious to calibrate. Thus, the constitutive model must be evaluated not only on the basis of standard laboratory tests but with the comparison of 3D inhomogeneous displacement fields.
3.2 Uniaxial compression test studied in tomography
As stated before, the model must predict correctly the frac-ture surfaces. Realistic displacement fields, taken from an uniaxial compression test on a cuboid observed in tomog-raphy, are considered as Dirichlet conditions for a FEM calculation. Unfortunately, these fields have missing ex-perimental data because of the low correlations resolution for low displacement magnitudes. Moreover, the displace-ment fields are noisy. A method for reconstructing and filtering the data has been developped. This algorithm is based on the Gappy POD method [4, 5]. This method is:
1. Build a data base of m points, or snapshots, where all the information is known at every time step 2. Build a proper order decomposition base V of these
x y z a. x y z b.
Figure 7. a. εsof the model, b. εsGappy POD
3. At each points where the information is missing, ap-ply the base V in order to reconstruct the gappy field
4. Enrich the snapshots matrix with the new recon-structed points and continue the process until all the points are reconstructed
We used these reconstructed displacement fields as Dirichlet conditions at the top and the bottom of the cuboid sample. The simulation is performed until the post-peak domain. We compare the strain field calculated to the one determinated with the total displacement field applied to all the cuboid sample. Figure 7 shows the total shear strain, εs, for both approaches, as the fragmentation of the
media is mostly due to shear strain. Figure 7 a. is dis-played at a time step before Figure 7 b..
Qualitatively, the simulation using the CCASM model forecasts the first slip in the top corner. A second conju-gate shear band at 45◦ is also predicted. This band is ac-tually supposed to appear after. Figure 7 b. shows the first time step of initialization of this band at a later stage of the loading. As pointed out before, the constitutive model tends to overevaluate the plastic strain. This explains the anticipation of this shear band.
The study of this FEM calculation has allowed a deeper comprehension of the parameters, especially those in-volved in the plastic flow. The resin-bonded sand pos-sesses at the same time the caracteristics of a coesive terial (via the intergranular bonding) and a frictional ma-terial (as a sand). Those different behaviors are modeled respectively by the evolution of b (or h) and pc. The study
of the displacement field taken from the uniaxial compres-sion test enabled to distinguish more accurately the rel-ative importance of the decohesion or the frictional con-traction of the soil. Both phenomena lead to a softening of the material that are fused in the macroscopic strain-stress curve.
4 Conclusion
The model was adapted and calibrated using a 3 steps method:
1. Adaptation of the Cemented Clay And Sand Model as described by Rios et al. (2016). The model was modified to the resin-bonded sand by considering a linear elasticity, changing the damage law and the plastic flow rule
2. Determination of intervals of correct parameters using macroscopic strain-stress curves taken from standard laboratory tests. These tests only gave qualitative informations on the fracture surfaces of the cemented sand subjected to various loading 3. Deeper study of realistic 3D displacement fields that
enabled a better comprehension of the various pa-rameters of the model, notably the impact of the de-cay of the intergranular bonding in the macroscopic behavior of the material.
The use of 3D FEM calculations is a relevant approach for calibrating and validating a model, especially for a soften-ing material presentsoften-ing strong inhomogeneities as studied here. This method is particularly suitable when the final aim is to anticipate the fracture modes of the media.
Acknowledgements
The authors would like to acknowledge the Agence Na-tionale pour la Recherche for their financial support for the FIMALIPO project.
References
[1] Yu H.-S., International Journal for Numerical and An-alytical Methods in Geomechanics, 22, 621-653 (1998) [2] Gens A. and Nova R., Geotechnical engineering of
hard soils-soft rocks, 1, 485-494 (1993)
[3] Rios, S. and Ciantia, M. and Gonzalez, N. and Arroyo, M. and Viana da Fonseca, A., Computers and Geotech-nics, 73, 100-108 (2016)
[4] Everson, R. and Sirovich, L., J. Opt. Soc. Am. A, 12,1657-1664 (1995)
[5] Carlberg, K. and Bou-Mosleh, C. and Farhat, C., In-ternational Journal for Numerical Methods in Engineer-ing, 86, 155-181 (2011)
[6] Ami Saada, R. and Bonnet, G. and Bouvard, D., Inter-national Journal of Plasticity, 12, 273-294 (1996)