CIDA Ref: 7038883 CEA Ref: 604138 INRS Ref: R1325 ISBN Ref: 978-2-89146-708-7 December 2011
FINAL TECHNICAL REPORT
Hydrogeological Assessment Project
of the Northern Regions of Ghana (HAP)
VOLUME I
Hydrogeological
Assessment of the
Northern Regions of
S
UMMARYA thorough understanding of regional hydrogeology is the necessary basis for sustainable development of groundwater resources. This is particularly true for semi-arid areas such as northern Ghana where groundwater is currently the most feasible option and the main source for water supply in rural communities, while becoming increasingly so for urban areas. The construction of reliable wells satisfying community needs is however problematic in some areas where information is non-existent or not readily accessible and certain aspects of regional hydrogeology require further investigation. In this context, this study aims to improve groundwater resource management and development in northern Ghana through the inventory, collection and synthesis of existing hydrogeological information, as well as by targeted field work intended to complement this information. The work described in this report was carried out as part of the Hydrogeological Assessment Project (HAP) of the Northern Regions of Ghana supported by the Canadian International Development Agency.
The study area covers approximately 97 704 km2 and roughly consists of the nothern half of Ghana, which is located between Togo to the east, Ivory Coast to the west and Burkina Faso to the north. It includes the three northern regions of Ghana: Upper West, Upper East and Northern regions. With a large part of the country below 300 m of elevation, Ghana is generally considered as lowland. The climate in northern Ghana is characterized by high annual temperatures (~ 28°C) and a relatively short (~ June to Oct.) but intense rainy season with an average annual rainfall around 990 mm. Vegetation, which is mainly controlled by climate, grades from moist tropical forest in the south-west of the study area to Sudan savannah in the north. The Volta River has the largest watershed in Ghana and its tributaries drain the entire study area. The simplified geology of northern Ghana can be summarized in two main geological contexts: Precambrian basement rocks (PCB) (41 % of the total study area) and Palaeozoic rocks from the Voltaian sedimentary basin (VSB) (59 %). These contexts also serve as a basis for the delineation of the main hydrogeological contexts. In both contexts, most consolidated rocks are overlain by a weathered layer (regolith) that is generally less than 30 m thick but that can be as thick as 140 m in the Wa district in the extreme northwest part of the study area.
The inventory and collection of existing hydrogeological information that were carried out in northern Ghana notably allowed relevant publications and reports to be registered, electronically preserved and disseminated among stakeholders of the water sector. The main Geographical Information System (GIS) layers were obtained from various organizations within Ghana and from additional public sources. Hydrogeological data from 6 major stakeholder electronic databases were collected, validated and consolidated in one database to serve as a basis for future hydrogeological projects in northern Ghana. Targeted field work notably involved drilling and construction of 27 new monitoring wells that supplemented the existing Water Resources Commission monitoring well network. These wells were submitted to pumping tests and geophysical borehole logging. Groundwater level as well as groundwater quality monitoring of these wells was initiated in October 2007 and is still ongoing. Additional specific field work included rainfall, soil porewater and shallow groundwater sampling which allowed the evaluation of groundwater recharge through the chloride mass balance (CMB) method. As part of a regional geochemical characterization aimed at improving knowledge of groundwater dynamics and groundwater quality issues, groundwater from more than 100 monitoring and existing boreholes in northern Ghana was also sampled and analysed.
The synthesis and analyses of the collected data and information allowed a better definition of the two main hydrogeological contexts, the VSB and the PCB. In the latter, the lower part of the saprolite is defined as a leaky aquifer but mainly acts as a reservoir of groundwater feeding the underlying permeable fractures, which provide most of the yield. The lower part of the saprolite can also provide significant amounts of water when weathering has enhanced hydraulic conductivity. In the VSB, the main aquifer is generally located in fractured rock as the regolith is often thinner and may not store significant amounts of water. This is supported by typical borehole characteristics, regional hydrostratigraphic cross sections and interpolated regolith
thickness that were derived from the consolidated database. Variations in surface topography and regolith thickness observed on cross sections indicate the potential for localized and isolated aquifers. General statistics on key hydrogeological parameters were summarized for both hydrogeological contexts. Potential drilling success rates were also estimated using data from existing reports. Representative drilling success rates, which vary by region, range from 32 % (Tolon Kumbugu) to 82 % (Bawku East) and are on average lower for the VSB than for the PCB.
Hydrogeochemical characterization showed that groundwaters of the PCB display mixed-cations (Ca+Na+Mg) and bicarbonate (HCO3)-dominated water types. Their level of
mineralization is generally moderate, indicating rock matrix-groundwater interactions of moderate extent and proportional residence and travel time in the geological formations. In contrast, groundwaters of the VSB are generally sodic (Na-dominated) in nature. HCO3 is also
the most commonly found ion, although some groundwaters exhibit a rather Cl-dominated water type. Such water types are indicative of more advanced evolution stages and longer residence and travel time for groundwater in the VSB formations, which is supported by the longer 14C apparent ages of these more evolved water types. Heavier mineralization of groundwater occurs in phase with higher total dissolved solids contents. Comparison of groundwater geochemical data with guidelines of the World Health Organization (WHO) for drinking water shows that groundwater in the Northern Regions of Ghana is generally of good quality. In the VSB, certain groundwater quality issues arise in wells located in the geological formations of the Oti-Pendjari group, in which WHO guidelines exceedances are often recorded for arsenic, fluoride, lead, chloride and nitrates. High fluoride concentration are also observed in intrusive rocks and metamorphized Precambrian basement formations, notably in the Bongo-Bolgatanga area. Groundwater in the Obosum group may display mediocre quality with regard to iron, lead and chloride. While groundwater quality is primarly controlled by the geology and mineralogy of formations through which it flows, pumping equipments or metal casings utilized for well installation may however be responsible for elevated iron and manganese recorded at certain wells. Additionally, nitrates and nitrites contamination, which is stricly point-specific in the project area, could originate from human and agricultural activities taking place at the surface.
Groundwater recharge was initially evaluated using two methods, the soil moisture balance (SMB), based on climate data, and the unsaturated zone chloride mass balance (CMB), based on analyses of porewater extracted from soil samples collected under HAP. Estimated recharge rates for these methods range from 1.8 to 15.9 % (19-205 mm) of average annual rainfall for the SMB and 1.1 to 7.8 % (12-80 mm) of average annual rainfall for the unsaturated zone CMB. Since previous work suggests that localized recharge represents a major portion of the overall recharge, the saturated zone CMB was also implemented to better assess the overall recharge processes and magnitude. Resulting recharge estimates derived from shallow groundwater samples collected in hand-dug wells range from 0.5 to 36.5 % (5-389 mm) of average annual rainfall. Estimated groundwater production would represent a relatively small proportion of the estimated recharge, between 0.1 % and 1.3 % of average annual recharge from SMB estimates. Groundwater could thus provide a greater supply of potable water in northern Ghana, either for rural communities or small towns.
Although current groundwater production in Ghana is considered to have a minor effect on the regional water balance, efforts should be maintained and increased towards ensuring the sustainable management of groundwater resources since an increase in groundwater production is thought to be imminent. While this project has provided a basis for such an approach by synthesizing available hydrogeological data and consolidating existing databases, additional work is still required to improve knowledge and understanding of northern Ghana hydrogeology. As new hydrological and hydrogeological data becomes available and the GIS-based database instituted within the Water Resources Commission (WRC) is updated, some of the analyses carried out in this project should be revisited to confirm or refute observations reported here. For reliable and continuous datasets, groundwater level data could also be used to evaluate groundwater recharge and improve understanding recharge/discharge processes.
Continued groundwater quality monitoring will also provide a valuable dataset required for adequate groundwater resource development and management in the North of Ghana. The present final HAP technical report could be thought as the first of regular reports on the state of groundwater resources in the north of Ghana. In order to maintain the WRC hydrogeological database and continuously enhance the knowledge and understanding of groundwater resources, it is necessary to regularly report on the state of the resources (on a 5-year basis). Such reports should include the following sections: 1) an inventory of data and reports integrated in the WRC hydrogeological database, 2) an analysis of the acquired groundwater monitoring data and interpretation of temporal trends in terms of groundwater availability, 3) an update of the estimation of groundwater use and of the population access to a reliable water source, including groundwater, and 4) the identification of arising issues and concerns related to groundwater resources, and recommendation of the relevant key studies that could takle these issues. Such a report could also document the state of surface water resources, so as to form a basis for the informed management of all water resources and could also eventually cover the whole of Ghana, rather than only its northern part.
T
ABLE OFC
ONTENTSPage
1. INTRODUCTION ... 1-1
1.1 Background ... 1-1 1.2 Project Goal and Objectives ... 1-1 1.3 Methodology and Report Structure ... 1-1
2. GROUNDWATER AS WATER SUPPLY IN GHANA ... 2-1
2.1 Social and economic activities of northern Ghana ... 2-1 2.2 Population and settlement patterns ... 2-1 2.3 Water supply coverage ... 2-2 2.4 Role and importance of groundwater ... 2-4
3. DESCRIPTION OF THE STUDY AREA ... 3-1
3.1 Physiography ... 3-2 3.2 Vegetation ... 3-3 3.3 Climate ... 3-5 3.4 Hydrography ... 3-9 3.5 Soils ... 3-11 3.6 Geology ... 3-12 3.6.1 Description of main lithologies ... 3-14 3.6.2 Weathered layer ... 3-17
4. DATA COLLECTION AND FIELD WORK ... 4-1
4.1 Available data and their source ... 4-1 4.2 Development of the HAP consolidated database ... 4-2 4.2.1 Overview of data consolidation ... 4-2 4.2.2 Results ... 4-3 4.3 Field work carried out ... 4-5 4.3.1 Monitoring wells ... 4-6 4.3.2 Monitoring well development and pumping tests ... 4-10 4.3.3 Geophysical borehole logging ... 4-10 4.3.4 Groundwater level and quality monitoring ... 4-11 4.3.5 Groundwater geochemical characterization ... 4-13 4.3.6 Groundwater recharge evaluation ... 4-14
5. REGIONAL HYDROGEOLOGICAL SYNTHESIS ... 5-1
5.1 Hydrogeological setting ... 5-1 5.1.1 Hydrogeological context ... 5-1 5.1.2 Distribution of hydrostratigraphic units ... 5-2 5.1.3 Spatial distribution of regolith thickness ... 5-8 5.1.4 Groundwater levels and flow in representative basins ... 5-11 5.2 Groundwater production potential ... 5-21 5.2.1 Well and aquifer characteristics ... 5-21 5.2.2 Groundwater exploration success potential ... 5-35 5.2.3 Overview of geophysical exploration methods for groundwater ... 5-38 5.3 Groundwater recharge ... 5-41 5.3.1 Previous studies on recharge ... 5-42 5.3.2 Soil moisture balance ... 5-42
5.3.3 Chloride mass balance ... 5-52 5.4 Groundwater geochemistry ... 5-64 5.4.1 Overview of groundwater geochemistry ... 5-64 5.4.2 Approach for geochemical data analysis and interpretation ... 5-64 5.4.3 Groundwater geochemical characteristics ... 5-66 5.4.4 Groundwater geochemical evolution ... 5-72 5.4.5 Temporal variations in groundwater chemistry ... 5-96 5.4.6 Groundwater geochemistry issues ... 5-99 5.4.7 Groundwater quality ... 5-99 5.5 Groundwater resources sustainability ... 5-124 5.6 Reporting framework for state of groundwater resources ... 5-126
6. CONCLUSIONS AND RECOMMENDATIONS ... 6-1
6.1 Main results and findings ... 6-1 6.2 Data gaps and future work ... 6-5 6.3 Lessons learned ... 6-6 6.3.1 Data acquisition ... 6-6 6.3.2 Groundwater geochemistry ... 6-6 6.3.3 Standardization ... 6-6 6.3.4 Groundwater level monitoring ... 6-6
T
ABLESTable 2-1 – Safe water supply coverage data for urban & rural areas in Ghana ... 2-3 Table 2-2 – Source of drinking water in Ghana (NDPC, 2003) ... 2-4 Table 3-1 – District names for the northern regions of Ghana ... 3-2 Table 3-2 – Average annual values for selected climate variables in northern Ghana (data from MSD, 2006) ... 3-9 Table 3-3 – Comparison of results for potential evapotranspiration (pET) estimation
methods (derived from monthly data for the 1961-2005 period) ... 3-9 Table 3-4 – Description of major lithologies in northern Ghana (based on 2009 revised GGS geological map) ... 3-15 Table 4-1 – Database content following initial consolidation and validation ... 4-3 Table 4-2 – Database content following additional data collection and validation ... 4-5 Table 4-3 – Summary information for the new and existing monitoring wells ... 4-8 Table 4-4 – Geophysical logging probes used in new HAP monitoring wells ... 4-10 Table 4-5 – Water level transducers setting and installation details ... 4-13 Table 4-6 – Summary information for the unsaturated zone soil sampling for CMB ... 4-15 Table 4-7 – Summary information for the hand-dug wells sampled for CMB ... 4-18 Table 5-1 – Regolith thickness statistics by hydrogeological context ... 5-5 Table 5-2 – General information and statistics for the selected representative basins .... 5-14 Table 5-3 – Average differences between measured and estimated groundwater levels at available well locations ... 5-20 Table 5-4 – Borehole depth statistics by hydrogeological context ... 5-24 Table 5-5 – Depth to groundwater statistics by hydrogeological context ... 5-26 Table 5-6 – Borehole yield statistics by hydrogeological context ... 5-27 Table 5-7 – Specific capacity statistics by hydrogeological context ... 5-30 Table 5-8 – Transmissivity and specific capacity for pump tested monitoring wells ... 5-31 Table 5-9 – Comparison of transmissivities estimated from specific capacity data and derived from pumping test data ... 5-33 Table 5-10 – Potential drilling success statistics by hydrogeological context ... 5-37 Table 5-11 – Annual recharge rates from selected previous studies in West Africa ... 5-43 Table 5-12 – Location information for the meteorological stations considered ... 5-44 Table 5-13 – Summary of available runoff coefficients from previous studies in Ghana . 5-45 Table 5-14 – Summary of soil moisture balance annual results ... 5-47 Table 5-15 – Weighted average Cl values for 2007-2010 rainfall at selected stations .... 5-53 Table 5-16 – Summary results for recharge estimation from selected unsaturated zone profiles in northern Ghana ... 5-58 Table 5-17 – Summary results for groundwater residence time for selected unsaturated zone profiles in northern Ghana ... 5-60 Table 5-18 – Summary results for recharge estimation from shallow groundwater samples in northern Ghana ... 5-61 Table 5-19 – Groundwater recharge estimates obtained from CMB and SMB ... 5-63 Table 5-20 – Descriptive statistics of major ions in groundwater within geol. contexts .... 5-67 Table 5-21 – Descriptive statistics of major ions in groundwater within geol. groups ... 5-68 Table 5-22 – Descriptive statistics of major ions in groundwater within watersheds ... 5-71 Table 5-23 – Occurrence and spatial distribution of water types ... 5-80 Table 5-24 – Distribution of apparent 14C groundwater age among hydrogeological contexts
and water types ... 5-88 Table 5-25 – Descriptive statistics for percent modern carbon (pmc) and apparent 14C
groundwater age (y BP) ... 5-89 Table 5-26 – Descriptive statistics for arsenic in groundwater ... 5-101 Table 5-27 – Descriptive statistics for fluoride in groundwater ... 5-105 Table 5-28 – Descriptive statistics for iron in groundwater ... 5-108 Table 5-29 – Descriptive statistics for manganese in groundwater ... 5-110
Table 5-30 – Descriptive statistics for lead in groundwater ... 5-113 Table 5-31 – Descriptive statistics for chloride in groundwater ... 5-115 Table 5-32 – Descriptive statistics for nitrate in groundwater ... 5-118 Table 5-33 – Descriptive statistics for nitrite in groundwater ... 5-119 Table 5-34 – Correlation analysis results related to groundwater quality data ... 5-122 Table 5-35 – Estimated groundwater production in northern Ghana based on data from the consolidated database and Martin and van de Giesen (2005) ... 5-125
F
IGURESFigure 2-1 – Water supply coverage in Africa (data from WHO-UNICEF, 2000) ... 2-2 Figure 2-2 – Data trend on access to safe water supply for urban & rural areas of Ghana2-3 Figure 3-1 – Location map of study area (northern Ghana) ... 3-1 Figure 3-2 – Topography of northern Ghana (data from CIAT, 2004) ... 3-3 Figure 3-3 – Vegetation in northern Ghana (data from IWMI-GLOWA obtained in 2006) . 3-4 Figure 3-4 – Land use in northern Ghana (data from SWERA, 2005) ... 3-5 Figure 3-5 – Average annual rainfall pattern in northern Ghana (data from MSD, 2008) .. 3-6 Figure 3-6 – Average monthly profiles for selected climate variables in northern Ghana (data from MSD, 2006) ... 3-7 Figure 3-7 – Historical annual rainfall in northern Ghana (data from MSD, 2006) ... 3-8 Figure 3-8 – Hydrography and majors basins in northern Ghana (derived from DEM) .... 3-10 Figure 3-9 – Soils in northern Ghana (data from SRI obtained in 2006) ... 3-11 Figure 3-10 – Structural geology map of West Africa (Key, 1992) ... 3-13 Figure 3-11 – Simplified surficial geology map of northern Ghana (based on 2009 revised GGS geological map) ... 3-14 Figure 3-12 – Conceptual hydrogeological model of the weathered layer in Africa (Chilton and Foster, 1995) ... 3-18 Figure 4-1 – Spatial distribution of unique & reliable records highlighting those with all required data fields (initial database assessment) ... 4-4 Figure 4-2 – Spatial distribution of unique & reliable records highlighting those with all required data fields (final database content) ... 4-6 Figure 4-3 – Location of the new and existing monitoring wells ... 4-7 Figure 4-4 – Groundwater level fluctuations for the existing monitoring wells ... 4-12 Figure 4-5 – Groundwater level fluctuations for the new monitoring wells ... 4-12 Figure 4-6 – Location of wells sampled for the groundwater geochemical characterization4-14 Figure 4-7 – Location of the unsaturated zone soil sampling for CMB ... 4-16 Figure 4-8 – Location of the shallow groundwater sampling for CMB... 4-17 Figure 5–1 – Typical hydrostratigraphic units for main hydrogeological contexts ... 5-3 Figure 5-2 – Distribution of regolith thickness by hydrogeological context ... 5-6 Figure 5-3 – Cumulative distribution of regolith thickness by hydrogeological context ... 5-6 Figure 5-4 – Locations of hydrostratigraphic cross sections and selected boreholes ... 5-8 Figure 5-5 – Selected portion of the Wa-Bole hydrostratigraphic cross section ... 5-9 Figure 5-6 – Experimental and model variograms for kriging of regolith thickness
(Precambrian basement) ... 5-10 Figure 5-7 – Experimental and model variograms for kriging of regolith thickness (Voltaian sedimentary basin) ... 5-10 Figure 5-8 – Regolith thickness interpolated separately for the Precambrian basement and Voltaian sedimentary basin (shown by different color schemes) ... 5-11 Figure 5-9 – Location of representative basins selected for groundwater level mapping 5-12 Figure 5-10 – Experimental and model variograms for kriging of groundwater levels with river data (Nabogo basin) ... 5-15 Figure 5-11 – Experimental and model variograms for kriging of groundwater levels with river data (Tamne basin) ... 5-15 Figure 5-12 – Experimental and model variograms for kriging of groundwater levels with well and river water levels (Nabogo basin) ... 5-16 Figure 5-13 – Experimental and model variograms for kriging of groundwater levels with well and river water levels (Tamne basin) ... 5-16 Figure 5-14 – Elevation and slope classes used for the Nabogo basin ... 5-17 Figure 5-15 – Elevation and slope classes used for the Tamne basin... 5-17 Figure 5-16 – Surface elevation and estimated potentiometric surfaces (Nabogo basin) 5-18 Figure 5-17 – Surface elevation and estimated potentiometric surfaces (Tamne basin) . 5-19 Figure 5-18 – Cross sections with estimated potentiometric surfaces (Nabogo basin) ... 5-20
Figure 5-19 – Cross sections with estimated potentiometric surfaces (Tamne basin) .... 5-21 Figure 5-20 – Average borehole (bh) characteristics (Precambrian basement) ... 5-22 Figure 5-21 – Average borehole (bh) characteristics (Voltaian) ... 5-23 Figure 5-22 – Experimental and model variograms for kriging of borehole yield ... 5-28 Figure 5-23 – Interpolated borehole yield ... 5-28 Figure 5-24 – Empirical relation between specific capacity and transmissivity ... 5-35 Figure 5-25 – Potential drilling success by district in northern Ghana ... 5-36 Figure 5-26 – Theoretical resistivity sounding graph (left) with typical apparent resistivity ranges for different types of material (right) ... 5-39 Figure 5-27 – Schematic vertical electrical sounding setup for 2D resistivity imaging .... 5-40 Figure 5-28 – Soil moisture balance results at selected meteorological stations for the 2000-2005 period ... 5-48 Figure 5-29 – Comparison of WVB04 hydrograph and estimated recharge from SMB at Navrongo station ... 5-49 Figure 5-30 – General spatial trends for main climate variables based on SMB results at eight meteorological stations ... 5-50 Figure 5-31 – Relation between estimated recharge and bulk of rainfall in rainy season 5-51 Figure 5-32 – Chloride concentrations in rainfall for selected stations in 2007-2010 ... 5-53 Figure 5-33 – Particle size analysis results for selected samples from profile CMB13 ... 5-54 Figure 5-34 – Particle size analysis results for selected samples from profile CMB18 ... 5-55 Figure 5-35 – Comparison of chloride concentrations obtained from elutriation and
centrifugation methods ... 5-55 Figure 5-36 – Comparison of nitrate concentrations obtained from elutriation and
centrifugation methods ... 5-56 Figure 5-37 – Selected unsaturated zone profiles showing moisture content, chloride and nitrate in porewater ... 5-57 Figure 5-38 – Historical estimated recharge and annual rainfall variations for selected unsaturated zone profiles ... 5-60 Figure 5-39 – Distribution of groundwater recharge estimates from CMB and SMB ... 5-63 Figure 5-40 – Piper diagrams for the various geological groups studied ... 5-76 Figure 5-41 – Piper diagrams for Intrusive rocks and VSB contexts ... 5-79 Figure 5-42 – Spatial distribution of groundwater geochemical facies groups ... 5-81 Figure 5-43 – Proportions of cations and anions in Precambrian and Voltaian ... 5-82 Figure 5-44 – Correlation of electrical conductivity with total dissolved solids (TDS) ... 5-83 Figure 5-45 – Gibbs diagram (Gibbs, 1970) ... 5-83 Figure 5-46 – Geochemical graphs providing indications of ion exchange ... 5-84 Figure 5-47 – Comparison of major cations in the Voltaian and Basement contexts ... 5-85 Figure 5-48 – Concentrations of NO3 and F versus TDS ... 5-85
Figure 5-49 – Stable isotopes in rainfall and groundwater ... 5-86 Figure 5-50 – 18O versus elevation (top) and apparent 14C groundwater age (bottom) ... 5-87
Figure 5-51 – Proportion of modern carbon in groundwater analyses ... 5-91 Figure 5-52 – Interpretation of the origins of 14C in groundwater samples ... 5-91
Figure 5-53 – Trends in 13C with groundwater evolution (as indicated by HCO
3 & TDS) 5-92
Figure 5-54 – Distribution of apparent (uncorrected) 14C groundwater ages for all samples
(top) and by geological contexts (bottom) ... 5-93 Figure 5-55 – Apparent 14C groundwater ages versus well depth ... 5-93
Figure 5-56 – Apparent 14C groundwater ages by water types for all samples (top),
Precambrian (Basement) samples (middle) and Voltaian samples (bottom) ... 5-94 Figure 5-57 – Apparent 14C groundwater ages distribution by water types for all samples
(top), Precambrian (Basement) samples (middle) and Voltaian samples (bottom) ... 5-95 Figure 5-58 – Median concentrations of selected chemical parameters for the three
sampling campaigns ... 5-97 Figure 5-59 – Groundwater quality – Distribution of As values... 5-103 Figure 5-60 – Groundwater quality – Distribution of F values... 5-106
Figure 5-61 – Groundwater quality – Distribution of Fe values ... 5-109 Figure 5-62 – Groundwater quality – Distribution of Mn values ... 5-111 Figure 5-63 – Groundwater quality – Distribution of Pb values ... 5-114 Figure 5-64 – Groundwater quality – Distribution of Cl values ... 5-116 Figure 5-65 – Groundwater quality – Distribution of NO3-N values ... 5-120
A
PPENDICESAppendix A: Evapotranspiration calculation procedures Appendix B: Hydrographs for all monitoring wells
Appendix C: Summary of monthly results for soil moisture balance Appendix D: Electronic data (on USB flash drive)
Appendix D-1: Methodology used for validation of database content Appendix D-2: Historical streamflow data for selected gauging stations Appendix D-3: Hydrographs for all monitoring wells
Appendix D-4: Report on additional data collection
Appendix D-5: Report on drilling & constr. of existing monitoring wells Appendix D-6: Geophysical siting reports for HAP new monitoring wells Appendix D-7: Reports on drilling & constr. of HAP new monitoring wells Appendix D-8: Geophysical logging reports of HAP new monitoring wells
Appendix D-9: Geochemical data from the geochemical characterization program Appendix D-10: Hydrostratigraphic cross sections
Appendix D-11: Detailed report on soil moisture balance (including complete results for monthly calculations and runoff estimation)
Appendix D-12: Data and calculations for soil moisture balance (monthly) Appendix D-13: Data and calculations for soil moisture balance (daily)
Appendix D-14: Data and calculations for chloride mass balance (atmospheric Cl input estimation)
Appendix D-15: Data and calculations for chloride mass balance (groundwater recharge and residence time estimation)
Appendix E: Electronic documents (on USB flash drive)
L
IST OFA
CRONYMS ANDA
BBREVIATIONSCGIAR Consultative Group for International Agriculture Research CIAT International Centre for Tropical Agriculture
CIDA Canadian International Development Agency CMB Chloride mass balance
CSI Consortium for Spatial Information
CSIR Council for Scientific and Industrial Research (Ghana) CWSA Community Water and Sanitation Agency (Ghana) DANIDA Danish International Development Agency
DEM Digital Elevation Model
FAO Food and Agriculture Organization of the United Nations GDRC Global Runoff Data Centre
GEF Global Environment Facility
GGS Ghana Geological Survey Department
GIS Geographical Information System
GLOWA Globalen Wasserkreislauf (Global Change in the Hydrological Cycle)
GoG Government of Ghana
HAP Hydrogeological Assessment Project of the northern regions of Ghana HSD Hydrological Service Department (Ghana)
IUSS International Union of Soil Science IWMI International Water Management Institute MSD Ghana Meteorological Services Department
NASA National Aeronautics and Space Administration (USA) NDPC National Development Planning Commission (Ghana)
NGO Non-governmental organization
PCB Precambrian basement
pET Potential evapotranspiration
PSA Particle size analysis
SD Standard deviation
SMB Soil moisture balance
SRI Ghana Soil Research Institute
SRTM Shuttle Radar Topographic Mission (NASA) SWERA Solar and Wind Energy Resource Assessment UNEP United Nations Environment Programme UNICEF United Nations International Children’s Fund USDA United States Department of Agriculture VSB Voltaian sedimentary basin
WHO World Health Organization
WRC Water Resources Commission (Ghana) WRI Water Research Institute (Ghana)
WSSPS2 Water and Sanitation Sector Program Support (second phase) WTB Water table fluctuation
1. I
NTRODUCTION1.1 Background
Following a competitive process, the SNC-Lavalin Inc. and Institut National de la Recherche Scientifique – Centre Eau, Terre, Environnement (INRS-ETE) Joint Venture was selected as Canadian Executing Agency (CEA) for the Hydrogeological Assessment Project (HAP) in the northern regions of Ghana. Implemented in conjunction with the Water Resource Commission (WRC) of Ghana, the key project stakeholder, the HAP was originally a 30 month project which has been extended until March 2011.
The HAP contributed to the collection and analysis of scientific data on groundwater with the long term objective of improving groundwater resource management and development in the northern regions of Ghana, and thus played a role towards achieving the WATSAN targets set within the Ghana Poverty Reduction Strategy through “…and enhanced knowledge base and understanding of the hydrogeological conditions in the north of Ghana”.1
1.2 Project Goal and Objectives
The Project Goal is to “improve groundwater resource management and development in the
north of Ghana”. The Project Purpose is to “improve the knowledge base and understanding of the hydrogeological setting in the north of Ghana”, and to “contribute to the capacity development primarily of the personnel of the Water Resource Commission (WRC) and its partner institutions in technical and institutional aspects of groundwater planning and development”.
As such, the targeted Project outcomes are:
Increased access, by Ghanaian water resources institutions and other relevant agencies, to accurate groundwater resource information for the north of Ghana;
Enhanced technical and institutional capacity of Ghanaian water resource institutions in the collaborative management of groundwater resources, integrating the use of gender
analytical tools for analyzing planning data.
1.3 Methodology and Report Structure
This present report is the final technical report documenting the work and analyses carried out during the HAP. It covers the period from January 2006 to March 2011 and has been prepared in collaboration with the HAP WRC counterpart and the CEA Team members. This final report presents work carried out for the following activities:
Inventory and review of available data (sections 3 & 4) Complementary field work (section 4)
Hydrogeological synthesis (section 5)
An overview of the role of groundwater in water supply in Ghana is also presented in section 2 to describe the context into which this project was initiated. The data inventory and review, which were crucial to the subsequent activities, required a significant amount of time and resources to be dedicated to finding and gathering available information. This activity notably allowed the collection of key hydrogeological project reports and databases scattered in various organisations involved in the groundwater sector of northern Ghana, such as the private sector, donor agencies, NGOs and government institutions. Concurrently, scientific papers, theses and technical reports dealing directly or indirectly with the hydrogeology of northern Ghana were also collected. These documents were subsequently reviewed and catalogued into a digital library in order to preserve and facilitate their distribution to relevant stakeholders in Ghana. As
1 Memorandum of Understanding between the Government of Canada and Ghana for the Hydrogeological
for available databases, their content was validated and then consolidated into one unique database for a more efficient use.
Complementary field work was also carried out in order to fill specific data gaps identified prior to or at the beginning of the project through a consensus-building approach. This notably included construction of monitoring wells to supplement the existing monitoring network, borehole geophysical surveys and pumping tests for the new monitoring wells, groundwater sampling campaigns for new and existing wells and specific field work related to groundwater recharge evaluation.
Subsequent to these activities, a hydrogeological synthesis was prepared using the information and data collected. During the analyses and review of these data, emphasis was placed on regional hydrogeology in order to support groundwater resources development and management for the northern regions. In addition to a summary of hydrogeological contexts and typical hydraulic characteristics of aquifers, the preparation of this synthesis comprises a regional water balance, groundwater recharge evaluation and groundwater geochemical characterization.
This report is accompanied by an atlas containing maps that summarize available information, interpreted data and main results of the HAP. The maps are grouped under the following themes: physiography, hydrology, geology, and hydrogeology. For convenience, simplified versions of some of these maps are also presented in this report.
2. G
ROUNDWATER AS WATER SUPPLY ING
HANAThis chapter presents an overview of the role and importance of groundwater as a source of potable water in northern Ghana. A short summary of the socio-economical context and the population and settlement patterns in the northern regions is first presented as complementary information. Subsequently, data on water supply coverage is presented, followed by a sub-section on the role and growing importance of groundwater as water supply in Ghana.
2.1 Social and economic activities of northern Ghana
It is evident that during the pre-independence era, education suffered as a priority of human development. This educational disparity served to preserve the status of the north as labour reserve for the mines and the plantations in the south. The only effective opportunity for economic advancement during the first half of the 20th century for the people of the north was migration south or subsistence agriculture.
As northern Ghana is part of the guinea zone, it is characterized by less favorable conditions for agriculture than in the south. Not only does rainfall decreases the further north one travels in Ghana, but the rain is also concentrated in shorter periods with characteristic torrential rains. As a result of the higher run-off induced by this rainfall pattern and of soils poor in organic matter, crop production can only take place in one, often erratic, season. Yet, despite these more difficult conditions, many more households in northern Ghana are dependent on agriculture than in southern Ghana (72 % versus 44 %).
The land-locked nature of northern Ghana, linked to the Coast by a single road passing through the Kumasi metropolis, severely limits alternative economic opportunities. Only a small percentage of the workforce is made up of professionals, administrative or clerical staff, while a more significant proportion is into sales, services, and transport and production. The highest proportion of the workforce in the rural setting (~ 88%) is in agriculture while in the urban and municipalities, the majority of the workforce (~ 55%) is engaged in sales, services, and transport and production. In both the rural and urban settings, the proportion of males in agriculture and related activities in the north of Ghana is higher than that of females.
2.2 Population and settlement patterns
Northern Ghana constitutes about a third of the country’s land mass and accommodates about 20% of the population. The area is characterized by dispersed settlement. The pattern derives basically from a system of fixed cultivation, which is rare in tropical areas. The layout of a house reflects family structure; similarly, patterns of land holdings reflect stages in community evolution. Originally circular, home-farms are divided by inheritance into radial strips, diminishing in size over the generations. Settlement dispersal commences with domestic fission within agnatic lineages. Society is strongly patriarchal, and ancestor-worship has a powerful influence. Study of lineage affiliation indicates a spread of settlement from ancestral core areas, usually in defensible hilly areas. Because of high per capita cost of provision of services, there is a need to concentrate settlement, if any degree of modern development is to be achieved. Lack of a major cash crop to finance local development is one obstacle, but greater still are the social difficulties confronting any attempt to re-cast the settlement pattern.
2.3 Water supply coverage
Water supply coverage in Ghana would be around 64 % of the total population according to data from the World Health Organization and UNICEF (2000) (Figure 2-1). From the same report, it is stated that 87 % of the urban population (~ 6.7 M inhabitants) and 49 % (~ 6.1 M inhabitants) of the rural population had access to safe2 and adequate water supply in 2000. Figure 2-1 – Water supply coverage in Africa (data from WHO-UNICEF, 2000)
2 Definition of safe access: 1) CWSA: All-year-round potable water supply of 20 L per capita per day for point
sources and 45 L per day for small towns (piped schemes); facility should be within 500m walking distance from farthest house in community and should serve 300 persons per borehole/standpipe and 150 persons for hand dug wells; 2) WHO-UNICEF: Availability of at least 20 L per person per day from an "improved" source within 1km of user's dwelling (N.B.: see WHO-UNICEF, 2000 for “improved” source definition).
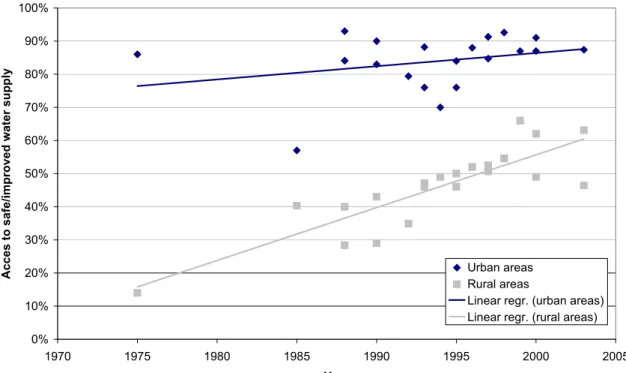
There are, however, inconsistencies concerning water supply coverage data in Ghana (Table 2-1). For instance, data from the World Resources Institute (2003) indicate that percentages of households that had access to safe water in 2000 were respectively of 91 and 62 % in urban and rural areas. While not always in agreement, available data clearly indicates that mean water supply coverage has been steadily increasing in both rural and urban areas for the last few years, but that water supply coverage is consistently lower in rural areas (Figure 2-2). Figure 2-2 – Data trend on access to safe water supply for urban & rural areas of Ghana
0% 10% 20% 30% 40% 50% 60% 70% 80% 90% 100% 1970 1975 1980 1985 1990 1995 2000 2005 Year Acces to safe/impr
oved water sup
p
ly
Urban areas Rural areas
Linear regr. (urban areas) Linear regr. (rural areas)
Table 2-1 – Safe water supply coverage data for urban & rural areas in Ghana
Year
Access to safe water supply
(% of population) References Overall Urban Rural
1975 - 86 % 14 % International Monetary Fund, 2000 1985 - 57 % 40 % International Monetary Fund, 2000
1988 - - 84 % 93 % 28 %40 % World Health Organisation and UNICEF, 2004 African Development Bank, 2004 1990 - - 83 % 90 % 43 %29 % World Health Organisation and UNICEF, 2000 Food and Agriculture Organization, 1995 1992 51 % 79 % 35 % Centre for Policy Analysis, 2002
1993 - - 76 % 88 % 46 %47 % African Development Bank, 2004 World Health Organisation and UNICEF, 2004 1994 - 70 % 49 % African Development Bank, 2004
1995 - - 76 % 84 % 46 %50 % International Monetary Fund, 2000 World Health Organisation and UNICEF, 2004 1996 - 88 % 52 % African Development Bank, 2004
1997 67 % 62 % 91 % 85 % 53 %51 % Centre for Policy Analysis, 2002 International Monetary Fund, 2005
1998 - 93 % 55 % World Health Organisation and UNICEF, 2004 1999 - 87 % 66 % African Development Bank, 2004
2000 - - 91 % 87 % 62 %49 % World Resources Institute, 2003 World Health Organisation and UNICEF, 2000 2003 74 % - 87 % - 63 %46 % International Monetary Fund, 2005 National Development Planning Commission,2004
2.4 Role and importance of groundwater
Groundwater plays a vital role as the source of water for supply schemes throughout Ghana since it is well suited to meet the dispersed demand inherent in settlement patterns of rural populations. Generally of good quality (microbiological and chemical), groundwater can usually be available relatively close to demand and its development as rural water supply is cheaper when compared to surface water supply schemes. Furthermore, deep groundwater sources generally have a slow response to changes in rainfall, making it generally less vulnerable to drought than surface water bodies such as lakes and rivers.
Traditionally, various sources have been used for domestic water supply in Ghana, including streams, rivers, lakes, ponds, dug-outs, impoundment reservoirs, springs, rain harvesting and hand-dug wells (Dapaah-Siakwan and Gyau-Boakye, 2000). Some problems are however associated with those sources, such as contamination of surface water (bacteriological or chemical), insufficient quantity of water from rain harvesting or from hand-dug wells in dry season.
Considering problems associated with alternate sources of water and the fact that groundwater is often considered one of the most economical and feasible sources of potable water supply, groundwater resources are being increasingly utilized in Ghana in order to meet the rising water supply needs. In fact, following the 1969-1970 Water Resources Sector Studies commissioned by the Government of Ghana, it became official policy to use groundwater for water supply in rural communities with less than 2 000 inhabitants (Gyau-Boakye and Dapaah-Siakwan, 1999). Following recommendations from the same source, rural communities with 2 000-5 000 inhabitants were to be supplied with piped systems using surface water or groundwater.
Although it is difficult to state the exact percentage of the national population depending on groundwater resources from available information, data from the 1998-1999 Ghana Living Standards Survey (GLSS) indicates that at least 33.9 % of the overall population relies directly on hand-dug wells and boreholes (i.e. drilled wells) fitted with handpumps (see Table 2-2) (NDPC, 2003). The total number of wells in Ghana would exceed 60 000, with approximately 15 000 boreholes and 45 000 hand-dug wells (Agyekum, 2004). The percentage of population depending on groundwater resources is however probably higher since the origin of water (i.e. surface water or groundwater) is usually not specified for piped systems and natural sources (e.g. springs, surface water or well fields …). Other water-supply related data derived from research in the Ghanaian portion of the Volta River Basin reveals that 37.6 % of the population living in the Basin (estimated to 6.91 M) was dependant on groundwater in 2001 (all sources included – piped systems, boreholes, hand-dug wells) (Martin and van de Giesen, 2005). While the latter percentage may not be representative of the whole country, it can give, with the 1998-1999 GLSS value, a general idea of the range to be expected.
Table 2-2 – Source of drinking water in Ghana (NDPC, 2003)
Source of drinking water Ghana Urban Rural (> 5000 persons) (< 5000 persons)
Pipe-borne 41.6 % 80.3 % 18.8 %
Borehole / well 33.9 % 10.8 % 47.2 %
Natural sources 24.6 % 8.8 % 33.9 %
Moreover, rural communities account for an increasingly larger fraction of the overall population dependant on groundwater. According to Gyau-Boakye (2001), approximately 52 % of the rural population relied on groundwater resources (all sources included) for water supply in 1998 as compared to a proportion of 41 % estimated in 1984. While groundwater is particularly important in rural areas, its role is also crucial in some urban areas of Ghana such as the Upper East and Upper West Regions, where more than 80 % of the urban population is served by groundwater-fed piped systems (Martin and van de Giesen, 2005).
As for any type of water supply, some difficulties arise from the development of groundwater resources in Ghana. Because of low population density and poor economic base, point sources such as hand-dug wells and boreholes fitted with handpumps are mainly utilized in groundwater development. As mentioned earlier, low drilling success3 rate (below 50 %) and high variability of well yields are frequent in some regions due to various factors such as lacking or unavailable information on hydrogeological framework or simply because of the nature and complexity of the geological and hydrogeological environments. Overexploitation of aquifers has also been reported in some regions as a result of excessive reliance on groundwater resources, poor design criteria and inadequate abstraction rate (Gyau-Boakye, 2001). Although chemical and bacteriological quality of groundwater in Ghana is generally acceptable, localized problems, from natural or anthropogenic origin, have been identified. The most notable problems include high concentrations of iron (causing aesthetic problems mostly), manganese, and fluoride (causing health problems such as dental and possibly skeletal fluorosis) (Gyau-Boakye, 2001). In addition to these problems, other factors affecting the water supply sector in general include insufficient technical and managerial water sector personnel and inadequate or insufficient regulations of water resources development and management. There has however been recent progress on this front as a comprehensive national water sector policy was published in June 2007 (GoG, 2007) to integrate and harmonize the various activities of key stakeholder institutions. In September 2006, regulations were also approved concerning the mandatory registration of well drillers for groundwater development (WRC, 2006).
3 The success rate generally refers to the number of successful boreholes divided by the total number of
boreholes drilled; the definition of a successful borehole is variable but handpump yield (i.e. ~ 13 L/min) is often considered as the minimum yield for success (Dapaah-Siakwan and Gyau-Boakye, 2000).
3. D
ESCRIPTION OF THE STUDY AREAThis section presents the main characteristics of the study area and is aimed at complementing the hydrogeological synthesis presented in section 5. Data and information used to prepare this section were collected concurrently to existing hydrogeological data and were usually readily available (see section 4.1).
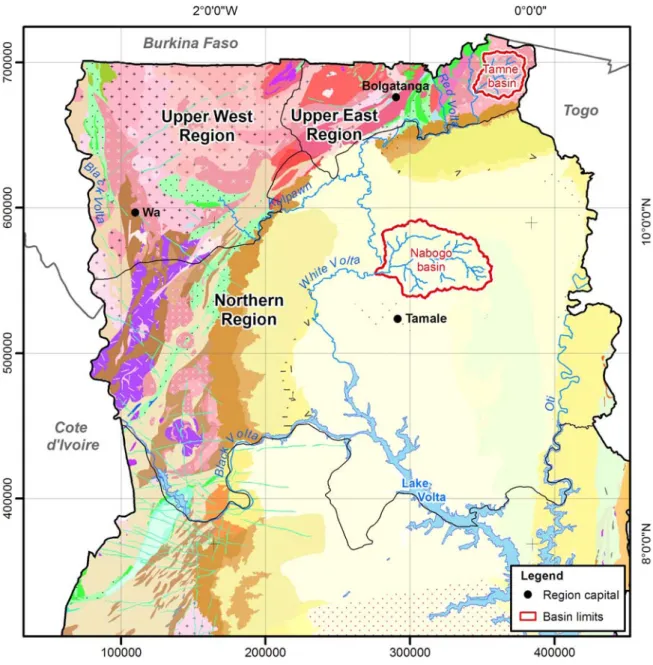
Ghana is located on the south central coast of West Africa between latitudes 4°44'N and 11°11'N and longitudes 3°15'W and 1°12'E. The study area roughly consists of the upper half of the country and is located between latitudes 7°58'N and 11°11'N and longitudes 2°57'W and 0°34'E (Figure 3-1). It comprises the three northern regions of Ghana, namely the Upper East Region, Upper West Region and Northern Region, which respectively account for 9 %, 19 % and 72 % of the total study area (97 704 km2). The northern regions are bordered by Côte d’Ivoire to the west, Burkina Faso to the north, Togo to the east and the Volta and Brong-Ahafo regions of Ghana to the south.
Figure 3-1 – Location map of study area (northern Ghana)
As of 2000, the respective population of the Upper East, Upper West and Northern regions was 920 089, 576 583 and 1 820 806, with 73 % to 84 % being rural (Ofei, 2003). Rural communities are scattered throughout the study area except for a few zones such as protected areas or floodplains where agriculture is not possible or not viable. The urban population is mostly concentrated in the regional capitals, respectively Bolgatanga, Wa and Tamale. Table 3-1 lists the official districts in these regions as of 2011 (http://ghanadistricts.com) and the corresponding old districts that existed at the beginning of the project. As some of the official districts were recently created, official district limits were not yet available in electronic format so that corresponding old district limits were used for analysis purposes.
The northern regions are relatively underdeveloped in comparison to the other regions of Ghana, with about 75 % of the active population engaging in food crop farming. As of 1999, poverty by income measure was highest in the three regions of northern Ghana (84 % in Upper
West, 88 % in Upper East and 69 % in Northern) with food crop farmers having the highest incidence of poverty (NDPC, 2003). Environmental and social indicators for northern Ghana are below national average notably for education, health, nutrition and access to potable water (CIDA, 1999). While efforts have been made to transfer power and responsibilities from central to local government in order to improve conditions, progress has been slow and the positive impact of economic growth and development at national scale is not as significant in the north as it is in the south.
Table 3-1 – District names for the northern regions of Ghana
Official district names (2011) Corresponding district names (2005) Region District name District ID District name District ID
Northern
Bole 06-01 Bole 06-01 Bunkpurugu-Yunyoo 06-02 East Mamprusi 06-03
Central Gonja 06-03 West Gonja 06-10
Chereponi 06-04 Saboba Chereponi 06-06
East Gonja 06-05 East Gonja 06-02
East Mamprusi 06-06 East Mamprusi 06-03
Gushiegu 06-07 Gushiegu Karaga 06-04
Karaga 06-08 Gushiegu Karaga 06-04
Kpandai 06-09 East Gonja 06-02
Nanumba North 06-10 Nanumba 06-05
Nanumba South 06-11 Nanumba 06-05
Saboba 06-12 Saboba Chereponi 06-06
Savelugu Nanton 06-13 Savelugu Nanton 06-07
Tamale Metropolitan 06-14 Tamale 06-08
Sawla-Tuna-Kalba 06-15 Bole 06-01
Tolon Kumbungu 06-16 Tolon Kumbungu 06-09
West Gonja 06-17 West Gonja 06-10
West Mamprusi 06-18 West Mamprusi 06-11
Yendi 06-19 Yendi 06-12
Zabzugu Tatale 06-20 Zabzugu Tatale 06-13
Upper East
Bawku Municipal 07-01 Bawku East 07-01
Bawku West 07-02 Bawku West 07-02
Bolgatanga Municipal 07-03 Bolgatanga 07-03
Bongo 07-04 Bongo 07-04 Builsa 07-05 Builsa 07-05
Garu-Tempane 07-06 Bawku East 07-01
Kassena Nankana West 07-07 Kassena Nankana 07-06
Kassena Nankana 07-08 Kassena Nankana 07-06
Talensi-Nabdam 07-09 Bolgatanga 07-03
Upper West
Jirapa 08-01 Jirapa Lambussie 08-01
Lambussie Karni 08-02 Jirapa Lambussie 08-01
Lawra 08-03 Lawra 08-02 Nadowli 08-04 Nadowli 08-03
Sissala East 08-05 Sissala 08-04
Sissala West 08-06 Sissala 08-04
Wa Municipal 08-07 Wa 08-05
Wa East 08-08 Wa 08-05
Wa West 08-09 Wa 08-05
3.1 Physiography
Three broad physiographic regions can be distinguished in northern Ghana: 1) savannah high plains covering all of Upper East and Upper West regions and the western part of the Northern Region, 2) Voltaian sedimentary basin (VSB) covering most of the remainder of the Northern Region and 3) scarps bordering the VSB, also found within the Northern Region. The whole country is generally classified as lowland, with less than 10 % of the country above 300 m
elevation. In the study area, the highest areas are located around Gambaga and Damongo scarps while the lowest areas are found in the middle of the VSB (Figure 3-2). Hills can rise as much as 300 m above plains and valleys (Gill, 1969) and inselbergs can mostly be found in the northwest part of the study area.
Figure 3-2 – Topography of northern Ghana (data from CIAT, 2004)
3.2 Vegetation
From south to north, vegetation grades from equatorial rain forest in the extreme southwest of the country, through a transition zone to a belt of moist semi-deciduous tropical forest. Towards the north, the semi-deciduous tropical forest grades into another transition zone and eventually into the Guinea savannah, where woodland predominates over grassland. The latter zone covers most of northern Ghana (Figure 3-3) except for a small portion in the extreme northeast, where it is gradually replaced by the Sudan savannah, where grassland prevails over woodland (Gill, 1969).
In northern Ghana, three major land uses can be distinguished: cultivated savannah woodland (open and closed) (58 % of total land area), savannah woodland (open and closed) (25 %), grassland with/without scattered trees and shrubs (7 %) (Figure 3-4).
Figure 3-3 – Vegetation in northern Ghana (data from IWMI-GLOWA obtained in 2006)
The woodland savannah is characterized by drought-resistant trees such as acacias, mango trees, shea nut trees, neems and baobabs. Land classified as cultivated is usually used for small-scale rain-fed agriculture in the form of compound or bush farming. Compound farms are located near the farmer’s homes and crops grown usually include maize, vegetables and tobacco. In bush farms, which are generally located within 10 km of the community, a mixture of cereals/vegetables crops notably including maize, sorghum, millet, rice, yam, cassava and groundnuts are generally cultivated. Irrigated agriculture is also practiced in northern Ghana, though the irrigated land area only occupied about 30 km2 as of 2000 (Braimoh, 2004). Not all
land classified as cultivated is actually farmed as the small scale rain-fed plots are usually scattered among tree vegetation or grassland used for livestock grazing. Other minor land use classes notably include riverine savannah vegetation along major watercourses, grass and herb, and unclassified zones. Rock outcrops have been reported by the Ghana Geological Survey Department (GGS) field personnel but would be generally be scarce within the study area, scarp zones excepted.
Figure 3-4 – Land use in northern Ghana (data from SWERA, 2005)
3.3 Climate
In the northern regions, as throughout Ghana, the climate is characterized by high temperatures and a variable amount, duration and seasonal distribution of rainfall. These characteristics are typical of sub-tropical, semi-arid climate zones in West Africa. Rainfall in the north of Ghana generally decreases with increasing latitude and its distribution throughout the year is uneven. Figure 3-5 shows the rainfall pattern based on annual average rainfall for the 1971-2007 period at 140 meteorological stations throughout Ghana (N.B.: 24 of these stations are located in the study area). For the study area, annual rainfall ranges from around 800 mm in the extreme north (Bongo) to 1 250 mm in the south-eastern portion of the Northern Region (Salaga). Monthly climate data were also obtained from the Ghana Meteorological Services Department (MSD) for the 1961-2005 period for six meteorological stations: Bole, Kete-Krachi, Navrongo, Tamale, Yendi, Wa (Figure 3-6). Typically, the northern regions are characterized by a single rainy season from late May to October. The intensity and duration of the rainy season varies with latitude and the extreme north usually experiences a shorter and more intense rainy season than the south. Annual rainfall values are characterized by standard deviations ranging from 15-20 % of rainfall. Work by Friesen et al. (2005) in the Volta River basin indicates similar but slightly lower inter-annual variability with a coefficient of variation of 8 %. For most stations, dry periods of the early 1970s and 1980s can be differentiated (Figure 3-7).
Figure 3-5 – Average annual rainfall pattern in northern Ghana (data from MSD, 2008)
(N.B.: data from meteorological station with names shown in bold were used to estimate recharge using the soil moisture balance method - see Section 5.3.2)
Temperatures in northern Ghana are relatively high with annual averages ranging from 27 °C to 29 °C and annual extremes ranging from about 17 °C to 40 °C. Due to the rather low relief, the major influence on temperature is the distance to the sea. Temperatures are thus cooler in the south than in the north. Based on monthly data from the Ghana Meteorological Services Department (MSD) for the 1961-2005 period, the highest monthly mean temperature generally occurs in March or April. Temperatures usually start to decrease at the onset of the rainy season, around May or June, to reach an annual low in December or January (Figure 3-6). Potential evapotranspiration (pET) was estimated using the Penman-Monteith method recommended by the FAO as its validity has been demonstrated in humid and dry climates (Allen et al., 1998). For the five meteorological stations located in the northern regions, annual average potential evapotranspiration rates derived from monthly data range from 987 to 1 192 mm per year (Table 3-2 and Figure 3-6).
For comparison purposes, the Thornthwaite method was also applied to monthly data. This method is based on air temperature rather than radiation used by the Penman-Monteith
method. Results for both methods are compared in Table 3-3. They show a relatively good correlation (coefficient of determination between 0.69-0.90) but the Thornthwaite method yields much higher values in dry months than the Penman-Monteith method. This discrepancy between methods can be explained by the assumptions made by the Thornthwaite method. As this method is based on air temperature, it considers that the Bowen ratio (sensible heat flux over latent heat flux) remains constant throughout the year. The release of latent heat is however variable in time, being generally smaller in dry months when readily available water is limited. It follows that the Thornthwaite method would tend to overestimate potential values in dry periods experienced in arid and semi-arid regions. A previous study evaluating four evapotranspiration methods in Ghana (Acheampong, 1986) revealed similar observations regarding the Thornthwaite method. Equation parameters and the complete calculation procedure used for each pET estimation method are defined in Appendix A.
Figure 3-6 – Average monthly profiles for selected climate variables in northern Ghana (data from MSD, 2006) 0 100 200 300 J F M A M J J A S O N D R a in fa ll a n d e v a p o tr a ns pi ra ti on ( m m ) 0 10 20 30 40 Te m p er at u re ( °C) Navrongo 0 100 200 300 J F M A M J J A S O N D R a in fa ll a n d e v a p o tr a ns pi ra ti on ( m m ) 0 10 20 30 40 Te m p er at u re ( °C) Wa 0 100 200 300 J F M A M J J A S O N D R a in fa ll a n d e v a p o tr a ns pi ra ti on ( m m ) 0 10 20 30 40 Te m p er at u re ( °C) Tamale 0 100 200 300 J F M A M J J A S O N D R a in fa ll a n d e v a p o tr a ns pi ra ti on ( m m ) 0 10 20 30 40 Te m p er at u re ( °C) Yendi 0 100 200 300 J F M A M J J A S O N D R a in fa ll a n d e v a p o tr a ns pi ra ti on ( m m ) 0 10 20 30 40 Te m p er at u re ( °C) Bole 0 100 200 300 J F M A M J J A S O N D R a in fa ll a n d e v a p o tr a ns pi ra ti on ( m m ) 0 10 20 30 40 Te m p er at u re ( °C) Kete-Krachi
Rainfall Avg. temperature
Figure 3-7 – Historical annual rainfall in northern Ghana (data from MSD, 2006) 0 500 1000 1500 2000 2500 1960 1965 1970 1975 1980 1985 1990 1995 2000 2005 A n n u al r ai n fa ll ( m m ) YENDI 0 500 1000 1500 2000 2500 1960 1965 1970 1975 1980 1985 1990 1995 2000 2005 A n n u al r ain fa ll (m m ) NAVRONGO 0 500 1000 1500 2000 2500 1960 1965 1970 1975 1980 1985 1990 1995 2000 2005 A n n u al r ain fa ll (m m ) BOLE 0 500 1000 1500 2000 2500 1960 1965 1970 1975 1980 1985 1990 1995 2000 2005 A n n u al r ain fa ll (m m ) TAMALE 0 500 1000 1500 2000 2500 1960 1965 1970 1975 1980 1985 1990 1995 2000 2005 A n n u al r ain fa ll (m m ) WA 0 500 1000 1500 2000 2500 1960 1965 1970 1975 1980 1985 1990 1995 2000 2005 Year A n n u al r ain fa ll ( m m ) KETE-KRACHI
Table 3-2 – Average annual values for selected climate variables in northern Ghana (data from MSD, 2006)
Station Navrongo Wa Tamale Yendi Bole Kete-Krachi
Region Upper E. Upper W. Northern Northern Northern Volta Rainfall (mm/y) 987 1 007 1 083 1 192 1 069 1 346
Potential evap. (mm/y) 1 723 1 770 1 839 1 710 1 541 1 606
Avg. temp. (°C) 28.9 27.9 28.3 27.9 27.1 27.8
Min. temp. (°C) 19.3 19.5 18.7 19.2 16.6 20.7
Max. temp. (°C) 39.3 37.4 38.2 37.7 36.6 35.8
Min. rel. humidity (%) 40.3 44.0 44.6 46.7 50.1 54.9 Max. rel. humidity (%) 68.8 71.8 75.9 78.0 83.9 88.9
Sun hours (h) 7.8 7.6 7.3 7.2 7.0 7.0
Wind speed (m/s) 0.91 1.25 1.57 1.26 0.84 1.10
Table 3-3 – Comparison of results for potential evapotranspiration (pET) estimation methods (derived from monthly data for the 1961-2005 period)
Station Navrongo Wa Tamale Yendi Bole Kete-Krachi
Region Upper E. Upper W. Northern Northern Northern Volta pET ± SD (mm/y) (Penman-Monteith) 1 723 ± 145 1 770 ± 123 1 839 ± 127 1 710 ± 235 1 541 ± 98 1 606 ± 78 pET ± SD (mm/y) (Thorthwaite) 2 369 ± 286 2 028 ± 221 2 161 ± 253 2 014 ± 204 1 801 ± 171 1 987 ± 193 3.4 Hydrography
The whole project area is drained by the Volta River system which comprises the Red, Black and White Volta Rivers as well as the Oti River. These rivers, together with their basins (or watersheds) and sub-basins, are shown in Figure 3-8 and were derived from the Digital Elevation Model using the ArcGIS software hydrology functions as the basins initially obtained from the SWERA Geospatial Toolkit contained errors in some areas.
The Volta River has the most extensive basin in Ghana, draining almost three-quarters of the total land area. The river itself is also the longest in the country with a main channel of approximately 1 400 km (Andreini et al., 2000). It flows out to sea near the town of Ada, in southeast Ghana and its vast basin of about 400 000 km2 extends over five other countries:
Côte d’Ivoire, Burkina Faso, Mali, Togo and Benin. Downstream of the confluence of the Black Volta and White Volta Rivers, the river is usually referred to as the Lower Volta River. The high annual variability in the amount of rainfall causes seasonal variations in the flow of many rivers, especially those in the northern regions where many streams and rivers are intermittent. River valleys are generally bordered by alluvial terraces although some rivers are guided by structural features such as escarpments.
The Black Volta which originates from Burkina Faso flows north-eastwards and then turns south and eventually becomes the border, first between Ghana and Burkina Faso and then between Ghana and Côte d'Ivoire. The Red Volta originates in the central part of Burkina Faso, near Ouagadougou, and flows south-eastwards to the border with Ghana. After crossing the border, it joins the White Volta. The White Volta originates in the north of Burkina Faso and also flows south-eastwards to the border with Ghana. Afterwards, it flows west and then more or less south into Lake Volta. In Burkina Faso, the Black, Red and White Volta are respectively known as the Mouhoun, Nazinon and Nakanbe. The Oti River takes its source in Benin and flows north-eastward at first and then sharply turns west and eventually southwest passing through Togo. It serves as border between Ghana and Togo for approximately 100 km before entering Ghana near Chereponi in the Northern Region. While some tributaries of the Volta River in
northern Ghana are intermittent during the dry season, overflow often occurs in many streams and rivers during the wet season.
The flow of the Volta River itself is regulated since the construction of the Akosombo dam in the 1960s for hydro-electricity. The mean annual discharge of the river was estimated at 35 billion m3 before the construction of the dam and at 31 billion m3 after (Andreini et al., 2000). The reservoir (Lake Volta) created by this dam and the younger Kpong dam (downstream of Akosombo) is one of the largest artificial lakes in the world covering roughly 8 500 km2 at full capacity. Other dams are also present upstream on the White Volta (e.g. Kulpawn, Sisilli, Tono, Vea) and the Black Volta (e.g. Bui). Gauging stations operated by the Ghana Hydrological service Department (HSD) are located on the main rivers or their main tributaries: Black Volta (Bui, Bamboi stations), White Volta (Daboya, Kpasenkpe, Nabogo, Nawuni, Paga, Pwalugu, Yarugu stations), Red Volta (Nangodi station), Oti (Saboba station), Sisilli (Nakong, Wiase stations), Nasia (Nasia station) and Kulpawn (Yagaba station). The dataset provided by the HSD for these gauging stations covers the period from early 1950’s to 2008 but however contains multiple data gaps of variable time length (from days to decades) (Appendix D on USB flash drive). In some cases, it was possible to fill data gaps from another streamflow dataset obtained from Global Runoff Data Centre (GRDC).
3.5 Soils
In the north of Ghana, weathered products of bedrock generally constitute the parent materials from which the soils are formed. The mineralogy of the parent rock, the degree of weathering and the different hydrological conditions encountered (e.g. along slopes) have a significant influence on the texture of the soils. Over granites and sandstones, soils will tend to develop relatively coarse textures (from coarse sands to loams) while phyllites, shales and mafic rocks will weather into finer material such as silts and fine sands. Soils developed in valley bottoms and floodplains also tend to have finer textures that can vary from sandy loams to clays. In many areas, the alternation between wet and dry conditions can favour the hardening of subsoils4 through leaching of minerals. The organic matter content of the soils is usually low
(< 2 %) as a consequence of high temperatures and annual burning of vegetation. Figure 3-9 – Soils in northern Ghana (data from SRI obtained in 2006)
According to data from the Ghana Soil Research Institute (SRI) (Figure 3-9), soils found in the northern regions of Ghana are predominantly: lixisols, leptosols, plinthosols, acrisols and
4 Soil portion between the layer used for farming (i.e. topsoil) and the depth to which most of the plant roots