HAL Id: hal-00993377
https://hal.archives-ouvertes.fr/hal-00993377
Submitted on 20 May 2014HAL is a multi-disciplinary open access archive for the deposit and dissemination of sci-entific research documents, whether they are pub-lished or not. The documents may come from teaching and research institutions in France or abroad, or from public or private research centers.
L’archive ouverte pluridisciplinaire HAL, est destinée au dépôt et à la diffusion de documents scientifiques de niveau recherche, publiés ou non, émanant des établissements d’enseignement et de recherche français ou étrangers, des laboratoires publics ou privés.
Prediction of the dynamic response of a plate treated by
particle impact damper
Moez Trigui, Emmanuel Foltête, Noureddine Bouhaddi
To cite this version:
Moez Trigui, Emmanuel Foltête, Noureddine Bouhaddi. Prediction of the dynamic response of a plate treated by particle impact damper. Proceedings of the Institution of Mechanical Engi-neers, Part C: Journal of Mechanical Engineering Science, SAGE Publications, 2013, pp.1 - 16. �10.1177/0954406213491907�. �hal-00993377�
“PREDICTION OF THE DYNAMIC RESPONSE OF A PLATE TREATED BY PARTICLE IMPACT DAMPER”
Authors: Moez TRIGUI a,*, Emmanuel FOLTETE b, Noureddine BOUHADDI b.
Affiliation
(a) Unit of Dynamics of Mechanical Systems, National School of Engineers of Sfax, BP 1173 -
3038 - Sfax - Tunisia, Tel. 00 216 98 38 19 13, Fax. 00 216 74 27 55 95
(b) Department of Applied Mechanics, FEMTO-ST Institute, 24 rue de l’Epitaphe - 25000,
Besançon - France Tel. (+33) 3 81 66 60 32, Fax. (+33) 3 81 66 67 00
Corresponding Author Dr. Moez TRIGUI
Dynamics of Mechanical Systems Research Unit Mechanical Engineering Department
National School of Engineers of Sfax Sfax University
B.P W. 3038 Sfax – TUNISIA
Tel. 0021698637156 Fax. 0021674275595 E-mail: moez.trigui@gmail.com
Abstract
In this paper, an experimental characterisation of a particle impact damper (PID) under periodic excitation is investigated. The developed method allows the measurement of damping properties of PID without the supplementary use of a primary structure. The passive damping of PID varies with the excitation frequency and its design parameters. The nonlinear damping of PID is then interpreted as an equivalent viscous damping to be introduced in a finite element model of a structure to predict its dynamic response. The results of numerical
simulations are in good agreement with those of experiment and show the relevance of the developed method to predict the dynamic behaviour of a structure treated by PID’s.
Key Words: Vibration / Particle / Impact / Damping / Loss factor / Dynamic Response. Nomenclature:
g - Gravity, d - Gap,
m - Total mass of particles, M - Mass of the enclosure,
( )
f t - Excitation force,
ω
- Frequency of excitation,( )
e
C
ω
- Linear viscous damping coefficient, P - Total power of PID,( )
η ω - Loss factor,
{ }
X - Nodal displacement of the plate,[ ]
C - Proportional damping matrix of the plate, 0( )
d
C ω
- Contribution in damping of PIDs,
[ ]
M - Mass matrix of both plate and the enclosures,p
M
- Mass matrix of the plate,
[ ]
Md - Mass matrix of the enclosures,1. Introduction
Particle impact damping (PID) is a passive means of providing high damping to the vibrating structure. This process consists to introduce metallic particles in voids or enclosures attached to the primary structure. When the structure moves, the particles collide with each other and with the enclosure causing damping through friction and inelastic collisions. The dynamic response of the primary structure is modified by such an additional damping and mass.
Despite the increasing use of particle damping technology (Panossian et al., 2008 [1];
Simonian et al., 2008 [2]) the modelling of PID remains difficult due to a number of
problems. One of the principal complexities in using PID is the remarkable nonlinear behaviour making them complicated to design (Popplewell et al., 1991 [3]; Papalou et al.,
1998 [4]; Bapart et al., 1985 [5]; Park et al., 2009 [6] and Cempel et al., 1993 [7]). The
design problem is explained by the large number of parameters, such as the geometry of the enclosure, the shape and material of particles, the amount of free space (gap size or volume fraction) given to the particles, the level of displacement and acceleration of the primary structure.
In order to circle these issues, most of the modelling effort has been concentrated in the simplification of the problem, without considering what is happening internally in the PID in detail. As an example, many authors model a bed of particles as a single particle (Marhadi et
al., 2005 [8]), estimating the performance of the PID on this effective particle. Another way to
simplify the problem is to linearise the model for different operating conditions, as Liu et al
(2005) [9] who estimated the damping contribution of PID as an equivalent linear viscous
damping. It is noticed that most of the previous investigations characterise the performance of the PID by the use of a primary structure. Therefore, the effectiveness of PID is determined by analysing the frequency response of the structure around its resonance frequencies. This technique allows for understanding the energy dissipation mechanisms of the PID, however,
the identified damping cannot be explored in other structures. This is because the dissipation mechanism of the underlying global model is different from one model to the next one. While it is possible to calculate the correct dissipated energy from any equivalent model at each operating point it is more satisfactory to extract the information directly from vibration data. Such a method is the Fourier Transform-based power flow theory used by Yang (2003) [10] and Wong (2009) [11]. This method allows the measurement of both the mass and damping properties of the PID without the supplementary use of a primary structure. In this application, the average dissipated power (known as active power) and maximum trapped power (known as reactive power) by the vibrating particle damper can be estimated directly via the cross spectrum of the force and response signal of the PID. The power flow method is, however, a time-averaged method and requires the excitation of the damper to be periodic. The latter method is attractive; firstly, it allows the characterisation of the design variables to be done quickly. Secondly the determined damping coefficient which depends on the excitation level can be used in any primary structure.
In this work, the power flow method is used to characterise the damping of a vertical PID under harmonic excitation. The loss factor of the particle damper is characterised experimentally with respect to both the frequency and the level of displacement. Then the damping of the characterised PID is converted into an equivalent linear viscous damping coefficient for different levels of excitation. In the second part of this investigation, the numerical study of a plate treated with PIDs was performed; its purpose was to predict the dynamic behaviour of a primary structure using the loss factor determined by power measurements. An experimental study was conducted to verify the capacity of this method to predict the contribution of PID in the damping of the primary structure.
2. Experimental characterisation of the particle impact damper
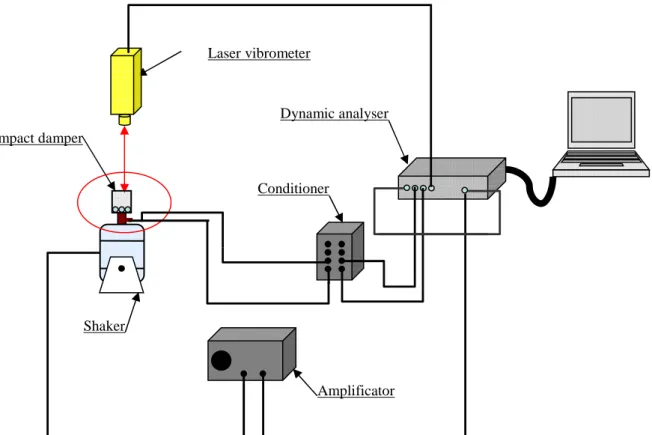
A schematic of the experimental apparatus is shown in Figure 1. The characterised PID is similar to the one used by Yang (2003) [10] and Wong (2009) [11]. It consists of a cylindrical casing (enclosure) with a regulated top lid. Indeed, four screws are used to adjust the gap d which represents the distance between the top of the bed of particles and the ceiling
of the enclosure (Figure 2). The total mass of the enclosure is 23 x 10-3 Kg. The enclosure
which is partially filled with lead particles was attached to a force cell which was itself attached to an electromagnetic shaker. The force and velocity signals were measured with the force cell and laser vibrometer, respectively. A Dynamic Signal Analyser DSP Siglab model 20-42 was used to collect and process the data.
Figure 1.
The developed experimental method for identification of damping of PID consisted in measuring the evolutions of both force and velocity of the system versus the frequency of excitation. In order to characterise the PID with a high precision, a sine-sweep excitation was used with a small frequency step.
Figure 2.
2.1. Theoretical background
Basically, it is known that the complex power associated to one harmonic cycle is given as
P=Frms.Vrms* (1)
where F and V*are respectively the complex force and the conjugate of the complex velocity.
The average dissipated power (also known as active power in electrical engineering) can be extracted from the real part of the complex power
Re( )P =Frms.Vrms.cos(
φ φ
F - V) (2) where (φ φ
F- V) is the phase difference between the force and velocity signals in radians. The imaginary part of power corresponds to a term usually known as reactive power (also a term borrowed from electrical engineering) and can be written asIm( )P =Frms.Vrms.sin(
φ φ
F- V) (3)The loss factor contribution of the PID can be predicted as
Re( ) Im( ) P P
η
= (4) 2.2. Experimental processThe experimental process is organised in two steps:
In the first step, the particles are replaced by an equivalent mass (equal to the total mass of particles) fixed to the ceiling of the enclosure. The goal of this set of tests is to verify the measurement of powers; this includes the analysis and calibration of the experiment parameters which have an effect on the measurement precision.
In the second step, the equivalent mass is replaced by lead particles moving inside the enclosure, the gap being adjusted by the four screws. The measurements of force and velocity are performed taking into account the instrument calibration done using the equivalent mass. It appears that these measurements are very sensitive to any phase error between force and velocity signals. Therefore the calibration step is of major importance.
2.3. Experimental results
The impacting mass of PID consisted of lead particles. The tests were conducted by keeping both gap and mass of particles constant (the gap was 2 x 10⁻³m, the size of lead particles was 2 x 10⁻³m and the total mass of particles was 10.5 x 10⁻³ Kg) while varying the excitation frequency from 20 to 70Hz with steps of 3.3Hz. The measurement of force and velocity
allowed the computation of the trapped and dissipated powers, afterward the loss factor was carried out using equation (4).
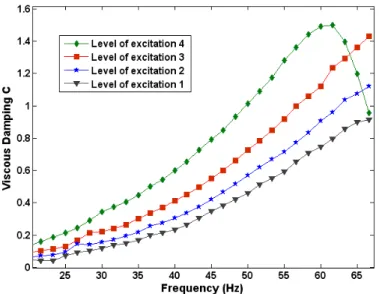
Figure 3 shows the evolution of the loss factor of the PID versus the excitation frequency. Four levels of excitation level are considered.
Figure 3.
For a significant explanation of the obtained results, it was desired to choose for the x-axis, a non-dimensional term that could describe the motion of the particles inside the enclosure. It is known that the power dissipation changes considerably once the particles begin to impact the ceiling. This condition is controlled by the amplitude of the enclosure motion and the gap size. Therefore, displacement/gap was chosen as the x-axis. Figure 4 shows the evolution of the loss factor of the PID versus the non-dimensional (displacement / gap).
These results reveals that a high values of loss factor were reached, showing the efficiency of this passive process. In addition, the level of loss factor increases when the displacement amplitude increases.
Figure 4.
2.4. Expression of loss factor via viscous damping coefficient
In this section, the loss factor of PID which was determined experimentally is converted into an equivalent viscous damping. Figure 5 represents a schematic of both the PID and the adopted model. The contribution of PID is estimated as an equivalent linear viscous damping coefficient c( )ω determined for different levels of excitation and depending on the excitation frequency.
As one would expect, the system constituted by the enclosure M and the impact mass m does not exhibit any stiffness, then its motion equation can be expressed by
M x t. ( )+c( ). ( )
ω
x t =f t( ) (5) where f t( ) represents the excitation force and M is the mass of PID.For a periodic excitation, the power of the dissipated system can be expressed by
(
)
(
)
2 2 2 2 2 2 2 2 1 ( ). ( ) . ( ).( ) ( ) 2 - ( ) - ( ) - ( ) - ( ) F c F M m P i c M m c M mω ω
ω
ω
ω
ω
ω
ω
ω
+ = + + + (6)where ω represents the excitation frequency.
Using equations (4) and (6), the loss factor is computed by
(
)
(
)
(
)
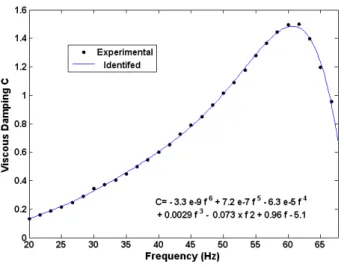
Re ( ) ( ) ( ) Im ( ) . P c P M m ω ω η ω ω ω = = + (7)This relation allows the conversion of the loss factor which was characterised experimentally into viscous damping depending on the frequency and the level of the excitation. In order to use these results in a structural model, the viscous damping coefficient is fitted by a polynomial equation depending of the frequency (see figure 6).
Figure 6.
3. Investigation of a plate treated by PID’s
The aim of this second part of our investigation is to predict the response of a primary structure treated with PIDs using the damping coefficient characterised experimentally by the power method. An experimental study was conducted to compare experimental results with the simulation ones and to verify the capacity of the developed method to predict the dynamic behaviour of the primary structure treated with PIDs.
The chosen primary structure is a free-free plate, which was preferred to a beam-like structure in order to ensure a rich spatial behaviour under dynamic loading.
3.1. Experimental study
In order to reveal the impact of PIDs locations on the dynamic response of the plate, two configurations of PIDs positions were considered (see figure 7). The four PIDs used in this experiment have the same design parameters (particles mass and gap). The plate is made of aluminium specified with a mass density ρ = 2700 kg/m3, Young’s modulus E = 7 x 10¹⁰ Pa and Poisson ratio ν= 0.3. The plate dimensions are length L = 560 mm, width l = 460 mm and thickness e = 2 mm. The mass plate is 1.39 Kg which represents 34 times the total mass of all particles used in PIDs.
Figure 7.
Figure 8 shows the experimental apparatus according to the considerations mentioned above. The aluminium plate was suspended horizontally by three elastic cables. The PIDs were fixed on the plate according the two configurations described in figure 7. A magnetic shaker was used to provide a harmonic excitation force with varying excitation frequency. The signals of both velocity and force of the excited structure were measured, respectively using a laser vibrometer and force cell. The plate responses were collected with a multichannel Dynamic Signal Analyser Siglab model 20-42. Then the measurements were carried out successively at 9 points distributed on the plate according to figure 9. The locations of these nodes are chosen in order to describe adequately the dynamic behaviour of the structure in the considered frequency band.
Figure 8.
3.1.1. Experimental process
The experimental process for the two PIDs configurations is organised in two parts. The PIDs enclosures are first kept empty in order to characterise the modal behaviour of the primary structure. Then the measurements are repeated with the enclosures containing 10.5 x 10⁻³Kg of lead particles with a gap of 2 mm. The excitation level is kept the same as the one used in the characterization of the PID. For each one of these two situations, the Frequency Response Functions (FRFs) velocity/force of the plate are successively measured at 9 points of the plate by moving the Laser vibrometer at each location. For each measurement, a stepped-sine excitation generated by Siglab data acquisition system is amplified and then input into the shaker. A predefined level of force is chosen and maintained throughout the test thanks to a closed-loop control. After the measurement, the modal characteristics are identified from the 9 FRFs using the software MODAN ® which was developed in the Applied Mechanics Department of FEMTO-ST Institute in Besançon, France. The identification is based on a single-mode approach.
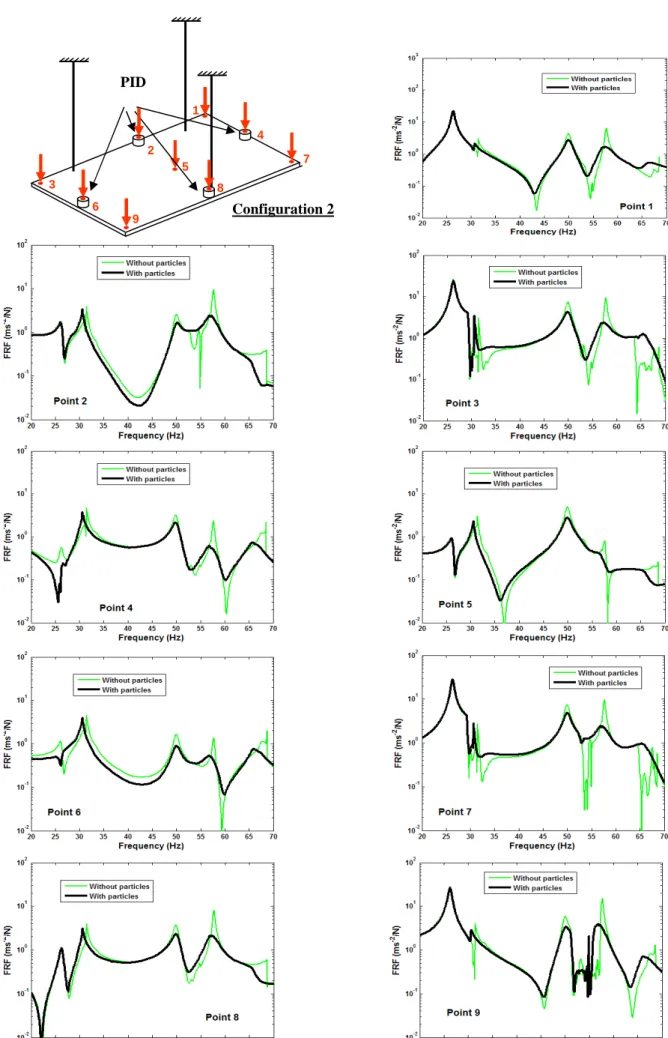
3.1.2. Experimental results
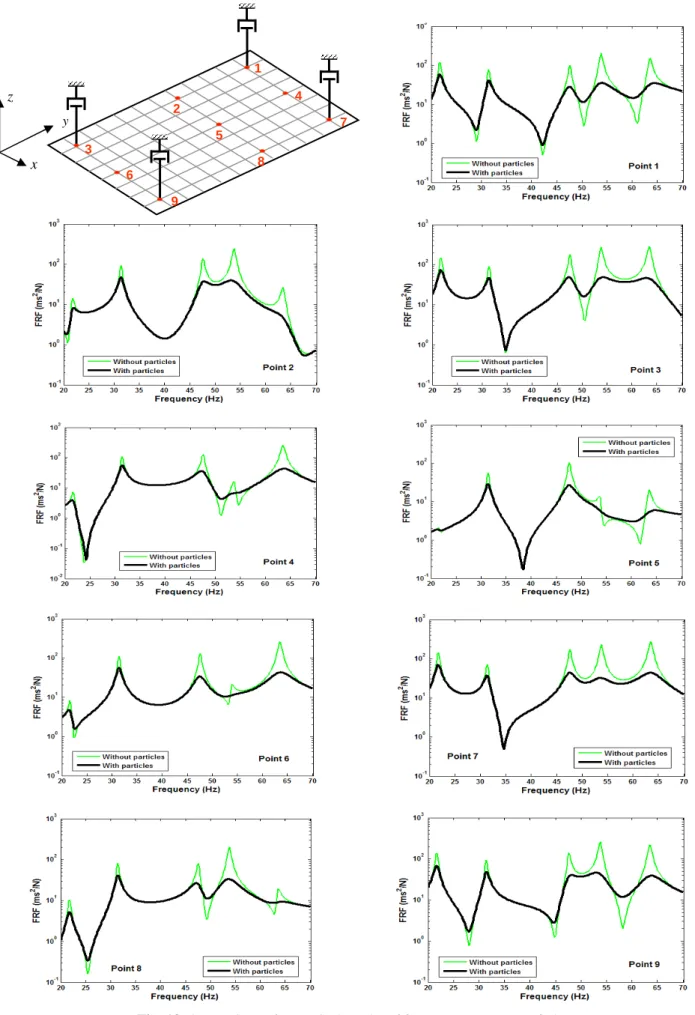
Figures 10 and 11 show the FRFs (acceleration / force) measured for the two configurations of the system at the 9 points described above. The examination of these FRFs (with and without particles) shows the effectiveness of PIDs in reducing the vibratory levels of the structure over a wide frequency band: the effects of PIDs are visible on each one of the five first modes of the plate
Figure 10.
Table 1 shows a comparison of the identified modal characteristics with and without particles for the first configuration. It is found that the presence of particles causes an increase of modal damping which can reach quite high levels without significant changes of the natural frequencies and mode shapes. For example, for the first mode, the modal damping increases from 1.5% to 2.9% with a frequency variation of 3.7%.
Table1.
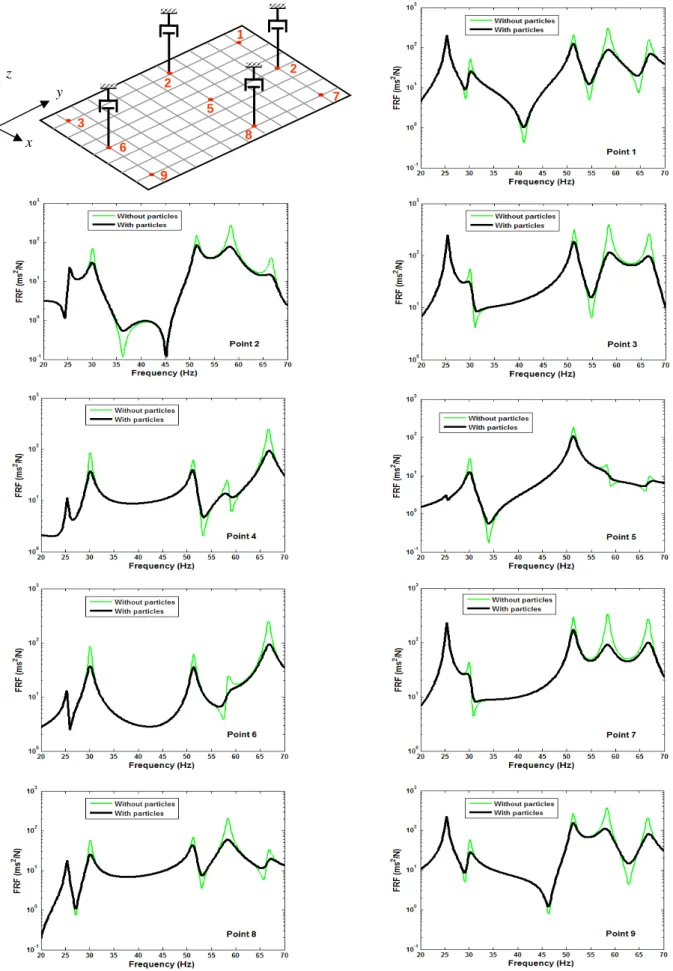
The same results are presented for the second configuration in Figure 11 and Table 2. It is noticed, when comparing the modal damping of the system for the two configurations, that the first one provides greater modal damping for all modes. For the second configuration, the damping is nearly unchanged for the first mode. This is due to the PIDs positions of the second configuration which coincide with the nodal lines of the first mode. This result confirms that the damper efficiency depends on the mode shapes of the plate.
Table2.
3.2. Numerical study
Figure 12 shows a schematic of the considered plate treated with PIDs and the adopted model. The plate is modelled by finite element method using Discrete Kirchhoff Quadrilateral (DKQ) element. The damping contributions of PIDs are modelled by frequency dependent viscous damping coefficients.
Figure 12.
The motion of the global system is governed by
where
{ }
X is the nodal displacement of the plate,{ }
f is the external force applied to the system.[ ]
K and[ ]
M represent respectively the stiffness and mass matrix of both the plate and the PIDs[ ]
M =Mp+[ ]
Md (9) where Mp is the mass matrix of the plate and[ ]
Md is the additional mass matrix caused by the presence of the PIDs.
[ ]
( ) ( ) ( ) ( ) ( ) ( ) ( ) ( ) i j k l i j k l e e d e e z z z z z z z z M M M M M = (10)where Merepresents the mass of PID without particles.
[
C( )ω
]
which represents the damping matrix of the global system is given by
[
C( )ω
] [ ] [ ]
= C0 + Cd (11)where
[ ]
C0 is the proportional damping matrix of the plate and[ ]
Cd represents the additional damping matrix caused by PIDs
[
]
( ) ( ) ( ) ( ) ( ) ( ) ( ) ( ) 0 ( ) 0 ( ) ( ) ( ) 0 ( ) i j k l i e j e d k e l e z z z z z z z z C O C C O C O C ω ω ω ω ω = (12)Ce (ω) represents the equivalent punctual viscous damping of each PID (characterised
experimentally and depending of the excitation frequency) located at the nodes i, j , k and l of the plate.
It is noticed that the dependence of the PID contribution to the amplitude excitation is not considered here, this significant simplification can affect the quality of the numerical predictions, but it was retained because it leads to a simple technique for calculating the dynamic responses of the primary structure. The implementation of this modelling was performed in the MATLAB environment.
3.2.1. Numerical results
To validate the finite element model, the first five natural frequencies of the system formed by the plate and the four empty enclosures are compared with those of the experiment (Table 3). The variations do not exceed 4% showing a good agreement for the two considered configurations. It is noticed that the studied frequency band of the plate is in accordance with the one used during the PID characterisation.
Table3.
Once the finite element model is validated, the frequency dependent damping contributions of PIDs are introduced thanks to the polynomial equation illustrated in Figure 6.
Figures 13 and 14 show a simulation of the FRF (acceleration / force) of the undamped plate (without effects of PIDs) and of the plate treated with PIDs respectively for the first and the second configuration, calculated at the nine nodes shown in figure 9. It is noticed that the PIDs can reduce the vibratory level of the five first natural’s frequencies of the system which agrees with the experimental results.
Figure 14.
Figure 15 shows a comparison of numerical and experimental responses of the system with and without particles determined at points 6 and 9 for the configuration 1. A slight shift is observed between the calculated natural frequencies and those of the experiments. For the case of the system with the particles, the shift is more visible and shows the effect of the particles mass which has been neglected in the model. There are also differences at the peaks amplitudes in the vicinity of the natural frequencies between the numerical and experimental responses for the system with and without particles. These differences stem from the hypothesis considered when modelling the system. The dependence of the amplitude of vibration damping is not taken into account and then it necessarily influences the dissipation of energy in PID. In addition, the model does not include damping provided from enclosures-plate connections ensured by screws.
Nevertheless, the analysis of simulation results of the structure with and without particles shows the ability of the model developed in this work to predict the dynamic behaviour of the structure taking into account the effect of damping by particles. First, the effectiveness of the PIDs is visible on all the studied modes as observed experimentally.
Figure 15.
In order to reveal the influence of the excitation levels plate on its dynamic response, a case study was conducted. Four excitations level are used, the intensity of those excitations are the same one used in the experimental PID characterisation as presented in Figure 3 and 4. The Figure 16 shows the FRF’s of the plate calculated at three points 1, 5 and 6 for the four considered excitation levels (configuration1). The influence of the excitation levels is observed by comparing picks levels in the vicinity of natural frequencies. However the
frequency effects on the PID performance are more significant than the influence of excitation levels. Indeed, the optimal damping value of the PID is more pronounced at 50 to 60 Hz indicating that the damping of the third, fourth and fifth plate mode are more visible then the first and the second one.
Figure 16.
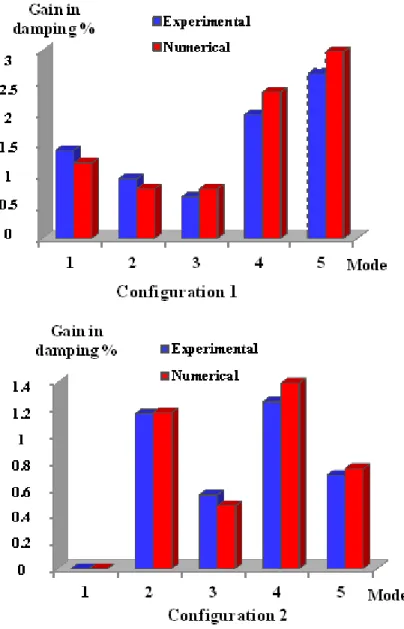
Tables 4 and 5 show the simulated modal damping respectively for the two configurations studied, as well as the modal damping increase due to the particles effect. Figure 17 shows this modal damping increase for the five first modes of the two configurations, comparing the numerical and experimental values. Is appears clearly that the modal damping increase is correctly predicted by the proposed model.
Table4.
Table5.
Figure 17.
4. Conclusion
The work reported in this paper aimed at finding ways to better characterise a particle impact damper. The loss factor of the particle damper was characterised with respect to both the frequency and the level of displacement by the use of power measurements. It has been shown that a high value of loss factor can be achieved which explains the effectiveness of this type of vibration damper. The nonlinear behaviour of the particle impact damper was then approximated to a frequency dependent equivalent viscous damping. The numerical and experimental study of a plate treated by PID was performed in order to verify that the loss
factor identified by power measurements allowed predicting the dynamic behaviour of the structure. The good agreement of the result shows that the proposed characterisation and modelling are efficient in spite of the approximations they contain.
5. References
[1] H. V. Panossian, Non-obstructive particle damping: new experiments and capabilities. Proceedings of the 49th AIAA/ASME/ASCE/AHS/ASC structures. Structural Dynamics and Materials Conference (2008).
[2] S. Simonian, V. Camelo, S. Brennan, N. Abbruzzese, B. Cualta, Particle damping for schock and acoustic environment attenuation, Proceedings of the 49th AIAA/ASME/ASCE/AHS/ASC structures. Structural Dynamics and Materials Conference (2008).
[3] N. Popplewell, M. Lio, A simple design procedure for optimum impact dampers. Journal of Sound and Vibration 146 (3) (1991) 519-526.
[4] A. Papalou, S. F. Masri, An experimental investigation of particle damper under harmonic excitation, Journal of vibration and control 4 (1998) 361.
[5] C. N Bapart, S. Sankar, Single unit impact damper in free and forced vibration, Journal of Sound and Vibration 99-1 (1985) 85-94.
[6] J. Park, S. Wang, M. J. Crocker, Mass loaded resonance of a single unit impact damper caused by impacts and the resulting kinetic energy influx. Journal of Sound and Vibration 323 (2009) 877-895.
[7] C. Cempel, G. Lotz, Efficiency of vibrational energy dissipation by moving shot, Journal of Structural Engineering 119 (1993) 2624–2652.
[8] K. S. Marhadi, V.K. Kinra, Particle impact damping: effect of mass ratio, material, and shape, Journal of Sound and Vibration 283 (2005) 433-448.
[9] W. Liu, G. R. Daniel, J. A. Rongong, The dynamic characterisation of disk geometry particle dampers, Journal of Sound and Vibration 280 (2005) 849–861.
[10] M. Y. Yang, Development of master design curves for particle impact damper, Doctoral Thesis, The Pennsylvania state university, 2003.
[11] C. X. Wong et al, Energy dissipation prediction of particle dampers, Journal of sound and vibration 319 (2009) 91-118.
LIST OF FIGURES CAPTIONS
Fig. 1. Schematic of the experimental apparatus. Fig. 2. Schematic of the Particle Impact Damper. Fig. 3. Loss factor of PID versus frequency.
Fig. 4. Loss factor of PID versus displacement/ gap. Fig. 5. (a) Particle impact damper, (b) Model. Fig. 6. Viscous damping versus frequency.
Fig. 7. Emplacements of PIDs on the plate. (a) Configuration1, (b) Configuration2. Fig. 8. Picture of the plate treated with PID.
Fig. 9. Points of measurements.
Fig. 10. Comparison of frequency responses of the plate with and without particles.
(configuration 1).
Fig. 11. Comparison of frequency responses of the plate with and without particles.
(configuration 2).
Fig. 12. (a) Schematic of plate treated with PIDs, (b) Adopted model.
Fig. 13. Comparison of numerical results of frequency responses of plate with and without
particles. (configuration1).
Fig. 14. Comparison of numerical results of frequency responses of plate with and without
particles. (configuration 2).
Fig. 15. Comparison of numerical and experimental frequency responses of plate with and
without particles. (configuration 1).
Fig .16. FRF plate with different excitation levels.
Fig. 1. Schematic of the experimental apparatus.
Fig. 2. Schematic of the Particle Impact Damper.
Amplificator Laser vibrometer Shaker Conditioner Dynamic analyser Impact damper Enclosure Lead particles Gap d Force sensor Screw Shaker Laser vibrometer
Fig. 3. Loss factor of PID versus frequency.
Fig. 4. Loss factor of PID versus displacement / gap.
Fig. 5. (a) Particle impact damper, (b) Model.
(b) x(t) d m M (a) x(t) M
( )
e C ωFig. 6. Viscous dampingversus frequency.
Fig. 7. Emplacements of PIDs on the plate. (a) Configuration1, (b) Configuration2.
Fig. 8. Picture of the plate treated with PID.
Fig. 9. Points of measurements. 3 7 2 1 4 5 6 8 9 (b) PID’s (a) PID’s
3 7 PID 2 1 4 5 6 8 9 Configuration 1 1
Fig. 11. Comparison of frequency responses of the plate with and without particles. (configuration 2).
2 1 3 4 5 6 7 8 9 PID Configuration 2
Fig. 12. (a) Schematic of plate treated with PIDs, (b) Adopted model. (a) (b) PID ( i ) ( j ) ( k ) ( l ) z x y
Fig. 13. Comparison of numerical results of frequency responses of plate
with and without particles. (configuration1). z x y 3 2 6 9 5 8 7 4 1
Fig. 14. Comparison of numerical results of frequency responses of plate
with and without particles. (configuration 2). z x y 3 2 6 9 5 8 7 1 2
Fig. 15. Comparison of numerical and experimental frequency responses of plate
LIST OF TABLES CAPTIONS
Table 1. Modal characteristic of the experimental system, configuration 1. Table 2. Modal characteristic of the experimental system, configuration 2. Table 3. Comparison of natural frequencies system.
Table 4. Modal characteristic of the numerical system, configuration 1. Table 5. Modal characteristic of the numerical system, configuration 2.
Mode Number
Without particles With particles Gain in
damping % Frequency (Hz) Modal damping (%) Frequency (Hz) Modal damping (%)
1 22.7 1.5 21.6 2.9 1.4
2 31.1 0.55 30.5 1.5 0.95
3 47.5 0.74 46.9 1.4 0.66
4 54.1 0.43 53.2 2.4 1.97
5 63 0.38 64.1 2.5 2.12
Table 1. Modal characteristic of the experimental system, configuration 1.
Mode Number
Without particles With particles Gain in
damping % Frequency (Hz) Modal damping (%) Frequency (Hz) Modal damping (%)
1 26.3 1.2 26.3 1.2 0
2 31.3 0.74 30.5 1.9 1.16
3 49.9 1.09 49.9 1.7 0.55
4 57.7 0.35 57.1 1.6 1.25
5 67 1.2 66.1 1.9 0.7
Table 2. Modal characteristic of the experimental system, configuration 2.
Natural frequencies
Configuration 1 Configuration 2
Numerical Experimental Variation (%) Numerical Experimental Variation (%)
1 21.7 22.7 3. 3 25.4 26.3 3.7
2 31.4 31.1 0.92 30.1 31.3 3.8
3 47.6 47.5 0.34 51.3 49.9 2.8
4 53.8 54.1 0.01 58.4 57.7 1.2
5 63.5 63 1.13 66.7 66.9 0.2
Mode Number
Without particles With particles Gain in
damping % Frequency (Hz) Modal damping (%) Frequency (Hz) Modal damping (%)
1 21.7 1.1 21.7 2.3 1.2
2 31.4 0.81 31.4 1.6 0.79
3 47.6 0.71 47.5 1.5 0.79
4 53.8 0.57 53.6 2.9 2.33
5 63.5 0.53 63.6 3.5 2.97
Table 4. Modal characteristic of the numerical system, configuration 1.
Mode Number
Without particles With particles Gain in
damping % Frequency (Hz) Modal damping (%) Frequency (Hz) Modal damping (%)
1 25.4 0.94 25.4 0.94 0
2 30.1 0.83 30.1 2 1.17
3 51.3 0.63 51.3 1.1 0.47
4 58.4 0.61 58.3 2 1.39
5 66.7 0.85 66.9 1.6 0.75