Titre:
Title:
Hybridization of complete PLCA and MRIO databases for a
comprehensive product system coverage
Auteurs:
Authors:
Maxime Agez, Richard Wood, Manuele Margni, Anders H.
Strømman, Réjean Samson et Guillaume Majeau-Bettez
Date: 2020
Type:
Article de revue / Journal articleRéférence:
Citation
:
Agez, M., Wood, R., Margni, M., Strømman, A. H., Samson, R. & Majeau-Bettez, G. (2020). Hybridization of complete PLCA and MRIO databases for a
comprehensive product system coverage. Journal of Industrial Ecology, 24(4), p. 774-790. doi:10.1111/jiec.12979
Document en libre accès dans PolyPublie
Open Access document in PolyPublieURL de PolyPublie:
PolyPublie URL: https://publications.polymtl.ca/5487/
Version: Version finale avant publication / Accepted version Révisé par les pairs / Refereed Conditions d’utilisation:
Terms of Use: Tous droits réservés / All rights reserved
Document publié chez l’éditeur officiel Document issued by the official publisher
Titre de la revue:
Journal Title: Journal of Industrial Ecology (vol. 24, no 4) Maison d’édition:
Publisher: Wiley URL officiel:
Official URL: https://doi.org/10.1111/jiec.12979
Mention légale: Legal notice:
This is the peer reviewed version of the following article: Agez, M., Wood, R., Margni, M., Strømman, A. H., Samson, R. & Majeau-Bettez, G. (2020). Hybridization of complete PLCA and MRIO databases for a comprehensive product system coverage.
Journal of Industrial Ecology, 24(4), p. 774-790. doi:10.1111/jiec.12979, which has been published in final form at https://doi.org/10.1111/jiec.12979. This article may be used for non-commercial purposes in accordance with Wiley Terms and Conditions for Use of Self-Archived Versions.
Ce fichier a été téléchargé à partir de PolyPublie, le dépôt institutionnel de Polytechnique Montréal
This file has been downloaded from PolyPublie, the institutional repository of Polytechnique Montréal
Hybridization of complete PLCA and MRIO databases for a
comprehensive product system coverage
Maxime Agez, Richard Wood, Manuele Margni, Anders H. Strømman, Réjean Samson, Guillaume Majeau-Bettez
Abstract
Process-based life cycle assessments (PLCA) rely on detailed descriptions of extensive value chains and their associated exchanges with the environment, but major data gaps limit the completeness of these system descriptions and lead to truncations in inventories and underestimations of impacts. Hybrid Life Cycle Assessments (HLCA) aim to combine the strength of PLCA and Environmentally Extended Input Output (EEIO) analysis to obtain more specific and complete system descriptions. Currently, however, most HLCAs only remediate truncation of processes that are specific to each case study (foreground processes), and these processes are then linked to (truncated) generic background processes from a non-hybridized PLCA database. A hybrid PLCA-EEIO database is therefore required to completely solve the truncation problems of PLCA and thus obtain a comprehensive product system coverage. This paper describes the construction of such a database using pyLCAIO, a novel framework and open-source software enabling the streamlined hybridization of entire PLCA and EEIO databases. We applied this framework to the PLCA database Ecoinvent3.5 and the multiregional EEIO database EXIOBASE 3. Thanks to the correction for truncation in this new hybrid database, the median and average lifecycle global warming potential 100 of its processes increased by 7% and 14%, respectively. These corrections only reflect the truncations that could be readily identified and estimated in a semi-automated manner; and we anticipate that further database integration should lead to higher levels of correction in the future.
1. Introduction
1.1 The issue of truncation and challenges in its quantitative evaluation
Process-based Life Cycle Assessment (PLCA) and Environmentally Extended Input Output (EEIO) analyses are complementary methods used to quantify the emissions and impacts on the environment linked directly or indirectly to the use or production of products or services (Jeswani, Azapagic, Schepelmann, & Ritthoff, 2010). The two methods possess different strengths and weaknesses. EEIO is mainly used for assessing impacts of consumption (and production) of a basket of goods and is based on national “input-output” inventories recording trading information from companies (Miller & Blair, 2009), complemented by environmental extensions developed by various research groups. As a result, EEIO accounts cover the entire economy (Lenzen, 2000). However, the inventories are provided at an aggregated level for national accounting purposes. Information on inputs required by a certain production process is thus complete, but only expressed in terms of aggregated product groups (e.g., motor vehicles). In other words, it is impossible to directly study specific products (e.g., a specific electric car) with EEIO alone (Suh et al., 2004). PLCA, on the other hand, is designed to support the comparison of specific products (UNEP, 2003). To do so without leaving out any source of environmental impacts would require inventorying all economic and environmental flows through all supply chains relevant for assessing the life cycle impacts. The economy being deeply intertwined (Gibon & Schaubroeck, 2017; Pomponi & Lenzen, 2017), such inventorying is currently hardly achievable, even with databases. As such, PLCA practitioners define explicit system
boundaries (International Organization for Standardization, 2006), which allow for a clarification of which processes of the product system are included in the analysis and which are excluded and therefore ignored. These system boundaries trigger two problems: (1) because they are defined subjectively, it is common that two PLCAs with the same focus of study end up not being comparable due to ignoring different parts of the life cycle (Price & Kendall, 2012), (2) the requirements throughout the life cycle left outside the boundaries are ignored even though they have an impact on the environment (Suh et al., 2004). The latter results in either omissions or underestimations of inputs in the unit process. These omissions/underestimations are what is referred to as truncations in PLCA. They constitute a systematic negative bias in estimation of emissions in PLCA studies.
Because PLCA system descriptions are specific but truncated, whereas EEIO analyses rely on complete but aggregated inventories, both methods have been combined in what is known as Hybrid Life Cycle Assessment (HLCA) (Bullard & Penner, 1978). There are several methodological approaches to HLCA (Crawford, Bontinck, Stephan, Wiedmann, & Yu, 2018). In one of the most common approach (i.e., tiered hybrid approach), PLCA requirements are maintained as is, and complemented by the EEIO requirements as additional inputs that are not included in the PLCA (Islam, Ponnambalam, & Lam, 2016).
Multiple studies have contributed to refining the estimation of truncations of PLCA. Junnila (2006) compared results from PLCA with equivalent results from EEIO for five economic services and observed truncations between 50 and 70%. Williams (2004), Zhai et al. (2010), Michelsen, Solli, and Strømman (2008) and Teh, Wiedmann, and Moore (2018) compared results from PLCAs with results from HLCAs and could estimate truncations on particular products (i.e., desktops, photovoltaic systems, forestry and cements) varying from 20 to 75%. Arvesen, Birkeland, and Hertwich (2013) and Wolfram (2015) specifically focused on estimating truncations for renewable energy processes (using HLCA to compare results) and obtained truncations greater than 100%. Ward et al. (2017) estimated that the truncation of services alone could lead to average truncations ranging from 2 to 12% in PLCA processes across multiple economic sectors. Yet, services only constitute a portion of truncated flows, and therefore overall truncation levels are expected to be higher. Recently, Yu and Wiedmann (2018) obtained truncation estimates of 21-32%, after hybridizing the Australian Life Cycle Inventory database with the Australian Industrial Ecology Virtual Laboratory (an Australian Input Output database). Given the wide range of truncation estimates, small sample sizes and geographical limitations found in the literature, the typical
amount of truncation of PLCA is not clearly identified yet. An estimation based on a representative sampling, including processes from multiple economic sectors, across multiple countries and adding complements beyond just services is therefore needed to finally obtain a representative quantification of the typical truncations of PLCA.
1.2 Progress in inventory hybridization and remaining truncation issues
Despite the improvements in completeness achieved by current HLCA studies, in practice most HLCAs still suffer from systematic truncation because of continued reliance on unhybridized process databases. Process databases play a central role in LCA practice: practically all PLCA studies directly inventory processes deemed most specific to the study (i.e., foreground processes) to then model the value chains of these processes via a database regrouping description of generic technologies (background processes). Even if effort is sometimes invested to hybridize foreground processes to minimize the truncations in the estimation of their direct inputs and emissions, only these foreground processes are ever hybridized (Mongelli, Suh, & Huppes, 2005). A part of the truncations of PLCA is therefore dealt with in HLCAs (for
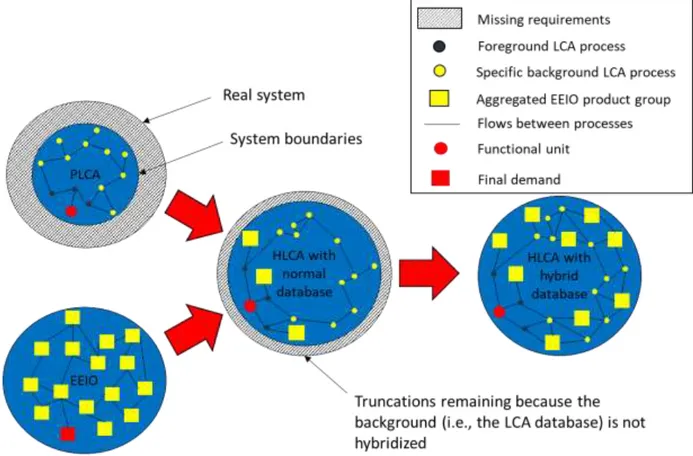
the foreground processes), but some truncation is necessarily left in the unhybridized background.i To reach more complete system descriptions without sacrificing specificity, the LCA community needs a high resolution database of background processes that is itself hybridized with an EEIO database (see figure 1).
Furthermore, as these processes’ value chains stretch across multiple geographies, the EEIO database chosen should preferably be a global, MRIO database.
Figure 1: Conceptual representation of the hybridization of a PLCA (top-left) and an EEIO (bottom-left) modeling of a product system. Current hybrid LCA only hybridized foreground data (black dots), leaving some truncation in the background. To further remove truncation issues in hybrid LCA, a hybrid database is needed. Only some of the flows between processes are represented
for clarity reasons.
1.3 Progress and challenges in the development of a hybrid database
The compilation of a hybrid database has long been called for (Bontinck, Crawford, & Stephan, 2017; Crawford et al., 2018; Majeau-Bettez, Strømman, & Hertwich, 2011; Strømman, Peters, & Hertwich, 2009)). Previous attempts resulted in one-off hybridizations of a sector-specific PLCA database (Suh & Lippiatt, 2012) and of a country-specific database including multiple economic sectors (Yu & Wiedmann, 2018). To obtain and maintain a multi-sector, multi-country hybridized database, while keeping the specificity of the PLCA database, two broad categories of unresolved challenges must be addressed. First, structural and ontological discrepancies between the economic and process databases (i.e., geography, distribution of goods, intra-establishment flows, etc.) must be addressed preferably in an open framework that is efficient and transparent. Second, the so-called “correction for double counting” must be applied for thousands of processes and should thus preferably be streamlined.
Correcting for double counting corresponds to determining the limits between PLCA and EEIO inputs in HLCA. In other words, which inputs are deemed missing from the unit process inventory (i.e., the processes are fully truncated for these inputs), which inputs are to be kept untouched (i.e., inputs are deemed representative and hence supply chains are not truncated for these inputs), and which inputs should be complemented by EEIO (i.e., the inputs are deemed underestimated resulting in partial truncation). For instance, let us take a detailed but clearly incomplete inventory for the production of a specific car, based on parts listings, public literature, and expert estimates (Hawkins, Singh, Majeau-bettez, & Strømman, 2012). The authors of this study did not have access to required amount of multiple direct inputs (e.g., lubricants, computers or services). Inputs for the production of the average vehicle (from EEIO) could thus be added through hybridization to compensate for this incompleteness. As the EEIO product group represents in an aggregated manner every input for the production of the average car, directly adding all EEIO inputs to the PLCA process without appropriate correction would lead to a double counting of the inputs already present in the PLCA inventory. Crucially therefore, such hybridization procedure must always “correct” the hybridization process to avoid any overlap between the requirements inventoried in the original PLCA and the additional requirements estimated through hybridization with EEIO data. For the specific car example, if the authors are confident that their process-based inventory already accounts for all inputs of steel, care must be taken that “steel” and any steel containing part be absent from the additional inputs estimated based on the purchases of the “motor vehicle” product group of an EEIO database, keeping solely the inputs deemed erroneously omitted by the original PLCA inventory (e.g., requirements of business services, research & development, etc.). This careful avoidance of double counting of steel and its associated emissions to the production of the car is commonly referred to as “correction for double counting”.
The current recommendations (Arvesen, Nes, Hertwich, & Huertas-Hernando, 2014; Lenzen & Crawford, 2009; Strømman et al., 2009) for correcting for double counting rely heavily on expert knowledge of the hybridized processes and the limitations of their inventory compilation. These recommendations are therefore impractical for the hybridization of complete PLCA and EEIO databases, for which such expert knowledge of the specificity of each process is less readily available because the hybrid practitioner was not the one who collected the thousands of PLCA inventories. To address this specific challenge Agez et
al. (2019) developed the Similar Technological Attribute Method (STAM) which relies on heuristics to
preserve the specificity of the PLCA database with minimal information about processes. Until now,
however, this approach has been defended solely on theoretical grounds and has not been validated on full-scale databases.
2. Aim and scope
This paper presents (1) the creation of a framework allowing the streamlined hybridization of multi-sector, multi-country PLCA and EEIO databases; (2) the development of a software to ease this hybridization process; (3) the first assessment of the applicability and validity of STAM; and (4) the estimation, across an entire PLCA database covering a wide range of technologies, of the level of truncation that can be readily corrected in process inventories, even in the absence of a detailed, first-hand experience of their compilation.
The streamlined hybridization framework of this paper is applied to the ecoinvent v3.5 database (Wernet et al., 2016) and EXIOBASE 3 (Stadler et al., 2018). By publishing a software tool under open-source license, we aim that any researcher/practitioner with subscription to these two databases can reproduce the
hybrid PLCA-EEIO database of this study or, with different parameters, generate a new variant. The focus of this project is to streamline the hybridization of a PLCA database, not to hybridize each individual process of a PLCA database perfectly.
This article solely focuses on complementing missing requirements (truncation) in the LCA database, corresponding to a tiered hybrid approach. Further integration (i.e., disaggregation of IO product groups) is beyond our scope. The reader is referred to (Crawford et al., 2018) and (Suh & Huppes, 2005) for additional information on different variants on HLCA methodologies (i.e., matrix augmented, integrated, path exchange).
3. Methods
3.1 Database hybridization framework (pyLCAIO)
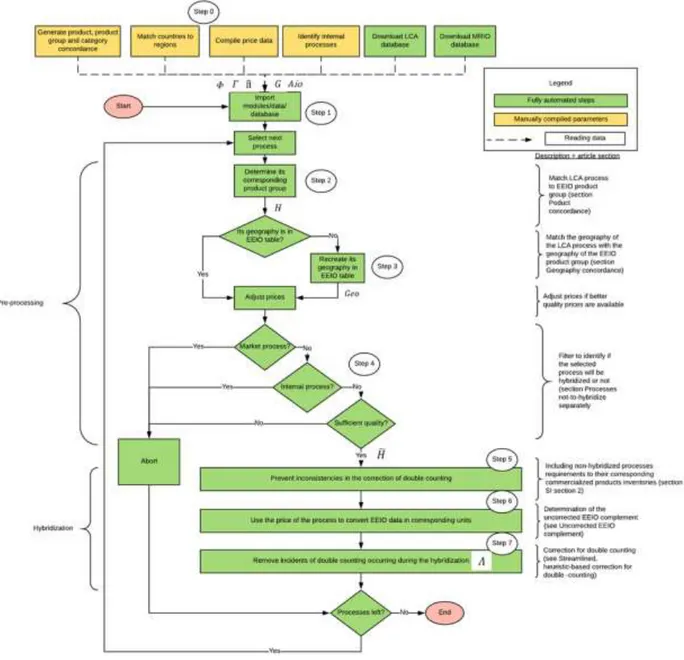
To complete this analysis, we developed the pyLCAIO framework and software, with key data and processing steps presented in Figure 2. The framework of pyLCAIO can be split into two parts: (1) pre-processing routines where the different processes of the PLCA database are prepared for hybridization, and (2) hybridization functions where the previously described hybridization process occurs.
The framework of pyLCAIO is solely applicable to PLCA unit processes; so-called “system processes” cannot be hybridized, as they aggregate all the upstream processes whilst the EEIO structure is based on individual processes. The framework requires unique identifiers for each unit process as well as prices for each product, both of which are now generally provided by the PLCA databases themselves, e.g., ecoinvent. The MRIO database must be in a commodity-by-commodity technology matrix format. PyLCAIO requires additional parameters which will be described in the following sections and which are generated manually (in yellow in figure 2).
Figure 2: Flowchart of the pyLCAIO framework, describing the steps taken (boxes) and intermediate variables (italic letters) that enable the hybridization of PLCA and MRIO databases.𝜱, 𝜞 and Λ are matrices required for the correction of double counting.
Aio is the commodity-commodity technology matrix of the MRIO database. H and G are concordance matrices, linking products,
product groups and STAM categories. 𝑯 ̃is the filtered concordance matrix in which processes not-to-be-hybridized are excluded.
Geo is a matrix dealing with the difference in geographical resolutions of the databases. 𝜫̂ is the diagonalized vector of prices.
Most steps are automated (in green), although some parameters must be generated manually (in yellow). Necessary data to be provided for pyLCAIO are unit process inventories with commodity prices for each PLCA products and production volumes for
each product group of a commodity-commodity MRIO table.
3.2 Pre-processing
3.2.1 Product concordance
As a first step, each process of the PLCA database is matched to a single product group of the EEIO database. This matching can be built semi-automatically by relying on standard product and industry code classifications (e.g., CPC, ISIC) and associated concordance tables. The practitioner can then refine this
matching based on expert knowledge of the nature of specific processes (Yu & Wiedmann, 2018), in a less automated fashion, i.e., manually (step 0 in figure 2). The matching is then read in by pyLCAIO (step 1) and is transformed in a concordance matrix (𝐇, in step 2). If this matrix is populated with ones and zeros to indicate the presence or the absence of a match, each LCA process can only match with one EEIO product group. Cases where the resolution of the MRIO database is greater than the LCA database would require matching each process with multiple sectors in a weighted manner, using coefficients that sum up to one. We did not encounter this situation, which would have to be handled by the practitioner himself based on production volumes and expert knowledge.
3.2.2 Geography concordance
When hybridizing, the geographies of the EEIO product groups and the PLCA processes must match as well. For HLCAs of specific case studies, where each foreground process typically has a clear national or subnational geography, it is straightforward to match these geographies to MRIO national classifications. In the development of generic PLCA databases however, processes are sometimes generalized to be applicable in broader geographies (e.g., process representing technologies for Europe or the entire world). Some databases (e.g., ecoinvent) even define dynamic residual geographies all labelled “Rest of the World” (RoW), whose values in terms of countries change for each process. For example, if the database includes two inventories for the production of a given product in Switzerland and in France, then the RoW inventory for this product is considered to represent the average production in all but these two countries. These different existing regions of the PLCA database must therefore be translated in terms of countries they represent. An initial matching linking basic regions (e.g., Europe) to their corresponding countries (e.g., FR, DE, etc.) must be generated by the practitioner (step 0). PyLCAIO then uses this information to automate two important tasks. First, it identifies which EEIO countries are implicitly represented in the residual RoW geography of each PLCA commodities. For example, the production of lemon is detailed for Mexico, Turkey and Spain in ecoinvent, and therefore “production of lemon, RoW” implicitly represents all regions except these three regions. Second, the framework aggregates national inputs of the MRIO database into the different broader regions of PLCA processes (including the newly defined RoW regions) using the national production volumes of the MRIO database. For instance, an RER process (Europe) will be hybridized with a weighted average of the MRIO database input structure of all the countries in Europe. PyLCAIO finally designs a matrix (𝑮𝒆𝒐) matching each process of the PLCA database to the corresponding national product groups (i.e., matching PLCA’s “car production Europe” to EEIO’s “FR, motor vehicles”, “DE, motor vehicles”, etc.) with respects to the volume production of each country (step 3).
For cases where the geography of the PLCA process is sub-national (e.g., federal level), pyLCAIO uses the MRIO inputs for the country regardless of the smaller geography described by PLCA. For example, two different technologies from two provinces would be hybridized with the same national average. To be clear, the EEIO complements for these two technologies might be identical (depending on the nature of the inputs in their process-based inventory), but their PLCA description will still differ.
3.2.3 Processes not-to-hybridize-separately
There are types of processes in a PLCA database that should not be hybridized separately. These processes should be taken into account during the hybridization of other processes (they are not ignored, see figure 3), but their own direct input structure should not be complemented by EEIO flows.
First, market processes should not be directly hybridized. PLCA databases are often structured using two types of processes: production processes and market processes. Production processes describe the transformation of products into other products, while market processes describe the distribution of products into the system (Pauliuk, Majeau-bettez, Muller, & Hertwich, 2016). A PLCA market process thus (1) aggregates products from multiple providers in a single entity (e.g., “French electricity mix” process aggregating electricity from nuclear, coal, etc.), and (2) adds requirements for the delivery from the producer to the consumer, especially transport. EEIO databases are built in a different way. Market aggregation is pre-calculated by the so-called “construct” algorithms to develop the technology matrix (Majeau-Bettez, Wood, & Strømman, 2014), and distribution requirements are handled with the “transport margins” and the different price valuations (European Commission, 2008). There are therefore no explicit industry descriptions equivalent to the market processes of a PLCA database in MRIO technology matrices. Hybridizing a market process with a production industry would prove most inconsistent, essentially leading to each process being hybridized twice, doubling the emissions added through hybridization.
Another type of processes not-to-hybridize-separately is what we call internal processes. It is common for PLCA databases to divide a production process in multiple sub-processes. These sub-processes are in fact internal to companies, meaning that the companies themselves operate these sub-processes (e.g., a farmer will operate their “tillage” on their own, as one among a multitude of sub-steps to produce their crops rather than hire “tillage services” from a “tillage provider”). In contrast, MRIOs follow the national accounts definition of “establishments” and, as such, only record exchanges across establishments. Consequently, only PLCA processes that lead to final products (exchanged between establishments) are commensurable with EEIO production functions, and only these processes should be hybridized.
We also refrained from hybridizing PLCA processes that are specific to countries not distinctly represented by the MRIO database. Indeed, residual geographies in MRIO databases (e.g., rest of Asia) were deemed too uncertain, as they are generally obtained through extrapolations of other national inventories (Stadler, Steen-Olsen, & Wood, 2014).
Finally, because of the importance of prices in connecting physical PLCA and economic EEIO inventories, there are processes whose level of description or quality is deemed insufficient to support a credible hybridization. These include processes that have no requirements associated to their production (dummy processes); processes whose product has a null or unknown price (e.g., waste treatment); potential instances where the value of outputs is inferior to the cost of inputs; and products whose price exceeds a threshold above which the orders of magnitude of prices are uncertain (e.g., is a mine infrastructure worth 1,000,000€ or 10,000,000€?). In the present analysis, this threshold was set at 100,000€ per functional unit.
Except for internal processes, which must be identified manually (step 0), pyLCAIO automatically identifies all other processes that should not be hybridized (step 4, Fig. 2). This information is used to update the previously defined concordance matrix (𝑯), resulting in a matrix 𝑯̃ whose columns are forced to zero for processes identified as not-to-be-hybridized-separately.
3.2.4 STAM Hybridization categories
As previously noted, most hybridization methods harmonize the boundaries between the PLCA and EEIO inventories through the adjustment or removal of individual product flows. In contrast, the core strategy
behind the STAM hybridization framework relies on removing or adjusting broad categories of product
flows. These categories are defined such that the products that they regroup can be expected to respond
in a similar manner to a series of inventory quality checks and general heuristics.
Type 1 STAM categories are defined by default so as to encompass product groups whose production share similar input structures (e.g., vegetables, fruits, nuts, cereals, etc. are regrouped in a category “Agriculture”), regardless of their varying functionality. Type 2 STAM categories regroup commodities with a similar functionality, regardless of differences in their production functions (e.g., all “Liquid Fuels” have a similar functionality). These categories are required for the application of STAM (see section Streamlined, heuristic-based correction for double-counting) and are defined by the user (default categories are available).
3.3 Hybridization
3.3.1 Uncorrected EEIO complement
Once the pre-processing steps are fulfilled, the hybridization process can begin. First (fig.2, step 6), the uncorrected upstream coefficients (𝐶u
uncorrected ) are determined following equation (1), which is inspired
from (Strømman & Solli, 2008):
𝑪𝒖𝒏𝒄𝒐𝒓𝒓𝒆𝒄𝒕𝒆𝒅𝒖 = 𝑨𝒊𝒐 . (𝑯̃ ∘ 𝑮𝒆𝒐) . 𝚷̂ (1)
where 𝑨𝒊𝒐 is the commodity-commodity technology matrix of the MRIO table, 𝑯̃ is the filtered
concordance matrix matching processes of the PLCA database to-be-hybridized to product groups of the MRIO database, 𝑮𝒆𝒐 handles the disparity in geographical resolution forming EEIO product groups for each region of the PLCA database (e.g., RER, RoW,...), 𝚷̂ is the diagonalized matrix of prices for each product of the PLCA database, and ∘ represents the Hadamard product.
3.3.2 Streamlined, heuristic-based correction for double-counting
To remove the many excessive inputs of 𝑪𝒖𝒏𝒄𝒐𝒓𝒓𝒆𝒄𝒕𝒆𝒅𝒖 that cause double-counting incidents (step 7),
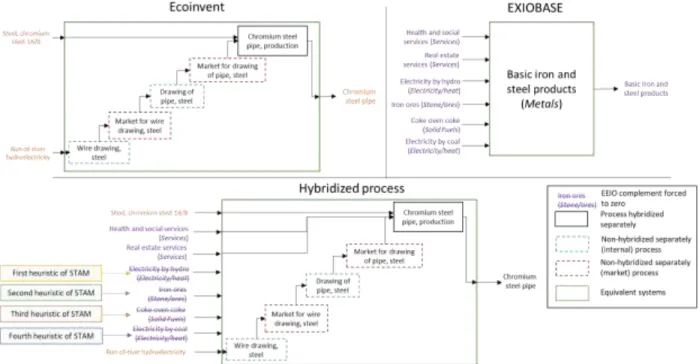
pyLCAIO introduces four filters based on STAM heuristics. These streamlining heuristics are illustrated with a simplified example (figure 3) based on the hybridization of a PLCA process, “chromium steel pipe production” (inspired from Ecoinvent), with the corresponding product group: “Basic iron and steel products” (inspired from EXIOBASE).
During the pre-processing phase, this process was identified as a process to hybridize. It requires inputs from four other processes (among many others) which have been identified as not-to-hybridize-separately, because they are either internal (blue dashed boxes) or market processes (red dashed boxes). Inputs from all these 5 processes are automatically added together in step 5 of pyLCAIO (see SI1 section 2) to be jointly considered during the hybridization (Fig. 3, inputs to green box), through which pyLCAIO strives to avoid overlap between all process requirements (orange) and EEIO inputs (purple flows) in the hybrid system.
Figure 3: Double counting correction illustrated on the hybridization of the ‘chromium steel pipe, production’ process of ecoinvent belonging to the ‘Basic iron and steel products’ product group and to the ‘Metals’ “STAM category” of products. Only a few product groups (purple) and PLCA requirements (orange) are represented here because of space restrictions. Categories to which the different EEIO product groups belong to are specified in the parentheses. Green boundaries represent the equivalence between the PLCA system and the EEIO system. Note that the structure of the ecoinvent process is kept in the resulting hybrid
process and that EEIO complements are only added to the process to hybridize separately. The run-of-river hydroelectricity inputs does not appear directly in the unit process inventory of the chromium steel pipe production but is still considered during
the correction for double counting (refer to SI1 section 2 to see how).
This first STAM heuristic is based on the simplifying assumption that if the process-based inventory already accounted for one requirement from a given product group, then all requirements from this product group have been fully captured. Consequently, the first STAM filter (𝜦) forces to zero all EEIO complements (𝑪𝒖𝒏𝒄𝒐𝒓𝒓𝒆𝒄𝒕𝒆𝒅𝒖 coefficients) for which a matching PLCA process flow is present. The pyLCAIO
software automatically generates this filter matrix of zeros and ones based on product classification concordances (𝑯) and PLCA process inventory data. For example, in figure 3, there is already an input of run-of-river hydro-electricity in the process-based inventory, therefore the EEIO complement “Electricity by hydro” is set to zero.
The second STAM heuristic refines this picture based on the assumption that (unallocated) PLCA inventories strive to respect some fundamental balances, and that an EEIO complement that disrupts these fundamental balances is likely causing double-counting errors. In the present analysis, because of ecoinvent’s emphasis on mass balance in its inventory compilation guidelines (Wernet et al., 2016), the second STAM filter (𝜞̆) removes categories of EEIO inputs that are likely to contribute to the product’s mass and thereby disrupt mass balance. The identification of which inputs likely participate to the mass of which outputs is estimated in terms of broad STAM categories (type 1) by the practitioner in step 0 and recorded in a category-by-category matrix (𝜞). In figure 3, since the category Stone/ores typically participates to the mass of the products from the category Metals (to which the pipe belongs to), adding a complement from this category would break the mass balance and “Iron ores” is therefore set to zero.
The third STAM heuristic is based on the assumption that broad product categories can effectively capture the expert evaluation of database compilers concerning trends in inventory coverage. Instead of reasoning at the flow level, we may use STAM categories to record that a broad category of inputs tends to be well covered in the PLCA production inventories of a given category of products, in close dialogue with database compilers. These categories of requirements, if they prove absent from a given inventory, would then be assumed to mark a specificity of this inventory, rather than an omission in need of being complemented by EEIO data. For instance, the use of Solid Fuels as reducing agents in the manufacture of
Metals is an aspect to which ecoinvent’s control process is attentive. Thus, because it is ensured by
ecoinvent’s control process, an absence of requirements of Solid Fuels in the production of Metals is assumed to represent a particularity of the PLCA process that should then be preserved during hybridization, i.e., not completed by EEIO flows. This third filter (𝜣̆) is based on information recorded by the practitioner in a category-by-category matrix (𝜣).
Finally, the last heuristic of STAM leads to a fourth filter (𝜱̆ ) to remove from the EEIO complement any input flow that fulfills the same technological function as one of the already inventoried PLCA inputs, even if these EEIO and PLCA input flows belong to different product groups. This last heuristic is based on the assumption that the data provider accounted for all technological inputs of same functionality. For instance, there is already a requirement of Electricity/heat in the unit process inventory in figure 3, which is an input of “run-of-river hydroelectricity”. Because “Electricity by coal” has the same function as the run-of-river hydroelectricity, STAM assumes that the absence of “Electricity by coal” is a specificity of the technology; in other words, the absence of coal electricity in the unit process inventory is assumed to not be an erroneous omission, but rather a distinctive real-world characteristic of the process. Categories of products with similar functionalities are thus identified pre-emptively (step 0) in a category-by-category matrix (𝜱), following STAM categories of type 2.
Together, these readily applicable four filters extend equation 1 to reasonably ensure that potential excessive EEIO complements are neutralized out of the hybridization process, as per equation 2:
𝑪𝒖= 𝜱̆ ∘ 𝜣̆ ∘ 𝜞̆ ∘ 𝜦 ∘ [ 𝑨
𝒊𝒐 . (𝑯̃ ∘ 𝑮𝒆𝒐) . 𝚷̂] (2)
3.4 Application for transparency and reproducibility
Every step of the use of pyLCAIO to hybridize ecoinvent3.5 (Ecoinvent centre, 2018) with EXIOBASE3 base year 2011 (EXIOBASE Consortium, 2017), is fully documented in a Jupyter Notebook (GitHub link). In this study, the 200 product groups of EXIOBASE were regrouped in 23 Type 1 and 5 Type 2 STAM categories as detailed in SI2 (folder STAM categories). The data employed by the authors (𝑯, 𝜞, 𝜣, 𝜱) is reported in SI2 (folder STAM data), along with equations through which they are transformed in STAM filters (𝑯̃ , 𝜞̆, 𝜣̆, 𝜱̆ ), in SI1 section How to create the filter matrices.
The price data were directly obtained from ecoinvent3.5 as they were the most convenient and reliable available. These prices, however, were compiled pre-allocation whereas pyLCAIO hybridizes the database post-allocation. They might therefore not always be consistent (instances where the costs are above the price), in which case the pre-processing filter (𝑯̃ ) automatically excludes these processes from the hybridization. Furthermore, prices of ecoinvent3.5 are based on the year 2005 while EXIOBASE3 is composed of time series ranging from 1995 to 2011. An inflation rate of 1.13 was thus applied to update
prices of ecoinvent3.5 to 2011. The products and geography concordance matrices employed by the software are reported in SI2.
The pre-processing filter of pyLCAIO identified 32% of processes in ecoinvent3.5 as “to-hybridize separately”, 27% of ecoinvent3.5 processes were identified as market processes, 12% as internal processes, 4% were dummy processes (without inputs or outputs), 14% of processes had a null/unknown price, 1% of processes had a geography not covered separately by EXIOBASE, 5% had a cost of production greater than their price and 5% were above the fixed price threshold (fixed at 100,000€) (see SI2 for details on the filter). STAM was applied by pyLCAIO to hybridize the technology matrices of both databases, constituting a first application of STAM.
In addition to striving to ensure a database-wide consistent hybridization, we strove to address some issues of both databases in a streamlined manner. First, we replaced the global average electricity price provided by ecoinvent with regionalized, basic electricity prices consistent with EXIOBASE monetary accounts. To this end, we divided monetary production volumes of EXIOBASE electricity technologies in each country by the physical production volumes from the UN Energy Statistics Database (resulting prices available in SI2). Second, we strove to remove small inconsistent flows that were introduced in EXIOBASE3 during the balancing steps. These were removed in broad strokes with an EXIOBASE-specific filter, distinct from the more general STAM filters (see SI2).
Moreover, national productions with production volumes of 10M€ and less were judged to be less reliable and have inconsistencies in their EXIOBASE description (e.g., the very small and potentially atypical production of hydroelectricity in Denmark). Ecoinvent processes matching to these small national product groups were thus hybridized not with national production technology but with the more representative average production of the broader region (e.g., ecoinvent’s hydroelectricity in Denmark was hybridized with hydroelectricity of Europe). PyLCAIO provides a feature to do this automatically.
4. Results
4.1 Database-wide truncation corrections
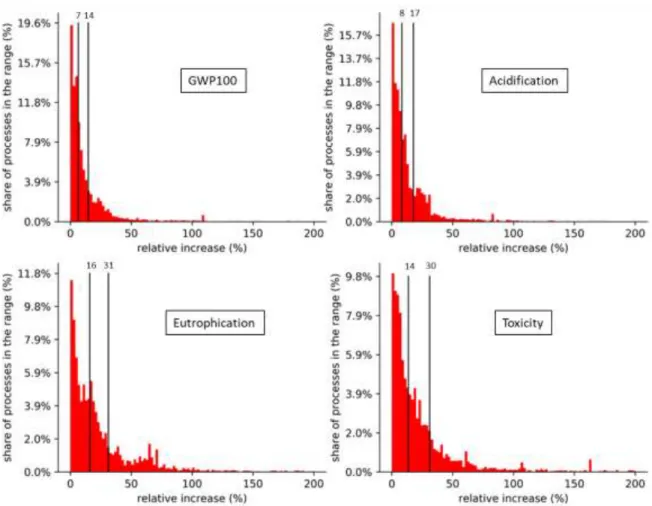
The thousands of hybridized processes in this first version of a hybrid Ecoinvent-EXIOBASE database allows for a representative analysis of the levels of truncation in PLCAs that can be readily corrected in a streamlined manner, i.e., without a detailed understanding of the inventory compilation step of each process. Figure 4 represents the distribution of these corrected truncations as relative increases for four impact categories covered by EXIOBASE extensions: climate change, acidification, eutrophication and human toxicity. The graphs only include hybridized processes, but note that even processes that were not hybridized have their impacts increased through their connections with hybridized processes. The median readily corrected truncation for GWP100 of all hybridized processes is estimated at 7%. A highly skewed distribution leads to an average estimate of 14%, with a standard deviation of 33 percentage points. As the high standard deviation and large difference between the average and the median suggests, estimates per process have a significant variance (from 0% increase to 1,100% increase), although less than 1% of processes display a GWP100 increase above 200%. For acidification, readily corrected truncation estimates are similar to that of GWP100 with a median of 8%, a mean of 17% and a standard deviation of 39 percentage points. Eutrophication has the highest median and average estimates of all four impact categories with respectively 16% and 31% with a standard deviation of 60 percentage points. Finally,
toxicity has a median of 14%, a mean of 30% with a standard deviation of 113 percentage points. Data underlying these graphs are available in the SI3.
We found that roughly three-quarters of the readily corrected truncation of the average process was caused by the omission of direct inputs, whereas one-quarter of the underestimation was introduced indirectly by being linked to processes that are themselves truncated. This distinction may be indicative of the relative importance of hybridizing PLCA foreground processes and background databases.
Figure 4: Estimations of readily corrected truncation of each process of ecoinvent in relative values (for climate change, acidification, eutrophication and human toxicity) processes of ecoinvent that are hybridized. The medians are 7, 8, 16 and 14% for GWP100, acidification, eutrophication and toxicity respectively. The means are 14, 17, 31 and 30% for GWP100, acidification,
eutrophication and toxicity respectively. For each impact category, there are 1 to 3% processes of ecoinvent whose relative increase after hybridization is greater than 200% and are not shown in this figure. Processes that have not been hybridized are
not represented in these graphs, even though their impacts increase after hybridization through their connections with hybridized processes. The underlying data behind these graphs can be found in SI3.
4.2 Corrected truncation per product groups
Database-wide truncation corrections inform on the general state of truncations in PLCA. Corrected truncation per product groups on the other hand can serve as an indicator as to which group of products need more attention from data providers to cope with truncation issues in PLCA. All processes from ecoinvent were thus grouped following the product groups of EXIOBASE using arithmetic averages (table 1). We restricted our analysis to product groups for which at least 10 processes of ecoinvent could be identified. Table 1 only shows estimates per product groups for GWP100 (refer to SI2 for the three other
impact categories). From table 1 it appears that most of the renewable energy processes are among the most truncated product groups relatively speaking. As these technologies are very reliant on services and capital (Crawford, 2009), which ecoinvent and PLCA as a whole struggle to consider, these high relative estimates were to be expected. Note that even if relatively speaking they are among the most truncated product groups, their absolute GWP increases per kWh are equal to those of fossil energies. Primary resources (e.g., ores, crude petroleum, logs) could be expected to be less truncated than manufactured products, since manufactured products have longer value chains (and therefore supposedly more truncation comes along their production). Some of them however (products of forestry, products of clay, stone), are still estimated to be highly truncated compared to manufactured products, in relative terms. Contribution analyses of a few hybridized processes belonging to the 5 most truncated product groups identified in table 1 can be found in SI2 to get insights as to which EEIO complements are added.
Table 1: Relative median, arithmetic average, first and third quartiles, min and max of readily corrected truncations of ecoinvent processes (for GWP100) grouped as product groups of EXIOBASE. Only product groups for which at least 10 processes of ecoinvent could be classified in were assessed. To know to which product group a process of ecoinvent was assigned, refer to the
column product group of the truncation_levels tabs in the SI3. To gain insights as to what EEIO complements are added for highly truncated product groups refer to the SI2.
4.3
Most influential truncated product groups
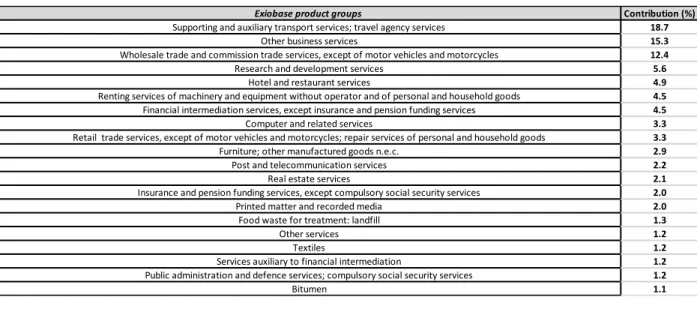
To shed light on the omissions that caused the levels of truncation reported in table 1, table 2 shows product groups whose omission triggered the biggest GWP100 underestimation, in relative terms, throughout the ecoinvent database. These are mostly service-related product groups for which current
PLCA has limited leverage over. The absence of travel agency services in ecoinvent is what is triggering the biggest underestimation on average (18.7%) in the 5095 processes of ecoinvent that were hybridized directly. The main embedded contributors underlying “Other business services” (responsible for 15.3% of truncations in average) are the energy (70%) and business trips (20%) they involve. Efforts in the data collection on including everything related to business trips (e.g., travel agency, hotel, etc.) would therefore constitute the most promising lead to improving the completeness of the process-based inventories. Other important contributors to readily corrected truncation include missing inputs of software, furniture, printed matter and textiles.
Table 2: The 20 economic sectors whose omissions trigger the biggest truncations (in GWP100) in hybridized processes of ecoinvent. For example, the omission of ‘Supporting and auxiliary transport services; travel agency services’, in average, causes
an underestimation of 18.7% in the GWP100 of all directly hybridized processes of ecoinvent.
4.4 PyLCAIO
One of the products of this research is the software developed to hybridize Ecoinvent and EXIOBASE: pyLCAIO, which can be downloaded from Github (https://github.com/MaximeAgez/pylcaio), along with documentation, demonstrations, and unit tests. PyLCAIO uses object-oriented programming with Python and is released under a GNU General Public License. PyLCAIO can thus be downloaded, used, modified and uploaded freely. It leverages ecospold2matrix and pymrio (Pauliuk, Majeau-bettez, Mutel, & Steubing, 2015) to read in Ecoinvent and EXIOBASE respectively, but its hybridization algorithm should be generally applicable to any other similarly structured PLCA and MRIO databases.
PyLCAIO thus constitutes a second available platform to facilitate HLCA, the first being the automated path exchange hybrid (APEH) software (Stephan, Crawford, & Bontinck, 2018). The two software tools differ by the hybrid methodologies chosen: APEH is based on the path exchange method, while pyLCAIO relies on a matrix approach fit for tiered, matrix augmented and integrated hybrid analyses. Although pyLCAIO is tailored toward the application of STAM heuristics for streamlined database hybridization, other methods to correct for double counting are implemented, providing flexible hybrid analyses. Currently, pyLCAIO generates the hybrid database in a matrix format which can be exported in a csv format or a pickle format (i.e., a binary Python data storage format). The hybrid database therefore cannot be directly uploaded to mainstream PLCA software (Simapro, OpenLCA, Brightway2) at the moment. Our
Exiobase product groups Contribution (%)
Supporting and auxiliary transport services; travel agency services 18.7
Other business services 15.3
Wholesale trade and commission trade services, except of motor vehicles and motorcycles 12.4
Research and development services 5.6
Hotel and restaurant services 4.9
Renting services of machinery and equipment without operator and of personal and household goods 4.5 Financial intermediation services, except insurance and pension funding services 4.5
Computer and related services 3.3
Retail trade services, except of motor vehicles and motorcycles; repair services of personal and household goods 3.3 Furniture; other manufactured goods n.e.c. 2.9
Post and telecommunication services 2.2
Real estate services 2.1
Insurance and pension funding services, except compulsory social security services 2.0
Printed matter and recorded media 2.0
Food waste for treatment: landfill 1.3
Other services 1.2
Textiles 1.2
Services auxiliary to financial intermediation 1.2 Public administration and defence services; compulsory social security services 1.2
hope is that pyLCAIO’s open-source development strategy will attract a community of practitioners and researchers for its future development and integration to mainstream software.
5. Analysis and Discussion
5.1 Complexity and validity of streamlining assumptions
While correcting for double counting, a non-null PLCA requirement can either be kept untouched (deemed accurate, not truncated at all) or completed with EEIO inputs (deemed partially truncated). In the STAM framework however, a non-null PLCA requirement is always kept untouched (heuristic 1) meaning that we assume a non-null PLCA requirement to never be underestimated. For example, if a process records an electricity input, we assume that this input accurately captures the totality of the direct electricity requirements of the process. In addition, heuristics 2 to 4 also deem some null requirements of PLCA to not be caused by truncation. As a result, the STAM framework is a conservative method, which would rather err toward leaving some remaining truncation rather than overestimating inputs through uncorrected double-counting. This approach contrasts with other methods that are less comprehensive in their correction of truncation and are thus more likely to double count inputs, leading to potential overestimations of hybrid life cycle emissions, e.g., binary method or by-product correction (Agez et al., 2019).
The second heuristic of STAM (non-disruption of mass balance) required particular attention in its implementation, as not all additional EEIO inputs that have a mass necessarily contribute to the mass of the final product. Many products such as pesticides and fuels are dissipated during their use; they might therefore have been omitted even in mass-balanced PLCA inventories and should be kept in EEIO complements. As PLCA databases progress toward recording more product properties, it may become easier to (1) test the extent to which different processes are actually aligned with STAM’s assumption that (unallocated) processes tend to include all inputs that contribute to a product’s mass because of the respect for mass balance, and to (2) extend STAM’s second heuristic to other balances, such as conservation of energy and the different chemical elements. Finally, working at the category level for this heuristic also sometimes wrongly sets EEIO complements to zero, leading to underestimations. It should be kept in mind, however, that the goal of this framework is not to provide an absolute and precise quantification of what is or is not properly accounted for by the PLCA database, but to quickly reason in terms of large-scale, transparent and modifiable set of heuristics.
STAM categories, product concordances and prices used in this study were defined subjectively and only constitute a first step. We expect them to be refined, with the help of a broader community of researchers, throughout the expansion of pyLCAIO.
5.2 Outliers analysis
While most of the processes from Ecoinvent display reasonable levels of truncation corrections, there are also about 1% of the processes whose increases in GWP100 scores are greater than 100% after hybridization with EXIOBASE. Most of these high relative increases however, correspond to minor absolute increases. For instance, the production of 1kg of tap water in Canada has a 1.6E-5kgCO2eq
GWP100 score initially and ends up at 5.8E-5kgCO2eq after hybridization, thus corresponding to a 268%
Ecoinvent processes that also display non-negligible absolute increases (i.e., > +0.1 kgCO2eq/functional
unit).
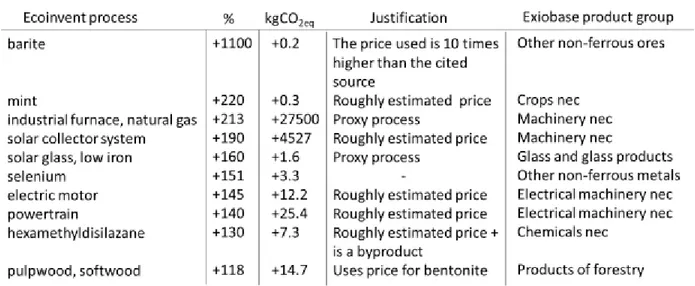
Figure 5: The 10 processes of ecoinvent with a relative correction truncation greater than 100%, resulting in a non-negligible absolute increase of the GWP100 (>0.1kgCO2eq/functional unit). For each of the processes, their corresponding product group
(i.e., with which they were hybridized) is provided as well as a possible explanation as to why their relative increase is this high. For all these processes, their respective EEIO product group appear to not be representative of their reality, mostly coming from
the aggregation of EEIO.
Typical outliers in our analysis will mainly result from the unrepresentativeness triggered by the aggregation in EEIO. This aggregation can occur both at the technology level (many different technologies regrouped to describe the production of a product, e.g., an “Electricity” product group in typical MRIO databases) or at the product level (many different products and technologies regrouped in a product group, e.g., “Machinery nec” or other not else classified product groups). In both cases, the description provided by EEIO can fail to represent the process of the LCA database, leading to high relative increases after hybridization. Even when an EEIO product group or technology is rather uniform, the EEIO complement can be unrepresentative of the description of a very specific process if this process differs greatly from the rest of its product group. For instance, in figure 5, the “Glass and glass products” is not a very aggregated product group; yet its description does not fit the production of “solar glass” as this technology is atypical among other glass products.
The high level of truncation identified for these processes can also be due to several additional factors. - The results are highly sensitive to price, as there is a linear relationship between price and EEIO
complements. In other words, a 10-fold overestimation of the price lead to EEIO complements being overestimated by 10-fold. Such high truncation levels can thus result from the price data of the product from Ecoinvent simply being over-estimated (e.g., for the barite production process) or being roughly estimated (e.g., for the mint production process). Price data for these products can automatically be replaced in the pyLCAIO framework when the PLCA database provider will update its prices or can be directly modified by the pyLCAIO user.
- Companies can sometimes include purchases to feed their employees in their declaration. Doing so artificially increases the emissions linked to the product as the employees would still eat even
if the product was not manufactured. PyLCAIO offers the possibility to the user to answer this potential issue as he pleases by setting or not categories of consumables as already covered by the PLCA database in the 𝜣 filter matrix. In this analysis, food products purchased by the companies were not included.
- Proxies (processes described using another similar unit process of an LCA database) and nearly empty processes (i.e., processes barely requiring any inputs) will inherently have high truncation levels as they are very different from the average of the product group. Proxy processes should not be hybridized as long as the process they are copying is hybridized itself and the filter of pyLCAIO could thus be updated to identify and not hybridize them. For nearly empty processes however, their hybridization could sometimes be justified and thus there is no immediate way to identify which ones should be hybridized.
For these outliers, the streamlined hybridization proposed in this paper might not be adapted, but it only corresponds to less than 1% of ecoinvent’s processes. It should be kept in mind also that the goal of this project is to streamline the hybridization and not provide the absolute hybridization of each individual process. Furthermore, pyLCAIO allows the user to exclude these processes from being separately hybridized.
5.3 Conservative truncation levels and implications
This study resulted in a representative estimation of truncations with a mean of 14%, which is lower than the isolated estimates found in the literature (between 20 and 100%). Care must be taken however, when comparing these estimates as there are considerable differences between the methodologies used. First, estimates from this paper correspond to truncation levels once the whole database has been hybridized, while in the literature only one process is hybridized and then linked to non-hybridized processes. Truncation estimates from this research are therefore more comprehensive and should on average be larger than estimates without a hybrid database. Then, estimates in the literature were mostly calculated following a different method to correct double counting, which typically has a significant impact on results (Agez et al., 2019). We must stress that the STAM method employed in this study aims to preserve the specificity of HLCA processes and deliberately strive for a conservative correction of any double-counting incident, which may unfortunately lead to a potential underestimation of truncation levels overall. Moreover, EXIOBASE does not endogenize capitals in its original version and emissions of products value chains from EXIOBASE are therefore underestimated themselves; in other words, estimates of truncation obtained with endogenized capitals would be higher than the ones of this study. Estimates from this article
are therefore likely to be underestimating the real truncation of PLCA and better represent an estimation of the truncation that can be readily corrected through a streamlined approach.
The estimations of readily corrected truncation in PLCA may help identify where to prioritize resources in an analysis. Indeed, while hybridization should ideally always be carried out to remove truncation issues in PLCA, table 1 can help deciding when hybridization could be skipped for time and money issues. For instance, comparing a non-hybridized solar power plant process to a non-hybridized wind farm process is more prone to lead to false conclusions, given the high average relative truncations of both processes and close levels of emissions per kWh. Comparing a non-hybridized coal power plant to a non-hybridized gas power plant however, will probably lead to the same conclusions after hybridization.
There are limitations to this first deployment of the pyLCAIO framework. First, the hybridization at the supply and use level is not implemented. Currently, pyLCAIO can only hybridize symmetric technology matrices of PLCA and EEIO and cannot process unallocated versions of PLCA database or supply and use tables of EEIO. Working at the technology matrix level triggers some inconsistencies. As mentioned previously, price data for Ecoinvent for example, are compiled pre-allocation and are therefore not always adapted to post-allocation versions of the database. Furthermore, allocation methods used in PLCA databases are not uniform for each process (sometimes monetary, sometimes carbon content, sometimes expert knowledge), while MRIO databases rely on a single allocation assumption to underpin its construct, thus triggering inconsistencies. The goal of this project being to enable the quick creation of one’s own hybrid database, we chose to work at the technology matrix level, as there remains restrictions to accessing all unallocated processes of Ecoinvent.
In order to improve the quality of HLCA, additional work must be done to expand the coverage of environmental stressors in MRIO. For instance, EXIOBASE3 only covers about 2% of the environmental stressors of Ecoinvent3.5. It means that the truncation is therefore corrected for only these 2% environmental stressors from Ecoinvent. In other words, main environmental stressors (e.g., CO2 in air)
will be completed through hybridization, but not marginal environmental stressors (e.g., t-Butylamine in water) because the latter are not currently quantified by EXIOBASE. Levels of truncations of this research for toxicity for instance, might therefore still be underestimated as the environmental extensions of EXIOBASE are still lacking.
PyLCAIO currently constitutes a framework incorporating data from an MRIO database to complement a PLCA database. This framework could be further improved to also allow the use of PLCA database data to disaggregate an MRIO database. Such an integration would require accurate price data as well as production volumes, in order to remove the integrated technology from the EEIO production function. Not all the PLCA database has to be integrated into the MRIO database but disaggregating the functional unit from its EEIO aggregated sector would allow prospective scenario analyses. For instance, disaggregating electric cars from “motor vehicles” could coarsely model (based on current technologies) what would be the impacts on the economy and environment of an increase in electric car purchases on a national or global scale.
Finally, to better solve truncation issue in PLCA and not rely on ad-hoc methods to correct double counting, data providers would need to explicitly report zero entries. For now, hybrid practitioners are left guessing if a missing requirement is due to specificity (e.g., no pesticides in an organic farm) or due to truncation (e.g., the inventory does not include the packaging of the pesticides).
7.
Conclusion
The article presented the challenges and proposed answers to the development of a PLCA-EEIO hybrid database. It resulted in a general estimation of 14% for readily corrected truncations in PLCA based on a representative sample. Individual estimations for each product group were also assessed, which can provide insights on the necessity of hybridization to ensure the robustness of comparative studies. This paper also presented the most significant key missing data which can be used by database compilers to direct efforts in improving the accuracy of the descriptions of our technologies.
While hybrid LCAs are considered more accurate than traditional PLCA by resolving truncation/boundary issues (Gibon et al., 2015), they are rarely applied because of the increased requirements in data (mainly
prices) and required efforts and expertise to create the framework of hybridization. Thanks to Ecoinvent3 which now compiles price data for its processes (Wernet et al., 2016) and to pyLCAIO which enables non-experts to efficiently perform hybridization with transparent assumptions, these practical issues are finally being resolved. Credibility is perhaps the main remaining barrier to the full adoption of hybrid LCA. We hope that the efforts to keep the specificity of the PLCA whilst providing transparency to the hybridization helps in this endeavour.
8. Acknowledgement
The authors would like to thank Guillaume Bourgault from the ecoinvent center for his valuable inputs on the applicability of our methodology to the Ecoinvent database. The authors would also like to acknowledge the financial support of the industrial partners of the International Chair in Life Cycle Assessment (a research unit of the CIRAIG): Arcelor-Mittal, Hydro-Québec, LVMH, Michelin, Nestlé, Optel, Solvay, Total and Umicore. The authors declare no conflict of interest and remain solely responsible for the article.
9.
References
Agez, M., Majeau-Bettez, G., Margni, M., Strømman, A. H., & Samson, R. (2019). Lifting the veil on the correction of double counting incidents in hybrid Life Cycle Assessment. Journal of Industrial
Ecology, 1–17. https://doi.org/https://doi.org/10.1111/jiec.12945
Arvesen, A., Birkeland, C., & Hertwich, E. G. (2013). The importance of ships and spare parts in LCAs of offshore wind power. Environmental Science and Technology, 47(6), 2948–2956.
https://doi.org/10.1021/es304509r
Arvesen, A., Nes, R. N., Hertwich, E. G., & Huertas-Hernando, D. (2014). Life cycle assessment of an offshore grid interconnecting wind farms and customers across the North Sea. The International
Journal of Life Cycle Assessment, 826–837.
Bontinck, P.-A., Crawford, R. H., & Stephan, A. (2017). Improving the Uptake of Hybrid Life Cycle Assessment in the Construction Industry. Procedia Engineering, 196(June), 822–829. https://doi.org/10.1016/j.proeng.2017.08.013
Bullard, C. W., & Penner, P. S. (1978). Net Energy Analysis: Handbook for Combining Process and Input-Output Analysis. Resources Energy, 267–313.
Crawford, R. H. (2009). Life cycle energy and greenhouse emissions analysis of wind turbines and the effect of size on energy yield. Renewable and Sustainable Energy Reviews, 13(9), 2653–2660. https://doi.org/10.1016/j.rser.2009.07.008
Crawford, R. H., Bontinck, P.-A., Stephan, A., Wiedmann, T., & Yu, M. (2018). Hybrid life cycle inventory methods – A review. Journal of Cleaner Production, 172, 1273–1288.
https://doi.org/10.1016/j.jclepro.2017.10.176
Ecoinvent centre. (2018). Ecoinvent database (version 3.5). [Cut-off system model]. Retrieved from the ecospold files. Retrieved December 18, 2018, from https://v35.ecoquery.ecoinvent.org/File/Files European Commission. (2008). Eurostat Manual of Supply, Use and Input-Output Tables.
EXIOBASE Consortium. (2017). EXIOBASE (Version 3) [product-by-product
industry-technology-assumption coefficients, for year 2011]. Retrieved from EXIOBASE. Retrieved March 14, 2019, from https://www.exiobase.eu/index.php/data-download/exiobase3mon?limit=20&limitstart=20 Gibon, T., & Schaubroeck, T. (2017). Lifting the fog on characteristics and limitations of hybrid LCA.
International Journal of Life Cycle Assessment, 22(6), 1005–1008.
https://doi.org/10.1007/s11367-017-1291-1
Gibon, T., Wood, R., Arvesen, A., Bergesen, J. D., Suh, S., & Hertwich, E. G. (2015). A Methodology for Integrated, Multiregional Life Cycle Assessment Scenarios under Large-Scale Technological Change.
Environmental Science and Technology, 49(18), 11218–11226.
https://doi.org/10.1021/acs.est.5b01558
Hawkins, T. R., Singh, B., Majeau-bettez, G., & Strømman, A. H. (2012). Comparative Environmental Life Cycle Assessment of Conventional and Electric Vehicles, 17(1), 53–64.
https://doi.org/10.1111/j.1530-9290.2012.00532.x
International Organization for Standardization. (2006). ISO 14040 - Environmental management - Life
cycle assessment-Principles and framework.
Islam, S., Ponnambalam, S. G., & Lam, H. L. (2016). Review on life cycle inventory: methods, examples and applications. Journal of Cleaner Production, 136, 266–278.
https://doi.org/10.1016/j.jclepro.2016.05.144
Jeswani, H. K., Azapagic, A., Schepelmann, P., & Ritthoff, M. (2010). Options for broadening and deepening the LCA approaches. Journal of Cleaner Production, 18(2), 120–127.
https://doi.org/10.1016/j.jclepro.2009.09.023
Junnila, S. I. (2006). Empirical comparison of process and economic input-output life cycle assessment in service industries. Environmental Science and Technology, 40(22), 7070–7076.
Lenzen, M. (2000). Errors in Conventional and Input-Output—based Life Cycle Inventories. Journal of
Industrial Ecology, 4(4), 127–148. https://doi.org/10.1162/10881980052541981
Lenzen, M., & Crawford, R. (2009). The path exchange method for hybrid LCA. Environmental Science
and Technology, 43(21), 8251–8256. https://doi.org/10.1021/es902090z
Majeau-Bettez, G., Strømman, A. H., & Hertwich, E. G. (2011). Evaluation of process- and Input-Output-based Life CycleInventory Databases with Regards to Truncation and Aggregation Issues.
Environmental Science & Technology, 45(23), 10170–10177. https://doi.org/10.1021/es201308x
Majeau-Bettez, G., Wood, R., & Strømman, A. H. (2014). Unified theory of allocations and constructs in life cycle assessment and input-output analysis. Journal of Industrial Ecology, 18(5), 747–770. https://doi.org/10.1111/jiec.12142
Michelsen, O., Solli, C., & Strømman, A. H. (2008). Environmental impact and added value in forestry operations in Norway. Journal of Industrial Ecology, 12(1), 69–81. https://doi.org/10.1111/j.1530-9290.2008.00008.x
Miller, R. E., & Blair, P. D. (2009). Input – Output Analysis. Cambridge University Press.
Mongelli, I., Suh, S., & Huppes, G. (2005). A Structure Comparison of two Approaches to LCA Inventory Data, Based on the MIET and ETH Databases. The International Journal of Life Cycle Assessment,