HAL Id: hal-00608310
https://hal.archives-ouvertes.fr/hal-00608310
Submitted on 12 Jul 2011
HAL is a multi-disciplinary open access
archive for the deposit and dissemination of
sci-entific research documents, whether they are
pub-lished or not. The documents may come from
teaching and research institutions in France or
abroad, or from public or private research centers.
L’archive ouverte pluridisciplinaire HAL, est
destinée au dépôt et à la diffusion de documents
scientifiques de niveau recherche, publiés ou non,
émanant des établissements d’enseignement et de
recherche français ou étrangers, des laboratoires
publics ou privés.
Aligning subjective tests using a low cost common set
Yohann Pitrey, Ulrich Engelke, Marcus Barkowsky, Romuald Pépion, Patrick
Le Callet
To cite this version:
Yohann Pitrey, Ulrich Engelke, Marcus Barkowsky, Romuald Pépion, Patrick Le Callet. Aligning
subjective tests using a low cost common set. Euro ITV, Jun 2011, Lisbonne, Portugal. pp.irccyn
contribution. �hal-00608310�
Aligning subjective tests using a low cost common set
Yohann Pitrey, Ulrich Engelke, Marcus Barkowsky, Romuald Pépion, Patrick Le Callet
LUNAM Université, Université de Nantes, IRCCyN UMR CNRS 6597
(Institut de Recherche en Communications et Cybernétique de Nantes), Polytech
NANTES, FRANCE
{first-name.last-name}@univ-nantes.fr
ABSTRACT
In this paper we use a common set between three subjective tests to build a linear mapping of the results of two tests onto the scale of one test identified as the reference test. We present our low-cost approach for the design of the common set and discuss the choice of the reference test. The mapping is then used to merge the outcomes of the three tests and provide an interesting comparison of the impact of coding artifacts, transmission errors and error-concealment in the context of Scalable Video Coding.
General Terms
sujective quality assessment, inter-experiment mapping, scalable video coding, error-concealment
1.
INTRODUCTION
Subjective quality experiments are typically conducted with respect to international recommendations, such as ITU-T Rec. BT-500.11, in order to produce reliable and repro-ducible outcomes. Despite the strict rules defined in these recommendations, a lot of factors have an impact on the test results which cannot easily be controlled. They lead to a set of context effects that turn each experiment into a non standard environment. As a consequence, special consider-ations have to be taken into account in order to compare test results between different laboratories or different exper-iments. Typically, this involves mapping the outcomes of different tests onto a common scale. The common scale is usually built on a subset of conditions shared by all tests, or by groups of experiments. The design of the common set is of great importance for the mapping, to represent precisely the relation between tests.
In this paper, we make use of such a method in order to compare the Mean Opinion Scores (MOS) of three subjective experiments that we conducted in the context of Scalable Video Coding. The originality of our approach is to include the common conditions during the design of the test, so that no extra experiment needs to be conducted in order to
build the mapping between tests. After choosing a reference test to map onto, we use a simple linear mapping to derive relationships between the different experiments.
The paper is organized as follows. In Section 2 we briefly introduce the three experiments we conducted. In Section 3, we discuss the mapping of the MOS onto the common scale. Results are presented in Section 4 and conclusions are drawn in Section 5.
2.
DESIGN OF EXPERIMENTS
We conducted three subjective experiments containing vari-ous Hypothetical Reference Circuits (HRC), in order to eval-uate the impact of video coding artifacts, transmission er-rors and error-concealment techniques in the context of Scal-able Video Coding (SVC). All the tested videos are in VGA (640×480 pixels) and QVGA (320×240 pixels) formats, dis-played at 15 or 30 frames per second. Nine video sequences of 12 seconds each were used, representing a good variety of contents and high spatial and temporal activity ranges. The perceived quality was assessed using the Absolute Cate-gory Rating (ACR) methodology with 5 levels of quality, and conducted in a subjective test room with standard viewing conditions [1].
In the first test (T1), the impact of error-concealment and encoding parameters on two-layer SVC streams is evaluated. We simulate a loss of one second during which no data is re-ceived for the highest layer. The visual artifacts induced by the lost data are concealed using two techniques based on upscaling the base layer, which is assumed to be always available. The first technique is referred to as ”switched” and consists in replacing the whole distorted frame with an upscaled version of the corresponding frame from the base layer. The second technique is referred to as ”patched” and consists in replacing only the distorted area in the frame with the upscaled area from the corresponding frame in the base layer. Two constant bit-rate scenarios are combined with two base-layer temporal frequencies in order to iden-tify the best encoding configuration in such a context. The HRCs in this test are referred to using a structure similar to ”120/600kb/s-30Hz-switched”, reflecting the bitrate used for the two layers, the frequency of the base layer and the error-concealment technique (more details about this test can be found in [4]). For reference, one AVC HRC is included in this test under the same conditions of distortion. The artifacts are concealed using a state-of-the-art technique, based on reusing the last non distorted frames and buffer repetition. In the second test (T2), we evaluate the impact of two-layer
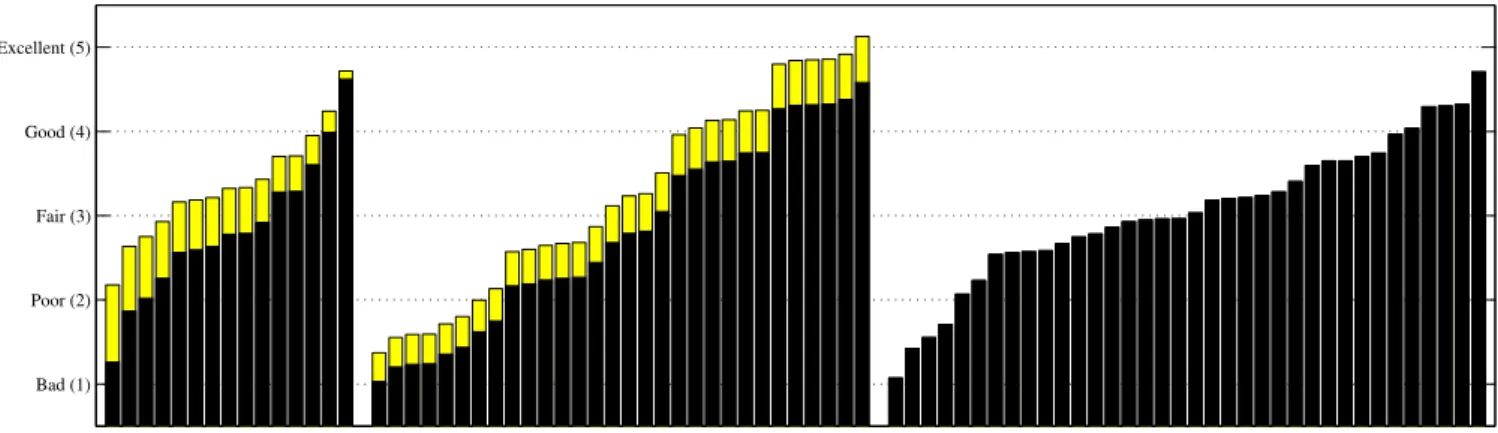
Bad (1) Poor (2) Fair (3) Good (4) Excellent (5)
Figure 1: Overview of the MOS values for the three tests. From left to right: T1, T2, T3. Lower part of bars (dark-coloured): before mapping, upper part (light-coloured): after mapping on the scale of T3.
SVC coding artifacts on the perceived quality, without trans-mission errors. We use four 26, 32, 38 and 44 as QP values for each layer, leading to 16 combinations of QP. We also include the 4 versions of the upscaled base layer encoded using the same four QP values. The HRCs from this test are referred to using a structure similar to ”QP38/44”, 38 being the QP value for the base layer and 44 the QP value for the enhancement layer. The upscaled base layer HRCs are referred to as ”QP 38 Upscaled”.
In the third test (T3), we evaluate the impact of the distri-bution of network impairments on a subset of streams from T2. Four factors are varied: the quality of the base layer, the number of impairments, the total length of the impairments and the interval between two impairments. The HRCs from this test are referred to using the values of QP for the two layers and a succession of numbers of frames displayed from each layer in turn. For instance in ”44/32 -32-16-32-”, the ”44/32” part means that the video was encoded with QP 44 for base layer and 32 for enhancement layer. The ”-32-16-32-” part means that two impairments of 32 frames are displayed, separated by 16 frames (more details about this test can be found in [5]). During the impairments, we use the ”switched” error-concealment technique from T1. The positions of the impairments are calculated so that they are globally centered on the middle of the sequence.
We designed the three experiments so that they share a sub-set of configurations called the common sub-set, used for com-paring their respective outcomes. This common set provides a basis to perform fitting operations, in order to compare the results of the three tests. The design of the common set and the fitting process are described in the next section.
3.
METHODOLOGY
During a subjective test, the viewers tend to use the full quality scale, independently from the distribution of the ex-pected quality scores of the presented sequences [2]. This phenomenon, known as the corpus effect, forbids direct com-parison of the results from different subjective tests. How-ever, presenting a common set of configurations in several tests allows mapping the results from one test onto another, and comparing them as the outcomes of a single test. When trying to compare more than two tests, the use of a refer-ence test has been proposed to facilitate direct comparison between HRCs from different tests [2, 3]. For this purpose,
the conditions contained in the reference test should cover qualities that are evenly spread over a wide range of quali-ties. To achieve this goal, different methodologies have been deployed in the past.
In [3] the authors create a reference test, which they re-fer to as a meta-test, from a set of 6 subjective tests. For that purpose, a subset of 185 Processed Video Sequences (PVS) were carefully selected from 479 available PVS, with respect to a uniform quality distribution over the range of the scale. These sequences were then used to conduct an-other quality test. The MOS from the 6 original tests were then mapped onto the MOS from the meta-test to facilitate comparison between the original MOS. Despite the clear ra-tionale behind this method and the thorough conduction of its implementation, it is apparent that the preparation of an additional test is cumbersome and time consuming. In addition, a new meta-test needs to be created whenever a new test is to be included for comparison.
The work in [2] reports on mapping to a reference test fo-cussing on the particular context of IPTV degradations. Here, a different approach has been chosen by preemptively designing a reference test that contains a wide perceptual range of IPTV degradations. Subsequently, four other tests were designed that focus on a selective subset of degrada-tions. This approach is mainly applicable in case where a particular application is considered and the range of degra-dations can be estimated. Thus, it assumes that the refer-ence test is already designed with regard to the tests that are to be compared. Such foresight, however, is not always given and often it is of interest to compare tests without a reference test being available.
In our work, we therefore take a different approach that avoids conducting additional tests and that also does not ex-pect a reference test to be available for the mapping. When designing a new experiment, we include several configura-tions in it that come from the existing common set. All our tests share a small amount of configurations, on which we rely to perform mapping operations between experiments. Given a set of available tests, we carefully determine the most suitable test with respect to similar constraints as in the previous works. Hence, this approach is adaptive to the current problem at hand as it relies only on the data avail-able.
1 2 3 4 5 1 2 3 4 5 T1 T3
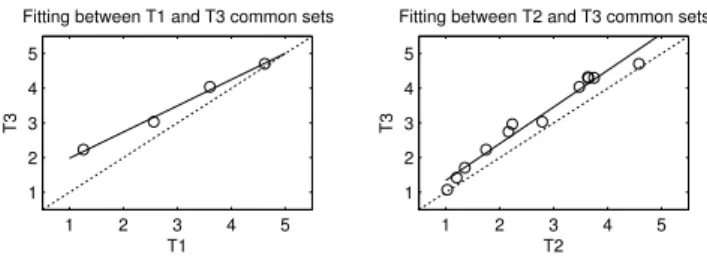
Fitting between T1 and T3 common sets
1 2 3 4 5 1 2 3 4 5 T2 T3
Fitting between T2 and T3 common sets
Figure 2: Linear fitting functions from T1 and T2 onto T3.
Four HRCs are shared by T1, T2 and T3. These four con-ditions contain SVC coding distortions, transmission errors, upscaling artifacts and temporal discontinuities. Moreover, as the T2 and T3 tests are closer to each other in terms of evaluated factors, they share another 9 HRCs, raising the size of the common set to 14 HRCs. These additional HRCs contain a wider variety of coding distortions and transmis-sion errors in order to get a more accurate mapping between the two experiments.
The condition MOS (i.e. average opinion scores on all ob-servers and all source contents) of the three tests are pre-sented in Figure 1 in order of increasing magnitude. It can be seen that all three tests cover a wide range of qualities with test T3 covering the widest range. For this reason, we choose T3 to be the reference test in the scope of this work. We derived linear mapping functions to map the MOS from tests T1 and T2 onto the scale of test T3 as follows:
yT i= aixT i+ bi,
where xT iis the MOS of T1 and T2, and yT iis the mapped
MOS on the T3 scale. The parameters aiand biwere
deter-mined using linear regression between the condition MOS of the common sets of HRCs respectively from T i and T 3. The mappings are illustrated in Figure 2 and the corresponding mapping parameters are presented in Table 1.
Figure 2 first shows the repartition of the configurations from the common set on the quality scale. This indicates that the MOS of both T1 and T2 are highly correlated to the MOS of T3. In fact, the linear correlation between T1 and T3 is equal to 0.995 and the linear correlation between T2 and T3 is equal to 0.985. It should be noted that for both mappings, the original reference sequence (HRC0) is approximatly at the same location and very close to the diagonal. This indicates that the non-distorted reference sequences were rated very similarly between the three tests. From Figure 2 one can further see that in both cases the mapping functions are above the diagonal, meaning that the MOS are generally alleviated for both T1 and T2. This is also illustrated in Figure 1, where the mapped MOS are dis-played above the MOS scores for T1 and T2. It can be ob-served that one mapped MOS value in T2 is slightly outside of the scale. This is a result of the mapping between T2 and T3 being considerably above the diagonal and hence, the already high quality reference condition is mapped slightly outside the scale. This might indicate that the scale was compressed at the upper end for this particular test. After mapping the results of T1 and T2 onto the scale of T3, we consider the outcomes of the three tests as a single experiment. In the next section, we conduct an analysis of
a1 b1 a2 b2
0.759 1.212 1.058 0.281
Table 1: Linear mapping parameters from T1 and T2 to T3.
the mapped MOS values, in order to compare the influence of the three types of distortions to each other, namely error concealment, SVC coding artifacts and impairment distri-butions.
4.
RESULTS AND DISCUSSION
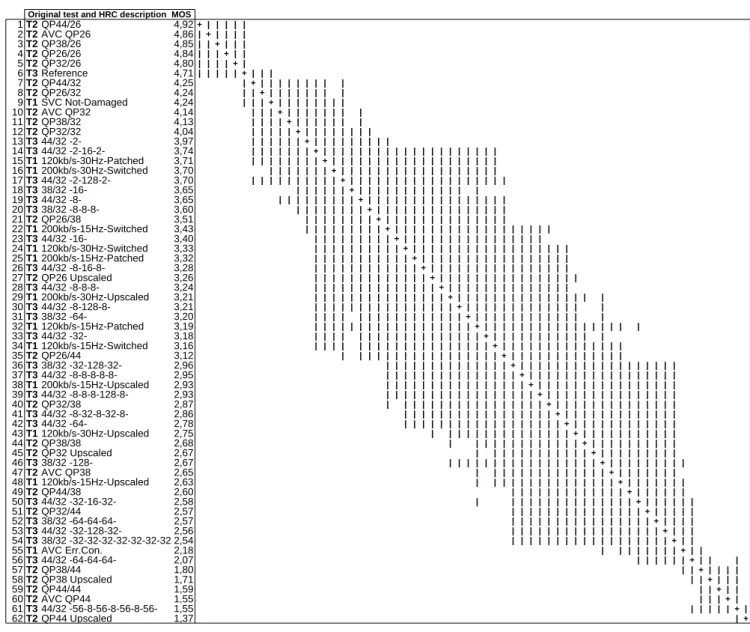
A total of 82 HRCs result from joining T3 and the mappings of T1 and T2 onto T3. This super-set of HRC contains a large amount of different conditions with distinct kinds of distortions. To get a good overview of this large amount of data, Figure 3 compares the different HRCs from the 3 tests after mapping. We display the original test of each HRC as well as a short description following the structures intro-duced in section 2. On Figure 3, each HRC is represented by a black symbol on the same line as its description. The grey intervals on the upper and lower parts symbolize the HRCs that are statistically equivalent to one given HRC. The statistical equivalence between configurations is deter-mined using the 95% intervals of confidence, calculated on the data after fitting.
As an example of interesting results, we can observe that the reference HRC from T3 (line 6) gets an equivalent quality to (but slightly lower than) the SVC HRCs using a QP of 26 for the enhancement layer (lines 1-5). This might iden-tify a saturation effect at the top of the quality scale, as the viewers fail to give the reference a significantly higher score than the already-high quality HRCs. Alternatively, it couls indicate that a QP of 26 is perceived as lossless by the view-ers in our scenario. The corpus effect is also illustrated here, as the high quality SVC HRCs, which only contain limited coding artif and testingacts, are perceived equivalent to the reference in the context of network impairments such as the one in T3.
The mapping of the three tests allows for comparison of HRCs that are located on distinct dimensions of distortion. For instance one can observe that the upscaled SVC base layer encoded with a QP of 26 (line 27) is equivalent to several two-layers SVC streams impaired by different loss patterns (e.g.: lines 23, 26, 28, 31). However, the upscaled version only needs an average bitrate of 0.84 Mb/s to be encoded, which is about half the bitrate needed to transmit one of the equivalent two-layer streams. Therefore, using a good quality video and upscaling may represent an interest-ing alternative to multiple layers.
One can also draw a parallel between constant bitrate and constant quality configurations. For instance, the 120-600kb/s-30Hz-switch HRC from T1 (line 24) is statistically equivalent in terms of quality to the 44/32 -32- configuration from T3, which has the same network impairment pattern. A correspondence can then be made between QP values and bitrate, which can be useful for the design of adapted bit-streams without using costly bitrate control techniques.
Original test and HRC description MOS 1 T2 QP44/26 4,92+ | | | | | 2 T2 AVC QP26 4,86| + | | | | 3 T2 QP38/26 4,85| | + | | | 4 T2 QP26/26 4,84| | | + | | 5 T2 QP32/26 4,80| | | | + | 6 T3 Reference 4,71| | | | | + | | | 7 T2 QP44/32 4,25 | + | | | | | | | | | 8 T2 QP26/32 4,24 | | + | | | | | | | | 9 T1 SVC Not-Damaged 4,24 | | | + | | | | | | | | 10 T2 AVC QP32 4,14 | | | + | | | | | | | | 11 T2 QP38/32 4,13 | | | | + | | | | | | | 12 T2 QP32/32 4,04 | | | | | + | | | | | | | | 13 T3 44/32 -2- 3,97 | | | | | | + | | | | | | | | | 14 T3 44/32 -2-16-2- 3,74 | | | | | | | + | | | | | | | | | | | | | | | | | | | | 15 T1 120kb/s-30Hz-Patched 3,71 | | | | | | | | + | | | | | | | | | | | | | | | | | | | 16 T1 200kb/s-30Hz-Switched 3,70 | | | | | | | + | | | | | | | | | | | | | | | | | | 17 T3 44/32 -2-128-2- 3,70 | | | | | | | | | | + | | | | | | | | | | | | | | | | | | 18 T3 38/32 -16- 3,65 | | | | | | + | | | | | | | | | | | | | 19 T3 44/32 -8- 3,65 | | | | | | | | | + | | | | | | | | | | | | | | | | 20 T3 38/32 -8-8-8- 3,60 | | | | | | | | + | | | | | | | | | | | | | | | 21 T2 QP26/38 3,51 | | | | | | | | + | | | | | | | | | | | | | | 22 T1 200kb/s-15Hz-Switched 3,43 | | | | | | | | | + | | | | | | | | | | | | | | | | | | 23 T3 44/32 -16- 3,40 | | | | | | | | | + | | | | | | | | | | | | | | | | 24 T1 120kb/s-30Hz-Switched 3,33 | | | | | | | | | | + | | | | | | | | | | | | | | | | | | 25 T1 200kb/s-15Hz-Patched 3,32 | | | | | | | | | | | + | | | | | | | | | | | | | | | | | 26 T3 44/32 -8-16-8- 3,28 | | | | | | | | | | | | + | | | | | | | | | | | | | | | | 27 T2 QP26 Upscaled 3,26 | | | | | | | | | | | | | + | | | | | | | | | | | | | | | | 28 T3 44/32 -8-8-8- 3,24 | | | | | | | | | | | | | | + | | | | | | | | | | | | | | 29 T1 200kb/s-30Hz-Upscaled 3,21 | | | | | | | | | | | | | | | + | | | | | | | | | | | | | | | | 30 T3 44/32 -8-128-8- 3,21 | | | | | | | | | | | | | | | | + | | | | | | | | | | | | | | 31 T3 38/32 -64- 3,20 | | | | | | | | | | | | | | | | + | | | | | | | | | | | | | 32 T1 120kb/s-15Hz-Patched 3,19 | | | | | | | | | | | | | | | | | | + | | | | | | | | | | | | | | | | | 33 T3 44/32 -32- 3,18 | | | | | | | | | | | | | | | | | | + | | | | | | | | | | | | 34 T1 120kb/s-15Hz-Switched 3,16 | | | | | | | | | | | | | | | | | | | + | | | | | | | | | | | | | | 35 T2 QP26/44 3,12 | | | | | | | | | | | | | | | | | + | | | | | | | | | | | | | 36 T3 38/32 -32-128-32- 2,96 | | | | | | | | | | | | | | + | | | | | | | | | | | | | | | | | | 37 T3 44/32 -8-8-8-8-8- 2,95 | | | | | | | | | | | | | | | + | | | | | | | | | | | | | | | | | 38 T1 200kb/s-15Hz-Upscaled 2,93 | | | | | | | | | | | | | | | | + | | | | | | | | | | | | | | | | 39 T3 44/32 -8-8-8-128-8- 2,93 | | | | | | | | | | | | | | | | | + | | | | | | | | | | | | | | | 40 T2 QP32/38 2,87 | | | | | | | | | | | | | | | | | + | | | | | | | | | | | | | | 41 T3 44/32 -8-32-8-32-8- 2,86 | | | | | | | | | | | | | | | | | + | | | | | | | | | | | | | 42 T3 44/32 -64- 2,78 | | | | | | | | | | | | | | | | | | + | | | | | | | | | | | | 43 T1 120kb/s-30Hz-Upscaled 2,75 | | | | | | | | | | | | | | | + | | | | | | | | | | | 44 T2 QP38/38 2,68 | | | | | | | | | | | | | + | | | | | | | | | | 45 T2 QP32 Upscaled 2,67 | | | | | | | | | | | | + | | | | | | | | | 46 T3 38/32 -128- 2,67 | | | | | | | | | | | | | | | | | + | | | | | | | | | 47 T2 AVC QP38 2,65 | | | | | | | | | | | | | | + | | | | | | | 48 T1 120kb/s-15Hz-Upscaled 2,63 | | | | | | | | | | | | | | | + | | | | | | | 49 T2 QP44/38 2,60 | | | | | | | | | | | | | + | | | | | | 50 T3 44/32 -32-16-32- 2,58 | | | | | | | | | | | | | | | + | | | | | | 51 T2 QP32/44 2,57 | | | | | | | | | | | | | | | + | | | | | 52 T3 38/32 -64-64-64- 2,57 | | | | | | | | | | | | | | | | + | | | | 53 T3 44/32 -32-128-32- 2,56 | | | | | | | | | | | | | | | | | + | | | 54 T3 38/32 -32-32-32-32-32-32-32-2,54 | | | | | | | | | | | | | | | | | | + | | 55 T1 AVC Err.Con. 2,18 | | | | | | | | + | | 56 T3 44/32 -64-64-64- 2,07 | | | | | | + | | | 57 T2 QP38/44 1,80 | | + | | | | 58 T2 QP38 Upscaled 1,71 | | + | | | 59 T2 QP44/44 1,59 | | + | | 60 T2 AVC QP44 1,55 | | | + | 61 T3 44/32 -56-8-56-8-56-8-56- 1,55 | | | | | + | 62 T2 QP44 Upscaled 1,37 | +
Figure 3: HRC comparison after mapping the results of T1 and T2 onto T3. Each HRC is marked with a ’+’ symbol. The ’|’ symbols denote the statistical equivalence between the MOS values of two HRCs.
5.
CONCLUSION
In this paper we presented an approach to design subjec-tive tests so that they share a common set of configurations used to align the outcomes of three experiments in a single data set. We used this data set to compare the impact of coding artifacts, transmission errors and error-concealment techniques in the context of Scalable Video Coding. In our future work, we will investigate on statistical tools to help construct the common set, such as determining the mini-mum number of HRCs to be included in order to reach a sufficient reliability after the fitting. The super-set of data obtained from the three experiments contains high variabil-ity in configurations and distortion types, which makes it a valuable resource for data mining and for designing objec-tive quality metrics. This super-set will thus be used to get a better understanding of the factors having an impact on the perceived quality and design quality metrics adapted to the SVC transmission context.
6.
REFERENCES
[1] ITU-T P.910 Rec. Subjective video quality assessment methods for multimedia appl. 1996.
[2] M. N. Garcia and A. Raake. Normalization of
subjective video tests results using a reference test and anchor conditions for efficient model development. QoMEX, 2010.
[3] M. Pinson and S. Wolf. An objective method for combining multiple subjective data sets. SPIE Visual Communications and Image Processing, 2003. [4] Y. Pitrey and M. Barkowsky and P. Le Callet and R.
Pepion. Evaluation of MPEG4-SVC for QoE protection in the context of transmission errors. In Proc. of SPIE Optical Imaging, 2010.
[5] Y. Pitrey and M. Barkowsky and U. Engelke and P. Le Callet and R. Pepion. Subjective quality of SVC-coded videos with different error-patterns concealed using spatial scalability. In Accepted for IEEE EUVIP Conference, July, 2011.