1Brain and Consciousness Group (ENS, EHESS, CNRS), Département d’Études Cognitives, École Normale Supérieure—PSL Research University, Paris, France. 2École Doctorale Cerveau Cognition Comportement, Université Pierre et Marie Curie, Paris, France. 3Monash Institute of Cognitive and Clinical Neuroscience, School of Psychology, Monash University, Melbourne, Victoria, Australia. 4These authors contributed equally: Guillaume Legendre, Thomas Andrillon. *e-mail: [email protected]
Sleep is a vital need, forcing us to spend a large portion of our
life unable to interact with the external world. Current
mod-els interpret such extreme vulnerability as the price to pay
for optimal learning. Sleep would limit external interferences
on memory consolidation
1–3and allow neural systems to reset
through synaptic downscaling
4. Yet, the sleeping brain
contin-ues generating neural responses to external events
5,6,
reveal-ing the preservation of cognitive processes rangreveal-ing from the
recognition of familiar stimuli to the formation of new memory
representations
7–15. Why would sleepers continue
process-ing external events and yet remain unresponsive? Here we
hypothesized that sleepers enter a ‘standby mode’ in which
they continue tracking relevant signals, finely balancing the
need to stay inward for memory consolidation with the ability
to rapidly awake when necessary. Using
electroencephalogra-phy to reconstruct competing streams in a multitalker
envi-ronment
16, we demonstrate that the sleeping brain amplifies
meaningful speech compared to irrelevant signals. However,
the amplification of relevant stimuli was transient and
van-ished during deep sleep. The effect of sleep depth could be
traced back to specific oscillations, with K-complexes
promot-ing relevant information in light sleep, whereas slow waves
actively suppress relevant signals in deep sleep. Thus, the
selection of relevant stimuli continues to operate during sleep
but is strongly modulated by specific brain rhythms.
Sleepers are not completely isolated from their environment.
Indeed, previous studies have shown that awakening can be
facili-tated not only by low-level factors (for example, high-amplitude
sounds)
7but also by semantic relevance (for example,
some-one hearing their own name or the cries of their own baby)
17.
However, thus far, there has been no direct evidence that the
sleeping brain can covertly select which piece of information to
prioritize when exposed to multiple sources of information. In
this study, we investigate sleepers’ ability to filter information and
whether they can allocate their attention towards the most
rel-evant source of information.
A main limitation in addressing this issue concerns the absence
of verbal reports. Indeed, sleepers are unable to follow task
instruc-tions and to report which information they are tracking among
multiples sources. To circumvent this issue, we constructed a
pas-sive version of the cocktail party paradigm
18in which sleepers were
presented with a multi-talker situation in which one speech stream
was more informative than the other stream. By combining this
paradigm with electroencephalographic (EEG) recording during
mid-day naps (that is, non-rapid eye movement (NREM) sleep), we
studied whether, for two competing speech streams, the sleeping
brain would favour one source of information over another on the
basis of semantic relevance (Fig.
1
). Thus, we presented participants
(n = 24) with short ~1-min stories that are semantically relevant
(tales, news, Wikipedia and movie excerpts). In the other ear,
partic-ipants received speech that is devoid of meaning despite possessing
normal syntactic and phonological properties, as in Lewis Carroll’s
Jabberwocky poem (for example, ‘The blicker flomps the dax to the
elterior… ’). We capitalized on a neural decoding approach called
stimulus reconstruction, which uses electrophysiological responses
to approximate the envelope of speech streams
19. The score of the
reconstructed envelope reflects the amount of neural signal evoked
by the auditory input and is influenced by participant’s attentional
focus
16,20. Importantly, reconstruction scores can be extracted for the
two competing speech streams separately and continuously. Thus,
we could establish how sleep depth affects sensory processing and
the selective amplification of relevant inputs. Finally, we examined
the effect of concomitant sleep hallmarks (slow waves, K-complexes
and sleep spindles) on auditory processing.
We first trained a model mapping the EEG signal during
wake-fulness with the envelope of acoustic streams presented in isolation
(Fig.
1
, diotic training). We observed highly significant
reconstruc-tion scores (correlareconstruc-tion between the original and the reconstructed
envelope, see Methods) both for relevant (Supplementary Fig. 1;
r
real= 0.08 ± 0.03; Wilcoxon signed-rank test against 0: z = 4.29,
n
= 24, P < 0.001, r = 0.87, 95% CI = 5.82 × 10
−2to 9.21
× 10
−2) and
Jabberwocky stories (rjabberwocky = 0.08 ± 0.04; Wilcoxon signed-rank
test against 0: z = 4.29, n = 24, P < 0.001; r = 0.87, 95% CI = 5.07 × 10
−2to 9.93 × 10
−2). Importantly, when presented alone, the
reconstruc-tion of both types of streams did not differ, suggesting that the
model was not biased towards reconstructing relevant stories when
selective mechanisms are not at play (paired Wilcoxon signed-rank
test: z = − 1.029, n = 24, P = 0.304, r = − 0.210, 95% CI = − 1.44 × 10
−2to 3.91
× 10
−3, Bayes factor of 3.14 indicating positive evidence for
the null hypothesis; see Methods). When played concomitantly
(Fig.
1
, dichotic test), the two streams could still be reconstructed
(both P < 0.001); however, the relevant stories led to higher
recon-struction scores than did Jabberwocky (paired Wilcoxon
signed-rank test: z = 4.11, n = 24, P < 0.001, r = 0.84, 95% CI = 2.09 × 10
−2to
3.90 × 10
−2). Comparing the correlation coefficients for both stories
allowed us to compute a decoding performance score on a
single-story basis. For each trial, if the reconstruction score was higher
for the relevant stream, the trial was coded as successfully decoded
(1), otherwise it was coded as unsuccessful (0; see Methods). Thus,
the decoding performance was defined as the proportion of trials
for which the relevant stream was better reconstructed than the
Jabberwocky stream. In wakefulness, the decoding performance
Sleepers track informative speech in a multitalker
environment
was 60.6% (Fig.
2a
; Wilcoxon signed-rank test against the chance
level of 50%: z
= 3.89, n = 24, P < 0.001, r = 0.79, 95% CI = 57–64.2).
We then examined decoding performance in NREM sleep, first
by combining light (that is, N2) and deep (that is, N3) sleep stages.
Crucially, we obtained a significant, albeit smaller, overall decoding
performance (52.4%; Wilcoxon signed-rank test against the chance
level = 50%: z = 2.19, n = 24, P = 0.028, r = 0.45, 95% CI = 50–53.4),
indicating that sleepers continue to track relevant stories during
sleep. We then quantified the extent to which sensory encoding is
modulated by sleep depth (that is light (stage 2) versus deep (stage 3)
NREM sleep; Fig.
2b
). Mixed-effect models trained on
reconstruc-tion scores obtained in light and deep sleep (see Methods) revealed
an interaction between sleep depth and story type (likelihood-ratio
test: χ ²(1) = 5.28, P = 0.021). Interestingly, this interaction reflected
the fact that the effect of neural amplification of relevant
com-pared to Jabberwocky stories was present in light sleep (post-hoc
Wilcoxon signed-rank test: z
= 1.97, n = 24, P = 0.049, r = 0.40, 95%
CI = − 3.48 × 10
−4to 1.14
× 10
−2) but faded away during deep sleep
(post-hoc Wilcoxon signed-rank test: z
= − 0.67, n = 16, P = 0.501,
r
= − 0.17, 95% CI = − 1.19 × 10
−2to 9.33
× 10
−3). As participants
spend on average more time in light sleep than in deep sleep, we
set out to examine whether this interaction could be due to a
differ-ence in the number of trials. Equalizing the number of trials using a
bootstrap procedure confirmed the presence of a significant
inter-action between sleep stage and story type (see Methods). We further
examined how sleep depth affected each story type separately using
their respective reconstruction scores. Interestingly, the decline in
sensory encoding was specific to the relevant stories and did not
affect Jabberwocky stories (Fig.
2b
). Indeed, our analysis revealed a
significant effect of sleep depth on relevant stories (likelihood-ratio
test:
χ ²(1) = 246.77, P < 0.001), but not on Jabberwocky stories
(likelihood-ratio test: χ ²(1) = 0.77, P = 0.380). In addition,
recon-struction scores were significantly positive in both light-sleep and
deep-sleep stages for Jabberwocky (all P < 0.05 after a Bonferroni
correction for multiple comparisons), whereas the reconstruction
for the relevant speech decreased with sleep depth and was no
longer significant in deep sleep (P > 0.05 even before correction).
Thus, it seems that sleep is characterized by a gradual and selective
decrease for the encoding of relevant information, rather than an
overall decrease in sensory encoding.
Next, we investigated whether sleepers could maintain selective
tracking over sustained periods of time (that is, over a whole story
of about 1 min). To address this issue, we examined the decoding
performance during the first half (0–30 s) and second half (30–60 s)
of the concurrent stories (Fig.
2c
). This analysis revealed an
inter-action between the sleep–wake state and the time period
(likeli-hood-ratio test: χ ²(1) = 3.99, P = 0.046). As expected, the decoding
performance in wakefulness was stable during the whole story
(first half versus second half, paired Wilcoxon signed-rank test:
z
= − 0.122, n = 24, P = 0.903, r = − 0.03, 95% CI = − 2.706 × 10
−2to
2.500 × 10
−2). By contrast, during sleep, the decoding performance
score was significant during the first-half period but not during the
second-half period, leading to a significant difference between these
two periods (paired Wilcoxon signed-rank test: z = 2.92, n = 24,
P
= 0.004, r = 0.60, 95% CI = 0–1.280 × 10
−1). Thus, although the
amplification of relevant speech is maintained during sleep, it seems
to be transient.
We then set out to examine how this pattern is affected by
sleep depth (Fig.
2d
). For light sleep, we observed an interaction
between the story type and the temporal period (likelihood-ratio
EEG recordings
EEG recordings Real speech Jabberwocky
Wake phase
Training
Test
Sound envelope
Filtered EEG signal
Filtered EEG signal Weight matrix
Reconstructed envelope Comparison of the correlaton coefficients R = 0.04 R = 0.01 Sleep phase x x
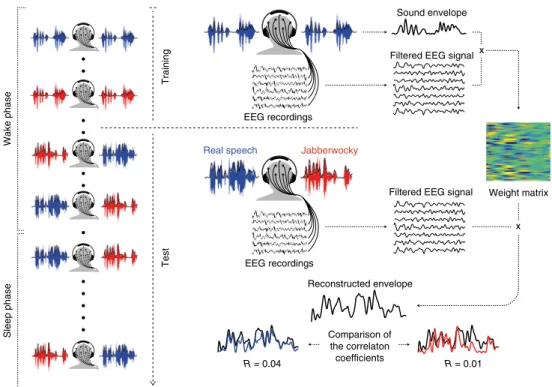
Fig. 1 | experimental procedure. On the left, each recording session was composed of a training and test phase. During the training and beginning of the
test phase, participants were instructed to stay awake; they were authorized to fall asleep during the latter part of the test phase. On the right, during the training phase, participants listened to either relevant (real speech; blue) or Jabberwocky (red) stories presented diotically (that is, the same information in both ears). The envelope of the sound and the filtered EEG signal were extracted to train a linear filter mapping the EEG signal to the sound envelope (see Methods). During the test phase, two different stories (relevant versus Jabberwocky) were played simultaneously in dichotic streams (that is, different auditory information in the two ears). Dichotic streams were presented both during wakefulness and sleep. The linear filter obtained from the training phase was applied to the filtered EEG envelope and a reconstructed envelope was obtained for each trial (black curve). This envelope can be seen as a mixture of both auditory inputs, which was compared to the original envelope of each of the two inputs separately (blue and red curves) using Pearson’s correlation method (reconstruction scores = Pearson’s coefficient).
test: χ ²(1) = 4.28, P = 0.039), reflecting a better reconstruction for
the relevant story during the first-half period (post-hoc Wilcoxon
signed-rank test across 24 participants: z = 3.17, P = 0.002, r = 0.65,
95% CI
= 4.349 × 10
−3to 2.587
× 10
−2) but not during the
second-half period (post-hoc Wilcoxon signed-rank test: z
= 0.429, P = 0.67,
r
= 0.09, 95% CI = − 8.500 × 10
−3to 1.299
× 10
−2). Interestingly, we
also observed an interaction in deep sleep (likelihood-ratio test:
χ ²(1) = 8.34, P = 0.004). Although restricted comparisons only
revealed trends, this significant interaction seems to emerge from
a better reconstruction of the relevant story during the first-half
period (post-hoc Wilcoxon signed-rank test across 16 participants:
z
= 1.55, P = 0.121, r = 0.39, 95% CI = 3.032 × 10
−3to 2.880
× 10
−2),
contrasting with a worse reconstruction during the second-half
period (post-hoc Wilcoxon signed-rank test: z = − 1.55, P = 0.121,
r
= − 0.39, 95% CI = − 3.399 × 10
−2to − 3.181 × 10
−3). This
rever-sal suggests the involvement of suppressive mechanisms in deep
sleep (see below for further evidence). Interestingly, although the
relevant stream tended to be better reconstructed at the beginning
30 40 50 60 70 80 90 Decoding performance (%) a *** * b *** ** *** *** *** * NS * NS Reconstruction score Wake Light sleep Deep sleep –0.05 0 0.05 0.10 0.15
First half (0–30 s) Second half (30–60 s)
Trial timecourse 30 40 50 60 70 80 90 c *** ** *** NS Wakefulness NREM Sleep d *** First half ** First half NS First half *** Second half NS Second
half Secondhalf
NS
* **
Relevant stories
Jabberwocky stories
Wake Light sleep Deep sleep
–0.10 –0.05 0 0.05 0.10 0.15
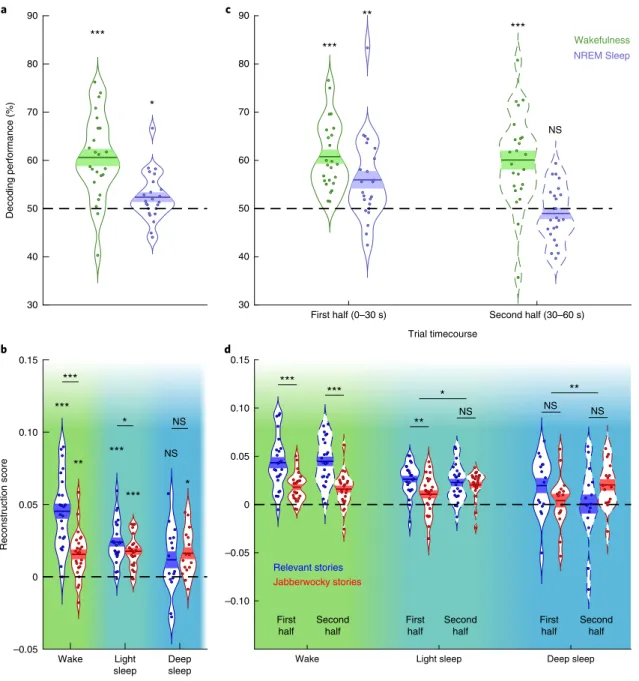
Fig. 2 | reconstruction score and decoding performance across wake and NreM sleep. a, Decoding results for the selective tracking of the relevant
stream during wakefulness and NREM sleep across participants. The curved lines indicate the distribution of data, the dark bars represent the mean of the distribution, and the lighter area surrounding the mean denote the s.e.m. across participants. Individual data points are displayed as coloured circles (n = 24 for both wakefulness and NREM sleep). The asterisks show the significance level of the signed-rank test comparing performance against the 50% chance level (dashed line). Note that the tracking of the relevant stream could be successfully evidenced in both wake and sleep. b, Reconstruction
scores for the relevant and Jabberwocky stories in wakefulness, light sleep and deep sleep (n = 24, 24 and 16 for wakefulness, light sleep and deep sleep, respectively). The horizontal bars displayed above the distributions denote the significance level of the paired signed-rank test between relevant and Jabberwocky reconstruction scores. The asterisks above the distributions indicate comparisons with 0 (dashed line; signed-rank test). c,d, As in panels a
and b, respectively, but for the first half (0–30 s) and the second half (30–60 s) of the stories separately. Note that the use of nonparametric signed-rank
of streams, overall reconstruction scores remained constant
dur-ing entire streams (rrelevant and rJabberwocky together; light sleep, first
half versus second half, Wilcoxon signed-rank test across 24
par-ticipants: z = − 0.743, P = 0.458, r = − 0.15, 95% CI = − 1.216 × 10
−2to 5.122
× 10
−3; deep sleep, first half versus second half, Wilcoxon
signed-rank test across 16 participants: z
= 0.414, P = 0.679, r = 0.10,
95% CI = − 6.567 × 10
−3to 9.681
× 10
−3).
In the previous analyses, speech envelopes were reconstructed
integrating EEG data over rather long epochs (0–500 ms, here called
time-lags). To explore how stimulus processing unfolds in time, we
focused on individual time lags (see Methods). This allowed us to look
at the time windows during which speech envelopes are best
recon-structed and modulated by stimulus relevance. When examining
wake data, we observed, as elsewhere
19, three peaks around 110, 230
and 330 ms, with scalp topographies suggesting a preponderant role
of the auditory cortex in the reconstruction of the stimulus envelope
(Fig.
3a
; Monte-Carlo test on clusters: ∑ t(23) = 20.01, Pcluster = 0.011,
d
= 0.360; ∑ t(23) = 45.58, Pcluster
= 0.003, d = 0.424; and ∑ t(23) = 37.18,
P
cluster = 0.004, d = 0.474, respectively). In light sleep, the temporalprofile of stimulus reconstruction was strikingly similar to
wakeful-ness, suggesting a preservation of the same processing steps (Fig.
3b
).
Furthermore, there was a main effect of stimulus category on
recon-structions scores (relevant
> Jabberwocky stories) for the second and
third peaks (Monte-Carlo test on clusters: ∑ t(23) = 14.26, Pcluster = 0.017,
d
= 0.190 and ∑ t(23) = 18.94, Pcluster = 0.010, d = 0.251, respectively). In
deep sleep, the same three peaks were preserved (Fig.
3c
). However, the
reconstruction profiles for the relevant and Jabberwocky stories largely
overlapped, illustrating the loss of selective amplification for the
rele-vant stories. The conservation of the three peaks across vigilance states
suggests that the sensory processing steps triggered by external inputs
are largely conserved from wakefulness to sleep, whereas the selective
amplification of relevant signals is functional in light sleep but vanishes
during the deeper parts of NREM sleep.
The effect of sleep depth on the encoding and selection of relevant
stories could be traced back to sleep rhythms such as sleep spindles
and slow oscillations. Slow oscillations in light sleep were
approxi-mated to K-complexes as they generally occur in isolation and have
an asymmetric profile, and those in deep sleep were considered as
standard sleep slow waves as they generally appear in trains and are
more symmetrical (Supplementary Fig. 2). Sleep rhythms
consti-tute hallmarks of sleep physiology, but their respective roles remain
unsettled. For instance, K-complexes have been argued to both
pre-serve sleep by suppressing sensory information
21and, conversely,
constitute windows of wakefulness
22,23. This lack of consensus might
reflect the focus on brain responses to single events. For example,
iso-lated words will tend to trigger K-complexes but are usually too short
to allow examining the influence of K-complexes on the incoming
signals that follow. By contrast, the continuous nature of the stimulus
reconstruction approach allowed us to study the dynamic influence
of sleep rhythms on both sensory encoding and stimulus selection.
Indeed, we found that, depending on which timescale is
con-sidered, K-complexes can either promote or suppress sensory
responses (Fig.
4a
). Just before the K-complexes, both stories were
reconstructed at a similar level, revealing sensory encoding without
a prioritization of one stream over the other (Fig.
4a
). However,
dur-ing the window centered on K-complexes, stimulus reconstruction
vanished for both stories, potentially due to a period of neuronal
silencing at the cortical level
24. Crucially, just after the K-complexes,
not only were both stories reconstructed but the relevant stories also
had even higher reconstruction scores (difference, Monte-Carlo
test on clusters: 4.6–9.9 s, ∑ t(22) = 124.38, Pcluster = 0.026, d = 0.214).
Thus, although K-complexes disrupted sensory encoding during
their occurrence, they then favoured the amplification of the
rel-evant stream after completion.
The temporal profile for slow waves in deep sleep was markedly
different (Fig.
4c
). Stimulus reconstruction of the relevant stories
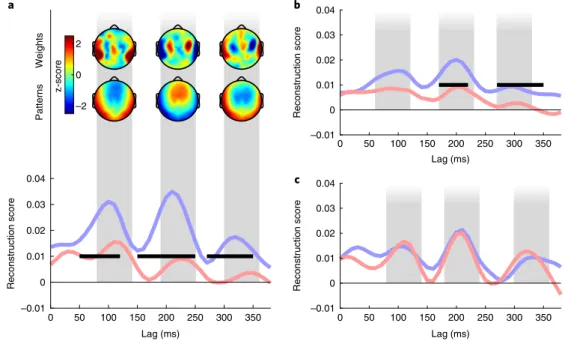
a –2 0 2 z-score Patterns Weights 0 50 100 150 200 250 300 350 Lag (ms) –0.01 0 0.01 0.02 0.03 0.04 Reconstruction score b 0 50 100 150 200 250 300 350 Lag (ms) –0.01 0 0.01 0.02 0.03 0.04 Reconstruction score c 0 50 100 150 200 250 300 350 Lag (ms) –0.01 0 0.01 0.02 0.03 0.04 Reconstruction scoreFig. 3 | Spatiotemporal integration of acoustic information. a, Individual models were computed for each time lag (see Methods) (bottom). Correlation
coefficients for the relevant (blue) and Jabberwocky (red) stories presented during wakefulness (n = 24) were extracted for each of these time lags and averaged across participants. The horizontal black bars show significant clusters for the comparison between the blue and the red curves (Pcluster < 0.05). Three main peaks can be observed at 110, 230 and 330 ms, respectively. Scalp topographies of filter weights and patterns corresponding to the three different peaks (see Methods) are also shown (top). Values were z-scored across electrodes to emphasize regional differences. b,c, The same temporal
profile as in panel a for stories in light (b; n = 24) and deep (c; n = 14) sleep when focusing on the first-half period (see Fig. 2). Note the similarity of the profile between wakefulness and light sleep. The vertical gray bars represent the identified peaks of reconstruction as described in the Methods (± 30 ms for the sake of visualization). These peaks were used to compute the scalp topographies.
was significant before the slow wave (− 9.5 to − 2.6 s, Monte-Carlo
test on clusters: ∑ t(14) = 174.69, Pcluster = 0.032, d = 0.295) but not
during its occurrence. Further analysis revealed that the level of
reconstruction for the relevant stream was significantly lower
dur-ing slow waves than durdur-ing the average reconstruction obtained in
deep sleep (− 2.5 to 4.1 s, Monte-Carlo test on clusters: ∑ t(14) =
− 118.67, Pcluster = 0.041, d = − 0.497; Supplementary Fig. 3). Inversely,
the Jabberwocky was significantly reconstructed only during slow
waves (− 6.8 to 8.9 s, Monte-Carlo test on clusters: ∑ t(14) = 465.16,
P
cluster = 0.004, d = 0.561), and there was no significant modulation ofthe reconstruction score around slow waves compared to the
aver-age score obtained in deep sleep (Supplementary Fig. 3). Overall,
these findings suggest an active and selective suppression of relevant
stimuli in deep NREM sleep mediated by slow waves. However, it
is important to stress that, as slow waves typically occur in trains,
it is difficult to tie the modulation of reconstruction scores to the
down state of the slow waves used to align the reconstruction scores.
It remains possible that other slow waves preceding and
follow-ing the slow waves used here as a reference also participated in the
pattern of results observed in Fig.
4c
.
Sleep spindles had a rather moderate effect on stimulus
recon-struction. Indeed, both type of stories were reconstructed
dur-ing the entire − 10 to 10-s window (Monte-Carlo test on clusters:
∑ t(22) = 1,027.28, Pcluster < 0.001, d = 0.958 and ∑ t(22) = 815.62,
P
cluster < 0.001, d = 0.675 for relevant and Jabberwocky streams,respectively). However, whereas relevant stories were better
recon-structed than Jabberwocky stories before the spindles (Fig.
4b
;
differ-ence, Monte-Carlo test on clusters: − 10 to − 4.3 s, ∑ t(22) = 128.32,
P
cluster = 0.018, d = 0.305), this difference disappeared during andfol-lowing spindles. Sleep spindles were traditionally thought to enable
sensory disconnection
25, yet they were reported to have a limited
effect on sensory encoding
26. Our results further temper the view
that spindles reflect sensory-gating mechanisms. They could rather
disrupt higher-order mechanisms, such as those involved in the
selective amplification of relevant information.
By investigating brain responses to multi-talker speech, we show
that both semantically relevant and meaningless Jabberwocky
sto-ries are encoded regardless of vigilance state, confirming that the
loss of consciousness associated with sleep does not imply a full
shut down of information processing
27–29. Strikingly, the processing
advantage for the relevant compared to Jabberwocky stories
gen-eralized from wakefulness to light sleep, providing evidence that
the ability to selectively track relevant events remains functional
during sleep. Yet, our study also reveals that this capacity differs in
two respects compared to wakefulness. First, selective tracking was
transient, contrasting with the sustained amplification observed in
wakefulness (Fig.
2b
and Supplementary Fig. 6). The sleeping brain
might be unable to track relevant messages over long time periods
due to the large decrease of corticocortical connectivity in NREM
sleep
30. It is also possible that it becomes habituated over time to
the semantic properties of the relevant message
31that fostered its
saliency in the first place. Second, the amplification of relevant
speech was observed primarily during light NREM sleep. Indeed,
although sensory encoding remained constant, selective tracking
of the relevant stories was completely wiped out in deeper-sleep
stages. Importantly, whereas the reconstruction of the relevant
sto-ries decreased with sleep depth, it remained stable for Jabberwocky
stories. This result reveals that the initiation of sleep and its
pro-gression towards deeper stages seem to affect the amplification of
relevant signals rather than sensory encoding per se.
Thanks to the dynamic properties of the stimulus reconstruction
approach, we could trace back the global changes in stimulus
encod-ing and selection to specific markers of sleep physiology. Although
sleep is usually scored on large windows
32, an abundant literature
suggests that its microstructure is key to understanding how it alters
the processing of external inputs
22,25,33. In light sleep, participants’
ability to focus on the relevant signal was mediated by K-complexes.
Indeed, right after a K-complex, both sensory encoding and
ampli-fication of the relevant signal were restored. Thus, K-complexes
could allow sleepers to sample the environment following a
pertur-bation. Interestingly, the relevance of a stimulation is linked to its
propensity to trigger a K-complex
22. The regain of amplification for
relevant signals following K-complexes is consistent with the recent
hypothesis that their global distribution at the scalp level reflects
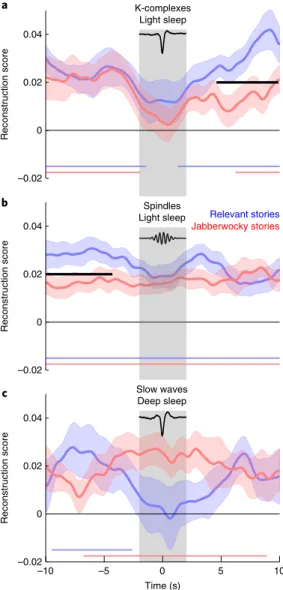
Spindles Light sleep b Relevant stories Jabberwocky stories –0.02 0 0.02 0.04 Reconstruction score K-complexes Light sleep a –0.02 0 0.02 0.04 Reconstruction score Slow waves Deep sleep c –0.02 0 0.02 0.04 Reconstruction score –10 –5 0 5 10 Time (s)
Fig. 4 | effect of sleep spindles, K-complexes and slow waves on stimulus reconstruction. a–c, In each panel, the reconstruction scores were time
locked to a given graphoelement (K-complexes in light sleep (a): n = 23; sleep spindles in light sleep (b): n = 23; and slow waves in deep sleep (c): n = 15) and averaged across participants. The down states of K-complexes and slow waves and the middle of spindles were used as time = 0. The shaded areas denote the s.e.m. computed across participants. The curves were smoothed with a 500-ms-wide Gaussian kernel for visual purposes only; statistics were computed prior to smoothing. The coloured horizontal bars show the significant clusters when comparing reconstruction scores with 0 (Pcluster < 0.05). The black horizontal bars show significant clusters when comparing the two reconstruction scores (relevant versus Jabberwocky stories, Pcluster < 0.05). The gray bars indicate the temporal window size for computing the Pearson correlation (reconstruction score) between reconstructed and original signals. The average traces of K-complexes and slow waves are displayed on the top of the corresponding panel. An archetypal spindle is also shown. Note the differential effect of light-sleep K-complexes and deep-sleep slow waves on stimulus reconstruction.
the recruitment of the arousing system
34. Furthermore, the recovery
of wake-like processes following K-complexes could be mediated
by a transitory surge in noradrenaline, a neuromodulator involved
in attentional processes
35,36. Thus, in light sleep, K-complexes might
restore the capacity of the brain to integrate salient information for
a short period of time.
The effect of slow waves in deep sleep was markedly different.
Indeed, we found that slow waves had an inhibitory, rather than an
amplificatory, effect on relevant signals. This could be interpreted as
an active and selective suppression of relevant stimuli in deep NREM
sleep mediated by slow waves. In deep sleep, slow oscillations occur
in trains and have been shown to disrupt cortical processes
37and the
integration of information
38. Here, using a multi-talker situation, we
show that relevant signals are actively and specifically suppressed
com-pared to matched but irrelevant signals. But how and why would a
rel-evant story be selectively suppressed? Competing stimuli are encoded
by separate neural coalitions
39and slow waves are triggered by local
activations within the cortex
40, such that slow waves may affect one
stream (that is, one coalition) but not the concurrent stream. As the
coalition encoding relevant signals is more active than its irrelevant
counterpart, even during sleep, it might increase the probability of
triggering slow waves, leading to its own inhibition. Such suppression
of salient signals during NREM sleep could be linked to the memory
function of sleep: by counteracting the influence of salient external
signals, slow waves may favour an efficient and reliable
strengthen-ing of pre-existstrengthen-ing memories
2. Thus, depending on the sleep depth,
a given signal could either be processed according to its relevance or
it could be suppressed, shifting the division of labour from gathering
external information (that is, sensory inputs) to reshaping internal
representations (that is, pre-existing memories).
What are the mechanisms associated with the selection of
rel-evant messages in this multi-talker situation? Because executive
functions, which are necessary for endogenous forms of attention,
are largely impaired in sleep
41, here, we constructed a passive
ver-sion of the cocktail party paradigm involving an exogenous form
of attentional amplification driven by the relevance of
concur-rent messages (that is, a relevant message attracts listener’s
atten-tion compared to irrelevant messages). Moreover, to increase the
involvement of attentional processes in this protocol, we
explic-itly instructed participants to focus on relevant speech and ignore
Jabberwocky before falling asleep, so as to induce the maintenance
of this task set during sleep
28. Thus, it is arguable that the effect of
selective amplification that we found in sleep is sustained by
atten-tion towards the relevant stream. However, one might argue that our
finding is driven by the fact that relevant speech is more
informa-tive (for example, more familiar and meaningful) than Jabberwocky,
regardless of attention. Against this interpretation, we found that
the relevant stream, when presented and attended in isolation, is
not better reconstructed than Jabberwocky (Supplementary Fig. 1),
dampening a pure locus in terms of stimulus category. Furthermore,
to verify that our paradigm is genuinely sensitive to attentional
fac-tors, we performed a separate control experiment during
wakeful-ness in which we orthogonalized attention and stimulus category
(see Supplementary Information).
Participants were now asked to orient either towards relevant
or Jabberwocky stories on a trial-by-trial basis. Our results
con-firm that attention can flexibly amplify either of the two categories
(Supplementary Fig. 4). In particular, whereas attended relevant
speech led to better reconstruction scores than ignored Jabberwocky
(reconstruction scores for real speech and Jabberwocky: 0.062
ver-sus 0.023, paired Wilcoxon signed-rank test across 22 participants:
z
= 3.75, P < 0.001, r = 0.80, 95% CI = 0.023–0.050), the effect was
reversed when Jabberwocky was attended over relevant speech
(0.052 versus 0.029, paired Wilcoxon signed-rank test: z = 3.72,
P
< 0.001, r = 0.79, 95% CI = 0.011–0.028). Nonetheless, we also
observed an effect of stimulus category above and beyond attention
allocation (that is, the effect was reversed but not to the same
extent). Although the effect of attention was an order of
magni-tude larger than the effect of stimulus category, it remains
unset-tled whether the increased reconstruction of relevant speech stems
from attentional processes, stimulus properties or a combination
of both (for example, informative stimuli automatically grab
atten-tional resources). Finally, examining the auditory-evoked potentials
(rather than reconstruction scores) shows that neural responses to
sounds were amplified when a given stream was attended
irrespec-tive of stimulus category (Supplementary Fig. 5). Together with the
fact that the relevant stream in our main experiment was selectively
modulated until reversal from wake to deep sleep, whereas the
sen-sory encoding of the Jabberwocky stream remained unaffected, our
results buttress the interpretation that an attentional form of
ampli-fication drives the increase in reconstruction scores for relevant
messages. Further studies are necessary to disentangle the exact
mechanisms that allow the sleeper to selectively amplify relevant
signals over irrelevant ones.
In an ever-changing environment, the ability to process relevant
signals during light sleep offers substantial benefits. Especially
when considering that light sleep represents about half of the total
sleep time in humans
42. In particular, it would allow signalling the
presence of events, necessitating a rapid reversal towards
wakeful-ness. Such mechanisms may rely on local neural processors, which
could explain why they operate without awareness. Our data were
obtained in NREM sleep during daytime naps and it remains to be
seen whether relevant signals continue to be amplified during night
sleep. Indeed, although sleep stages are uniformly scored across
day-time and night-day-time sleep, sleep is typically shallower during naps
43.
Likewise, it would be interesting to investigate whether our finding
extends to REM sleep or disappears as in deep NREM sleep. Indeed,
brain activity in REM sleep shares more similarities with
wakeful-ness than with NREM sleep, but dreams, which occur in 80% of
REM sleep
44, reflect the focus on internal representations,
poten-tially limiting the processing of external inputs
27. Finally, a crucial
question for future research concerns the extent to which neuronal
plasticity actually benefits from the progressive disconnection from
the outside world. Addressing such an issue might provide new
insights to the fundamental question of why organisms need to be
unresponsive to their environment to better learn from it.
Methods
Audio material. Eighty texts (n = 80) in French were selected from Wikipedia articles (www.wikipedia.org), news reports, tales or monologue transcripts from movies. They were first adapted to a length of about 180 words. Then, the syntax and vocabulary were simplified to produce easily tractable texts. Using the Lexique database45, a pseudo-lexicon was created matching any content words in the French texts with a given pseudo-word. These pseudo-words were selected to ensure their similarity with the words of the French lexicon. French texts were then transformed in syntactically correct but meaningless texts (Jabberwocky) by keeping function words but replacing each content word with its pseudo-word counterpart. Pairs of texts were matched in total duration, syntax, word frequency and prosody and only differed in being either meaningful or meaningless. They were then converted into speech using IRCAMTTS, a text-to-speech MATLAB-based software46. Pauses of 150 ms were imposed between sentences to maintain a constant auditory flow. Audio files were digitalized at a sampling rate of 44.1 kHz. Then, the acoustical properties of the voice uttering the texts were manipulated using the IRCAMTRAX module of the Logic Pro software (Apple). Two easily distinguishable voices were produced from the original neutral speaker by modulating the pitch and the size vocal tract. These transformations were performed after the text-to-speech procedure. Thus, the same 80 pairs of real-speech and Jabberwocky texts could be pronounced either by a high-pitch or low-pitch voice without altering other parameters, such as the prosody or total duration. Dichotic stimulations were created by pairing each real-speech story with a distinct Jabberwocky story (that is, obtained from a different real story). Pairs of real-speech and Jabberwocky stories were matched in terms of silence-to-signal ratio by increasing silences (the portions of signal with amplitude between 0.001 and − 0.001 of the maximum amplitude and longer than 50 ms) with the adequate time constant. The length of each story was also matched by slightly changing the sound tempo with a MATLAB (Mathworks Inc.) implementation of the VSOLA (variable parameter synchronized overlap add) algorithm47. The volume of acoustic
stimuli was set between 45 and 50 dB following participants’ preferences and in line with our previous studies15,27,28. This range was chosen to allow participants to hear the stimuli effortlessly without preventing sleep. Stimulations were played via an Echo Fire 12 (Echo Digital Audio) soundcard. Finally, acoustic energy was normalized across all texts by setting the root-mean-square value of the acoustic signal to a standard value. Thus, each pair of real-speech and Jabberwocky stories had identical durations and equivalent acoustic energy. A trial refers to the full presentation of a single story (diotic trials in the training phase) or a pair of stories (dichotic trials in the test phases) for about 1 min (73.57 ± 5.16 s, mean ± standard deviation (s.d.) across stories, minimum: 54.04 s, maximum 83.51 s). During the dichotic trials, the real-speech story was assigned a side (left or right) and voice (high pitch or low pitch), and its paired Jabberwocky story was assigned the opposite side and voice. These parameters were randomly selected for each trial. Participants. A total of 29 (n = 29) French native speakers (13 females, age: 18–33 years) with self-declared normal hearing and no history of sleep disorders participated in this study. Five participants were discarded from our analyses because they did not sleep enough (< 1 min of consolidated NREM sleep, that is, NREM2 or NREM3) or not at all (n = 3), or due to technical issues (n = 2). Participants were selected through questionnaires assessing their sleep habits and daytime sleepiness (Epworth scale: 10.97 ± 0.14 on a scale of 24). In addition, they were required to sleep 30% less than usual the night before the experiment and were deprived from stimulants (for example, coffee) on the day of the recordings to increase the probability that they would fall asleep while hearing the acoustic stimuli. Participants were equipped with an actigraph the day before the recording session to check their compliance with sleep restriction. Recording sessions always occurred in the early or late afternoon to increase sleepiness and favour NREM sleep. The present protocol had been approved by the local ethical committee (Conseil d’Evaluation Ethique pour les Recherches en Santé, University Paris Descartes, Paris, France). Participant sample size was chosen based on previous studies using the stimulus reconstruction approach16,19 or investigating cognitive processing during sleep11,12,15,28.
Protocol. Participants were equipped with 64-channel EEG gel-nets (EGI system, Electrical Geodesic Inc.) and seated on a reclining chair in a dark, soundproof and magnetically shielded booth. Participants started with a training phase during which they were exposed to six real-speech and six Jabberwocky stories played in a diotic manner (that is, the same story was presented to both ears at the same time). The training phase was self-paced. Following the training phase, the first part of the test phase (‘wake test’) was initiated and the participants were presented with eight dichotic trials: a real-speech story was presented to one ear and a Jabberwocky story to the other ear. Participants were asked to stay awake with their eyes closed during the training phase and wake-test phases and reminded to do so whenever markers of drowsiness appeared in the EEG. Trials followed each other separated by a 4–6-s jitter (random uniform distribution). Then, during the sleep-test phase, participants were put in a reclined position and allowed to fall asleep. Novel pairs of real-speech and jabberwocky stories were used in sleep. Auditory stimulations went on, trial after trial, for about 40 min (30 trials) with the same 4–6-s jitter between trials. During the training phase, participants were asked to attentively listen to the diotic training trials. During the wake-test phase (dichotic trials), subjects were instructed to focus on the relevant (real-speech) story and to ignore the Jabberwocky story. In the sleep-test phase, participants were asked to maintain their attention towards the relevant story as long as they remained awake and to resume the task in case of an awakening. Participants were explicitly allowed to fall asleep in the sleep-test phase. Data collection and analyses (stimulus reconstruction) were blind to the conditions of the experiment.
To check that a precise synchronization between auditory stimulations and EEG recordings was preserved throughout the recordings, a third audio channel was associated to the real and Jabberwocky auditory streams. In this additional channel, a square electrical signal was played every second and sent to the EEG amplifier (participants were not aware of this procedure). We later checked that this 1-s pace had been conserved (maximal observed lag: 2 ms, that is, 1 sample at 500 Hz). To avoid any electromagnetic contamination from earplugs onto EEG recordings, a non-electrical auditory system was used (RLINK Ear Tone 3 A, 10 Ohms; Interacoustic Inc.). EEG signals were referenced online to Cz and sampled at 500 Hz. Chin electromyograms (EMG) and electrooculograms (EOG) were extracted from sensors placed around the eyes and on the chin.
Behavioural data analyses. At the end of the recording session, participants answered a multiple-choice questionnaire on the real-speech stories heard during the experiment as well as stories that were not played (one question for each story, 4 options per question, 25% chance level, n = 80 questions). Participants were asked to guess the answer whenever they did not remember hearing the story. Besides, some questions referred to stories that were not played in a given recording session. Following each question, participants had to indicate whether they remembered hearing the story during the experiment and whether they actually knew the answer to the question beforehand. The mean performance scores on the questionnaire were computed for each participant. When participants declared that they knew the correct answer beforehand, we discarded the corresponding
question from further analysis (9.18 ± 1.54%, mean ± standard error of the mean (s.e.m.) across 29 participants). In addition, if more than 50% of the participants (theoretical chance level: 25%) could guess the answer of a given question without even having heard the story, the question was discarded. All participants (including participants that did not sleep, n = 29) were included here. Finally, for each participant included in the EEG analyses, we computed participants’ correctness in the different wake/sleep stages. As participants might change their vigilance state during the course of a given story, we attributed to this story the lightest (that is, the most conservative) stage observed during its presentation. We computed the average correctness for the difference in vigilance states accordingly (wakefulness:
n = 24 participants, light sleep: n = 23, deep sleep: n = 10, all sleep: n = 23; Supplementary Table 1). Comparing the correctness scores to the theoretical chance level across participants revealed that participants did not remember the stories played during sleep (correctness in NREM sleep: 24.44 ± 3.12%; Wilcoxon signed-rank test to 25% across 23 participants: z = − 0.122, P = 0.903, r = − 0.025, 95% CI = 17.391–30.769) contrary to the stories heard while awake (Wilcoxon signed-rank test to 25% across 24 participants: 46.80 ± 3.26%; z = 4.06, P < 0.001,
r = 0.83, 95% CI = 39.286–54.167; see Supplementary Table 1).
Sleep scoring. The continuous EEG and EOG signals were re-referenced to the mastoid electrodes (opposite mastoid for the EOG) and band-pass filtered between 0.1 and 30 Hz (two-pass Butterworth filter, fifth order). The EMG signal was obtained with a local derivation on the cheek and band-passed between 80 and 160 Hz (two-pass Butterworth filter, fifth order). Data were then segmented and scored on 20-s-long windows by an experienced scorer (T.A.) and following established guidelines32. Only a subset of channels (C3, C4, Fz and Pz) was used to score vigilance states along with the two EOG channels and the EMG channel. Recordings were scored as wakefulness (45.99 ± 2.19 min, that is, the mean duration ± s.e.m. across participants), NREM1 (9.58 ± 1.09 min), NREM2 (16.34 ± 1.52 min) and NREM3 (6.87 ± 1.62 min). NREM1 was not analysed here as we had a highly variable and often low number of trials per participant. Indeed, NREM1 is a volatile transitionary state between wake and sleep that is easily disturbed by auditory stimuli. We focused on NREM2 (here referred to as light sleep) and NREM3 (deep sleep) stages. Only 16 participants entered into deep sleep during the recording session. None of the participants entered the REM stage. Stimulus reconstruction. The EEG signal was here re-referenced to the signal averaged across all electrodes. The EEG signal was then filtered between 2 and 8 Hz with a two-pass Butterworth filter (fifth order) and then downsampled at 100 Hz to reduce data dimensionality. The filtered EEG signal was segmented according to trial onset and offset. The amplitude of the filtered EEG envelope was subsequently extracted by applying the Hilbert transform. In addition, for each trial, the audio stories played at that time (one story for the training phase; two stories for the test phases) were filtered below 8 Hz with a two-pass Butterworth filter (fifth order) and downsampled at 100 Hz. The sound’s envelope was obtained again by applying the Hilbert transform.
Training phase. A first step in the stimulus reconstruction approach is to compute
the linear model between the auditory input and the EEG signal. The model here was trained on diotic trials (one story played to both ears, six real-speech and six Jabberwocky stories for a total duration of 14.6 min). By using diotic trials, we ensured that the model was trained to decode the sound’s envelope regardless of attention. In addition, by using both real-speech and Jabberwocky stories in the training phase, we increased the probability that the decoders would be insensitive to the stimulus category. EEG data were shifted compared to the auditory envelope from 0 ms to 500 ms (here referred to as time lags), which allows the integration of a broad range of EEG data to reconstruct each stimulus time point22. In practice, this means that each sample in the auditory envelope was correlated with the band-pass EEG envelope from all sensors and all samples between 0 and 500 ms relative to the auditory signal. The linear model was optimized to map the EEG signal from each electrode and time lag to the sound envelope. The obtained filter (matrix of weights: sensor per time lags) was then used in the testing phase to reconstruct the stimuli (Fig. 1).
Test phase. Here, for each trial, two different auditory streams were played in
competition, one relevant story (real speech) and one Jabberwocky story. Using the trained model, one envelope can be reconstructed from the EEG signal. This reconstructed envelope is assumed to correspond to a noisy mixture of both streams’ envelope. To determine which story was predominantly reconstructed (if any), the reconstructed envelope was compared to both original envelopes using the Pearson correlation method. For each trial, we therefore obtained two Pearson correlation coefficients, one for the relevant story (rrelevant) and one for the
Jabberwocky story (rJabberwocky). These correlation coefficients were used as an index
of the quality of the stimulus reconstruction of the two streams. When rrelevant was
higher than rJabberwocky—that is, when the reconstructed envelope was more similar
to the envelope of the relevant story than to the envelope of the Jabberwocky story—signal tracking was declared as favouring the relevant story. Thus, trials with rrelevant > rJabberwocky were scored as correct (1; real-speech story tracked) and
performance (Fig. 2a–c) is the percentage of correctly decoded trials averaged across participants.
The reconstruction was either performed on the entire trials or on smaller windows (Figs. 2–4). Indeed, sleep is a dynamical process and sleep depth is more than likely to change over an entire trial duration (~73 s). As we intended to investigate both the effect of sleep stages on signal selection and its within-trial dynamics, we computed reconstruction scores on 10-s time windows either locked on the sleep scoring windows (Fig. 2a,b) or locked on the beginning of the stream (Fig. 2c,d). The former epoching was used to examine the influence of sleep stages on signal selection (Fig. 2a,b), whereas the latter was used to obtain the within-trial dynamics (Fig. 2c,d). When considering windows locked on trials onset, windows are no longer time locked to sleep scoring. Thus, a given window might contain different sleep stages. In such cases, the window was attributed the lightest sleep stage present.
Individual lags, weights and patterns. Each time point of the sound envelope was reconstructed by using 500 ms of the EEG signal (time lags). However, these different time lags do not equally contribute to the stimulus reconstruction10. To better understand the contribution of each lag, filters were trained on the EEG for each single time lag. An envelope was then reconstructed for each trial and compared to the envelope of the relevant and Jabberwocky stories. A correlation coefficient was therefore obtained for each stimulus category (relevant versus Jabberwocky stories) and individual lag. To get a reliable estimate of the contribution of each individual lag, we filtered out participants with less than five data points in a given sleep stage and averaged measures within the remaining participants. This procedure excluded 2 participants in deep sleep in the first half of the trials (n = 24, 24 and 14 in wakefulness, light sleep and deep sleep, respectively; Fig. 3) and excluded 4 participants in deep sleep in the second half of the trials (n = 24, 24 and 12 in wakefulness, light sleep and deep sleep, respectively; Supplementary Fig. 7). The corresponding values averaged across participants are shown in Fig. 3. In all stages, three reconstruction peaks were observed around 110, 230 and 330 ms. The positions of the peaks were determined by searching for the maximum reconstruction coefficients for each stimulus (relevant and Jabberwocky) on the following intervals in each vigilance state: 0–150 ms, 150–250 ms and 250–400 ms. The positions of the peaks were averaged across participants and approximated to the closest time lag. For each peak, the weights of the individual filter were extracted from the model and displayed on a topographical map (Fig. 3a). The patterns (that is, the spatial profile of the EEG activity used by the model) were extracted for each peak using the formula provided by Haufe et al.48:
= Σ Σ−^
A xW s1
where A denotes the pattern, ∑ x represents the covariance of the EEG signal,
W denotes the weight matrix at the individual time lag and Σŝ represents the covariance of the reconstruction.
Spindle and slow-oscillation detection. To investigate the influence of NREM-sleep graphoelements (slow oscillations and sleep spindles) on stimulus reconstruction, we relied on automated detection algorithms detailed elsewhere49–51. To detect slow oscillations, the raw EEG signal was re-referenced to the average mastoids. For each sensor, the EEG signal was first filtered between 0.2 and 3 Hz using a two-pass third-order Butterworth filter and downsampled at 100 Hz. Peaks and troughs of the filtered signal were detected as zero-crossings of the first-order derivative. Portions of signal were determined as slow oscillations when a peak and a trough were separated by more than 0.25 s and less than 2 s and the trough-to-peak amplitude was greater than 75 µ V50,51. Here, slow oscillations comprised both K-complexes and slow waves. However, slow oscillations detected in NREM2 had an asymmetrical profile characteristic of K-complexes and were often detected in isolation, whereas slow oscillations detected in NREM3 had a more symmetrical profile and tended to occur in trains (Supplementary Fig. 2). Thus, NREM2 slow oscillations were approximated to K-complexes and NREM3 slow oscillations to sleep slow waves. Spindles were also detected using an automated algorithm. The raw EEG signal was re-referenced to the mastoids. The EEG signal was then band-pass filtered between 11 and 16 Hz with a two-pass fourth-order Butterworth filter. The envelope of the signal within the spindle band was extracted using the Hilbert transform applied on the filtered signal. Spindle candidates were detected as epochs during which a given threshold was overcome. The threshold used to identify these candidate spindles was set for each sensor and participant separately as the mean + 2 s.d. of the envelope amplitude recorded during all NREM2 and NREM3 epochs. Spindles candidates longer than 2.5 s or shorter than 0.5 s were discarded, as well as spindles during which the envelope exceeded a maximal threshold (mean + 10 s.d.)49,50.
Decoding around sleep graphoelements. For each detected graphoelement (slow oscillations or sleep spindles), we applied the stimulus reconstruction approach with time lags between 0 and 250 ms. We extracted the Pearson coefficients corresponding to the relevant and Jabberwocky stories on sliding windows (4-s long, positioned every 100 ms) around each events onset (− 10 to 10 s; see Fig. 4).
The central window (t = 0) was locked on the negative peak of slow oscillations (Fig. 4a–c) and on the middle of spindles (Fig. 4b). K-complexes and spindles were detected in NREM2 and slow waves in NREM3. The slow waves and spindles were detected on the Cz electrode. Timecourses were averaged within participants and only participants with more than 5 detected graphoelements were kept for further analyses (n = 23, 23 and 15 for K-complexes, spindles and slow waves, respectively). Timecourses were then smoothed using a 500-ms-wide Gaussian kernel for display purpose only (Fig. 4). Statistical tests were performed on the data before smoothing. To investigate the effect of slow waves on reconstruction scores, we compared the reconstruction timecourse with the average reconstruction score in deep sleep. To estimate this average reconstruction score, we paired each detected slow-wave onset with a random time point selected within the same trial. We computed the reconstruction scores for the relevant and Jabberwocky streams around the random time points using a similar procedure than for the slow waves (4-s-long sliding window, running from − 10 to + 10 s around the selected random time points). The reconstruction score around random time points was then averaged and removed to the paired timecourse around the slow wave.
Statistics. Stimulus reconstruction scores were computed by correlating the auditory signal with the EEG signal. Pearson’s method, a parametric assessment of the correlation between two signals, was used as in O’Sullivan et al.19. Nonparametric statistics were used when comparing reconstruction scores and decoding performance across conditions. The use of Wilcoxon signed-rank test, which tests hypotheses on the median of two-paired distributions, limits the influence of outliers on statistical analyses. In addition, because our data set was unbalanced within and across participants as each recording session contains a unique combination of wake and sleep trials, we used linear mixed-effect models to account for the interaction between predictors on reconstruction scores and decoding performance (see Fig. 2). Using chi-squared (χ ²) tests, we estimated the significance of fixed effects by comparing a model with only subject identity as a random effect and a model with subject identity as a random effect and the variable of interest as a fixed effect. We estimated the significance of interactions using chi-squared tests by comparing a model with interaction with the same model without interaction.
To further confirm that the unbalanced number of trials in light and deep sleep did not bias the interaction between story type and sleep stage (see main text and Fig. 2b), we investigated this interaction using a bootstrap procedure. We generated bootstrapped samples (drawn with replacement) of equivalent size for light and deep sleep, repeating this procedure 2,000 times. For each bootstrapped sample, we created a permuted sample by randomly permuting trials in light sleep with trials in deep sleep. For each bootstrapped and permuted sample, we computed a mixed model and extracted the slope of the interaction between type of story and sleep stage. We then compared the distributions of the interaction of the bootstrapped and permuted samples. We found that the bootstrapped interaction values were significantly different from 0 (µ bootstrap= − 1.10 × 10⁻³, t-test against 0: t(1,999) =
− 17.3, P < 0.001, d = − 0.386, 95% CI = 1.226 × 10⁻³ to 9.761 × 10⁻⁴) contrary to
the one obtained with permuted data sets (µ permuted = 8.38 × 10⁻⁵, t-test against
0: t(1,998) = 0.76, P = 0.44, d = 0.017, 95% CI = − 1.324 × 10⁻⁴ to 2.999 × 10⁻⁴).
Moreover, the bootstrapped interaction values were significantly different from the ones obtained with permutations (µ bootstrap− µ permuted = − 1.18 × 10⁻³; unpaired,
two-samples t-test: t(3,998) = − 9.31, P < 0.001, d = 0.294, 95% CI = − 1.43 × 10⁻³ to
− 9.35 × 10⁻⁴). These results confirm the presence of a significant interaction
between story type and sleep stage, even when considering a downsampled data set. We visually checked for the normality of the distribution of bootstrapped interaction values, but this was not formally tested.
Effect sizes for Wilcoxon signed-rank tests were computed using the formula: =
r Zn
A 95% CI of the median was generated with bootstrapping using 10,000 resampling. Effect sizes for t-tests were computed using Cohen’s d (d = µ /σ ; that is, the mean divided by s.d.). We used the following format to report statistics: statistic (degrees of freedom), P value, effect-size statistic, 95% CIs for t-tests; and statistic,
P value, effect-size statistic, 95% CIs for Wilcoxon signed-rank tests (degrees of
freedom are not defined for Wilcoxon tests). All t-tests and Wilcoxon signed-rank tests were two sided.
Mixed-model analyses were performed in R (R Development Core Team) with the ‘lme4’ and ‘lmerTest’ R packages52,53. Time plots typically include numerous data points. To account for the problem of multiple comparisons in timeseries, we used nonparametric cluster-permutation statistics54. In this principled approach, each cluster was defined as the time points that consecutively passed a specified threshold (alpha threshold for cluster selection: α = 0.1 except for Supplementary Fig. 3: α = 0.15). The sum of the t-values of all of the time points within the cluster constituted the cluster statistics. These cluster statistics were compared for each cluster with the maximum cluster statistics obtained after the random permutations of the conditions examined (n = 1,000). From these permutations, we computed a Monte-Carlo P value that corresponds to the Pcluster reported in the