Tandem in time mass spectrometry and immunoassay for
PCDD/Fs screening
J.-F. FOCANT, G. EPPE and E. DE PAUW
Mass Spectrometry Laboratory, Chemistry Department, University of Liege, Allée de la Chimie, 17, B6c Sart-Tilman, B-4000 Liège, Belgium
Tel: +32 (0) 4 3663414; Fax: +32 (0) 4 3663413; e-mail: [email protected]
Polychlorinated dibenzo-p-dioxins (PCDDs) and polychlorinated dibenzofurans (PCDFs) (“dioxins”) are of great concern because of their presence as contaminants (ppt level) in the environment. GC/HRMS is the reference method in the field of trace analysis but doesn’t allow a rapid and low cost screening. Ion trap GC/MS/MS has been presented by March (Splendore et al., 1997) as a valuable physico-chemical screening method for PCDD/Fs. The fragmentation of stored parent yields to the formation of characteristic daughter ions resulting from the loss of COCli (Chess and Gross, 1980).
On the other hand, the use of a dioxin enzyme immunoassay (EIA) kit based on polyclonal antibody specific to 2,3,7,8-TCDD and related congeners can also be forseen (Harrison and Carlson, 1997, 1998). It is presented when used together with MS/MS in screening campaigns.
MS/MS optimisation
Optimisation of the MS/MS method was mainly focused on daughter ions formation, (CID voltage, qz) couple optimisation, excitation mode and CID time variation.
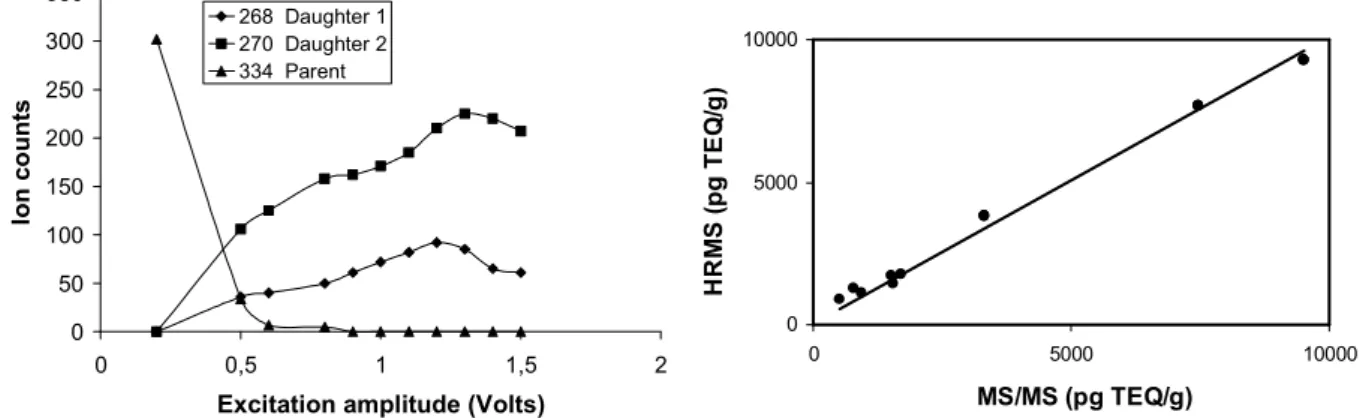
Fig. 1 : Global evolution of the TCDD species following CID voltage (left) and Correlation curve between MS/MS (Saturn 2000 GC/MS/MS) and HRMS (VG-AutoSpec-Q) fly ashes measurements.
0 5000 10000 0 5000 10000 MS/MS (pg TEQ/g) H R M S ( p g T E Q /g ) 0 50 100 150 200 250 300 350 0 0,5 1 1,5 2
Excitation amplitude (Volts)
Io n c o u n ts 268 Daughter 1 270 Daughter 2 334 Parent
Figure 1 (left) indicates the position of the optimum CID voltage for TCDD daughter ions formation; the good correlation (0.99, slope of 1.01) between MS/MS and HRMS is also illustrated.
Immunoassay semi-quantification
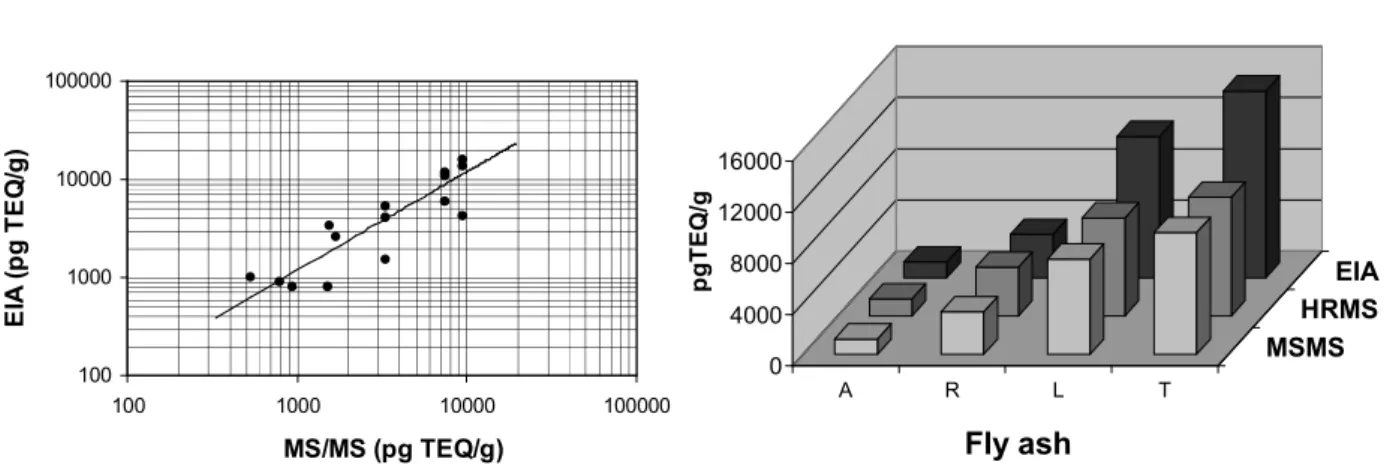
Fig. 2 : EIA response against MS/MS results on fly ashes (left) and overview of measurements (right).
EIA response follows quite well the evolution in the PCDD/Fs concentration (0.84, slope 1.19), EIA generally provides a general overestimation of the PCDD/Fs contents (Fig. 2).
A simple and time effective analytical strategy for the monitoring of the PCDD/Fs TEQ content in environmental samples is possible. This strategy can be described in 3 steps. A first sorting out using EIA can allow to separate negative from positive samples. In a second step, positive samples can be confirmed by GC/MS/MS. Nevertheless, a fully secure strategy should include the GC/MS/MS confirmation of negative EIA samples. Finally, the last step can be described as a confirmation of positive samples by HRGC/HRMS in order to allow precise congener and source identification. This combination of immunoassay and physico-chemical methods will reduce the global time and cost for efficient monitoring.
References
Chess, E.K., Gross, M.L., 1980. Determination of Tetrachlorodibenzo-p-dioxins by Mass Spectrometric Metastable Decomposition Monitoring. Anal. Chem. 52, 2057-2061.
Harrison, R.O., Carlson, R.E., 1997. A New Dioxin/Furan Immunoassay with Low Picogram Sensitivity and Specificity Appropriate for TEQ Measurement. Organohalogen Compd. 31, 139-144.
Harrison, R.O., Carlson, R.E., 1998. Measurement of PCDD/F TEQ by Immunoassay: Demonstration Using Real World samples. Organohalogen Compd. 35, 43-46.
Splendore, M., Plomley, J.B., March, R.E., Mercer, R.S., 1997. Tandem Mass Spectrometric Determination of Polychlorinated Dibenzo-p-dioxins and Polychlorodibenzofurans in a Quadrupole Ion Trap using Multifrequency Resonant Excitation. Int. J. Mass Spectrom. Ion Processes 165/166, 595-609.
Thanks to F.R.I.A., Region Wallonne and Robert O. Harrison (http://www.cape-tech.com/).
100 1000 10000 100000 100 1000 10000 100000 MS/MS (pg TEQ/g) E IA ( p g T E Q /g ) 0 4000 8000 12000 16000 A R L T MSMS HRMS EIA Fly ash p g T E Q /g