HAL Id: halshs-00856132
https://halshs.archives-ouvertes.fr/halshs-00856132
Preprint submitted on 30 Aug 2013
HAL is a multi-disciplinary open access
archive for the deposit and dissemination of sci-entific research documents, whether they are pub-lished or not. The documents may come from teaching and research institutions in France or
L’archive ouverte pluridisciplinaire HAL, est destinée au dépôt et à la diffusion de documents scientifiques de niveau recherche, publiés ou non, émanant des établissements d’enseignement et de recherche français ou étrangers, des laboratoires
Stricter employment protection and firms’ incentives to
train: The case of French older workers
Pierre-Jean Messe, Bénédicte Rouland
To cite this version:
Pierre-Jean Messe, Bénédicte Rouland. Stricter employment protection and firms’ incentives to train: The case of French older workers. 2012. �halshs-00856132�
WORKING PAPER
N° 2012 - 04
Stricter employment protection and
firms’ incentives to train:
The case of French older workers
P
IERRE
-J
EAN
MESSE,
B
ENEDICTE
ROULAND
www.tepp.eu
Stricter employment protection and firms’ incentives to
train: The case of French older workers
Pierre-Jean MESSE∗ and Bénédicte ROULAND†‡ July 8, 2011
Abstract
From French data, this paper uses a difference-in-differences approach combined with propensity score matching to identify the effect of an exogenous change in employ-ment protection among older workers on firm’s incentives to provide training. Laying off workers aged 50 and above, French firms have to pay a tax to the unemployment insurance system, known as the Delalande tax. In 1999, the measure was subjected to a reform that increased due taxes but that did not concern equally all firms. We find that this exogenous shock to employment protection for older workers substantially rises firms’ incentives to train the 45-49 age group of workers. This result confirms predictions of the simple labor market model we develop in a first stage.
JEL Classification: J14, J24, J26
Keywords: Older workers, employment protection, firms’ training incentives.
1
Introduction
It is widely known that employment rates in OECD countries considerably differ in age due to large age-differences in labor market flows1. In particular, employment rates of
older workers are low before the retirement age. This is a common characteristic to OECD countries, whatever the retirement age in force. Faced with these low employment rates of older workers, some countries have experimented with specific older worker employment protection in the form of higher firing taxes and subsidies on hiring (see OECD [2006]). In Belgium, Finland, France, Japan, Korea and Norway, it is indeed more costly for firms to lay off older workers because of longer notice periods or higher severance pay2. Specific
∗P.-J. Messe: University of Le Mans (GAINS-TEPP)
†B. Rouland: University of Le Mans (GAINS-TEPP), Faculté de droit et de Sciences Économiques,
Avenue Olivier Messiaen, 72085 Le Mans Cedex 9 - e-mail : benedicte.rouland@univ-lemans.fr
‡We are grateful to Francois Langot for thoughtful comments and suggestions. We also thank
Francois-Charles Wolff and Arnaud Chéron. We have received helpful comments on earlier drafts of this article from participants at the 2011 CNRS thematic school “Public Policies Evaluation”, JMA 2011 meeting, Journées LAGV 2011 and seminar participants at EPEE (Evry) and GAINS (Le Mans), with a special mention to Jean-Olivier Hairault. The usual disclaimer applies.
1The hump-shaped age-dynamic of employment in OECD countries reflects the age-dynamic of labor
market flows, characterized by U-shaped inflow rates to unemployment (firing rates) and age-decreasing hiring rates.
2
To compensate for age discrimination, governments in most European countries have also put specific inactivity and disability programs in place that provide generous substitution incomes until retirement. Finally, some countries have experimented with specific subsidies to increase the likelihood for older workers to find a job (UK, USA).
older worker employment protection should foster long-term relationships between older workers and employers3. For instance, Schnalzenberger and Winter-Ebmer (2009) show that an age-specific firing tax caused a substantial reduction in layoffs for older workers in Austria. A similar regulation for France has been analyzed by Behaghel, Crépon and Sédillot (2008). The authors show that the most stringent schedule of this tax following the 1999 reform (change that is under consideration in this paper) led to decrease sizeably layoffs of older workers in large firms.
In this paper, we examine a case of specific older worker employment protection and look at its effect on firms’ training incentives, which obviously raises specific age issues. Chéron, Hairault and Langot (2011) argue that the shorter distance to retirement (known as the “horizon effect”) is the key point for understanding the economics of older workers employment. This view is supported by empirical evidence on micro-data (see Hairault, Langot and Sopraseuth (2010)). Our work absolutely fits with these concerns. It is widely known indeed that training incidence is a function of age (Bassanini et al. (2007)). This is most related to a distance to retirement issue since the present value of net returns to human capital investments in older employees is lower due to the shorter period during which both employees and employers can reap the benefits of these investments. From a natural experiment in The Netherlands, Montizaan, Cörvers and De Grip (2010) show that a decrease in pension rights postpones expected retirement and then increases participation in training courses among older employees (although exclusively for those employed in large organizations). From an equilibrium search model supported by an estimation based on French data, Khaskhoussi and Langot (2008) show that a short distance to the retirement age explains the low investment in training of elderly.
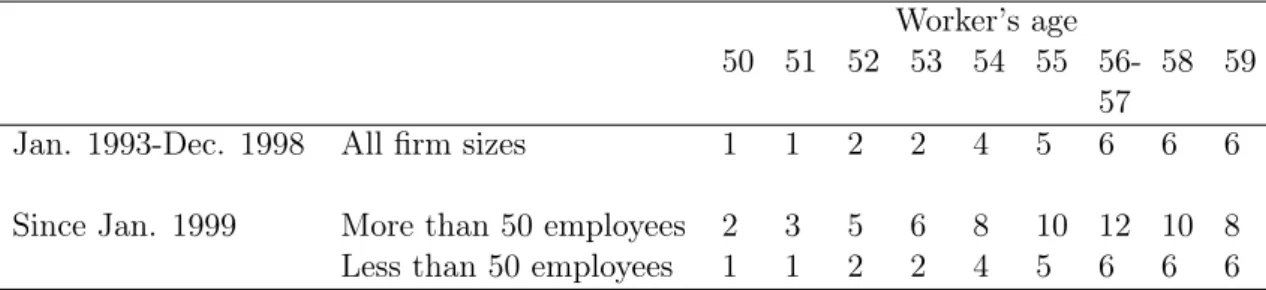
In this paper, using individual data, we try to properly identify the effect of stricter employment protection among older workers on firms’ incentives to engage in firm specific-skills. Specifically, we study the impact of the 1999 French Delalande tax change. Since its introduction in 19874, French firms have to pay a tax to the unemployment insurance system laying off workers aged 50 and above, known as the Delalande tax5. The amount of the tax is proportional to the worker’s gross wage at the time of layoff. Since 1992, firms are exempted from the tax for workers hired after the age of 50 if they are laid off later on. It is only due if the worker is employed under a permanent contract and only the private sector is concerned. The 1999 change resulted in an increase in the tax schedule for firms with more than 50 workers. This rise in the tax was implemented in a context of rapidly growing employment that benefited all categories of workers, except older unemployed workers. Table 1 shows how the amount of the tax has varied after the reform.
As the Delalande tax increases the firing cost of workers aged 50 and above, it comes to an age-increasing firing tax. Therefore, we have to account for the fact that employment protection may have an age-differentiated impact. In particular, Chéron et al. (2007) study the effect of introducing an additional tax when laying off older workers (near retirement
3The general conclusion reached in the large literature on employment protection legislation is that
employment protection measures do not have a significant impact on steady-state employment, but are likely to influence the dynamics of employment (see Young (2003) for a review). More precisely, with fewer job terminations and less job creation, EPL is known to reduce inflows into unemployment and outflows from employment, while also lowering outflows from unemployment and inflows into employment. However, this indirect negative effect of employment protection on the overall employment rate does not concern older workers as their hiring rate is very low. Therefore, only the direct effect on firing rates matters regarding older workers.
4
Since January 2008, the Delalande tax no longer exists.
Table 1: Delalande tax schedule according to the age of the laid off worker (monthly gross wage) Worker’s age 50 51 52 53 54 55 56-57 58 59
Jan. 1993-Dec. 1998 All firm sizes 1 1 2 2 4 5 6 6 6
Since Jan. 1999 More than 50 employees 2 3 5 6 8 10 12 10 8
Less than 50 employees 1 1 2 2 4 5 6 6 6
Source: Behaghel, Crépon and Sédillot (2008), legislative texts.
Notes: For each age group, the table displays the tax due by the firm to the unemployment insurance system if it lays a worker off. The tax is a function of previous wages, and is stated in months of growth wages.
age) by extending the theory of job creation and job destruction to account for a finite working life-time6. As far as our paper is concerned, two conclusions can be drawn. First,
the authors show that the introduction of the tax reduces firings of workers concerned by the tax while, on the contrary, the firing probability of workers who are below from the threshold-age of the tax increases. Indeed, the value of job continuation in the latter case is reduced because of the expected firing tax due in the last period of working life (in case of layoff), while retirement allows firms to avoid it. Anticipating the tax, firms increase layoffs before being subject to the tax while it is in their best interest to keep older workers on working in the last period of working life. Second, the authors provide a quantitative analysis of the “Delalande Tax”. Higher firing costs after 557 are found to lead to better employment protection for the 55-59 years-old (who benefit from an increase in the employment rate of 4.2 points) but to negatively affect the employment rate for workers aged 45-54 (decreases by 2.7 points). These findings are consistent with the study of Behaghel et al. (2008). A higher level of the tax indeed deterred firms from laying older workers off.
The 1999 Delalande tax change led to increase firing taxes differences in age terms by tightening employment protection of workers employed in large firms and aged 50 and above. To our knowledge, no paper has already studied the effect of an employment protection specific to older workers on firms’ incentives to engage in training. In light of these theoretical considerations, this seems to be an important concern. The approach and the key results we obtain can be summarized as follows. First, we develop a simple model of the labor market with both endogenous firing and training decisions, and where dismissals in the last period of working life (above a threshold-age) are subject to a firing tax. The impact of this tax on firm’s incentives to engage in training particularly depends on the way it affects firing decisions in the last period as firms anticipate this tax. In particular, job destructions of older workers decrease while firings of younger workers rise. Accordingly, we show that the firing tax has no effect on older workers training but only may rise the training incidence of younger workers. The reason is that the age-specific firing cost plays on the future expected returns but older workers will be retired in the next
6
The equilibrium of such models is typically featured by increasing (decreasing) firing (hiring) rates with age, and a hump-shaped age-dynamics of employment.
7
The calibration in Chéron et al. (2007) is based on the period before the 1992 tax reform. Therefore, the threshold-age above which firms are liable for the Delalande tax is 55 in their study while it is 50 in ours.
period. Further, we show that firms’ incentives to engage in training (for workers below the threshold-age) also depend on the arrival rate of idiosyncratic productivity shocks and on the initial job productivity: the lower the persistence of shocks, the higher firms’ incentives. This comes from a complementarity effect between job destructions and training investments (see Chéron and Rouland (2011)): training investments ensure a higher job value by increasing workers’ productivity, which in turn reduces the risk of layoff that would become too costly at the last period of working life due to the tax. Conversely, in the event of persistent productivity shocks, this complementarity effect that leads to protect matches against future bad productivity shocks no longer matters. The effect of the firing tax on training only rests on a simple productivity effect that determines whether the tax affects the probability that the job will be robust to ageing. Therefore, age-specific firing costs may have no impact on training incidence, particularly considering high productive jobs for which the job is initially robust. Accordingly, the lower the initial productivity, the more likely the tax has an effect on firms’ training incentives.
Empirical estimations on French data allow us to quantify these effects. In particular, we take advantage of the change in the Delalande tax schedule in 1999 to propose a reliable identification strategy based on the exogenous increase in the costs of laying older workers off. Indeed, we study employment protection reform in a case where the law explicitly treats workers differently depending on the firm size they work in. In particular, we use a difference-in-differences (DiD hereafter) approach combined with propensity score matching to compare older workers training rates in small and large firms, before and after the reform. By doing so, we are able to consistently estimate the average treatment effect on the treated, eliminating time-invariant biases between the treated sample and the comparison group sample due to mismatch related to firm size and differences in the measurement of the dependent variable. Once observable and unobservable factors are controlled for, we find a substantial effect of stricter employment protection on firms’ incentives to train workers, but only significant for the 45-49 age group. In particular, the training rate of these workers is increased by 11.5 points of percentage in large relative to small firms after the reform. As expected, the effect is not significant for workers aged between 50 and 54. Finally, we show that the treatment effect appears to be greater among less productive jobs, suggesting that the evolution of technology is not so rapid.
The paper proceeds as follows. In section 2, we develop the theoretical model. Section 3 presents data and associated descriptive statistics. Section 4 presents the identification strategy and the results obtained through DiD specifications. Finally, section 5 concludes.
2
Qualitative analysis: A simplified theoretical model
2.1 Model environment
We study the theoretical implications of older workers employment protection on firms’ incentives to engage in training in the following simplified environment. We consider a two-period, discrete time model in which older workers exit the labor market at the exogenous age T , perfectly known by employers. The last period of working life before retiring is denoted T− 1 and the next to last period T − 2. Apart from age i ∈ [T − 2, T − 1], there is no other heterogeneity across workers. The economy is in steady-state and we do not allow for any aggregate uncertainty.
matched8. The productivity of a worker is the sum of a random component ε and a
deterministic one yi(ki), derived from training investments in firm-specific skills during
both periods ki9. Lastly, at any age, workers earn an exogenous wage b.
The time of events and of decisions is as follows. First, at the beginning of the period, an idiosyncratic productivity shock may hit jobs at Poisson rate λ. If that is the case, a new job productivity ϵ is drawn in the general distribution G(ϵ) with ϵ ∈ [0, ε], and the firm has then no choice but either to continue production or to terminate the job for a zero return and dismisses the worker. Dismissals of workers aged T− 2 implies no specific cost while a firing cost F has to be paid when a firm fires a worker of age T − 1. In this way, we account for a specific older workers employment protection, experimented in many OECD countries10. Firms decide to close down any jobs which productivity is below an (endogenous) productivity threshold denoted Ri(ki) that depends on the invested
amounts in training. The job destruction rate is then determined by λG(Ri(k
i)). Second,
firms decide on the investment in firm-specific skills ki that determines both the human
capital of workers for the period yi(ki) and their overall human capital level11. There is
no human capital depreciation and skills are all allowed to accumulate between the two periods. Precisely, yT−2 = yT−2(kT−2) and yT−1= yT−1(kT−2, kT−1).
2.2 Firms’ decisions
Firing decision For a firm, the intertemporal value of a filled job depends both on the worker’s human capital yi(ki) and on the idiosyncratic component ε. We denote this
value by Ji(ki, ε). Further, there is no future expected profit in the value of JT−1(ki, ϵ)
as the worker will retire in T . We assume that firms pay all the training cost C(ki)12.
Corresponding Bellman equations for T − 1 and T − 2 satisfy, respectively:
JT−1(kT−2, kT−1, ε) = yT−1(kT−2, kT−1) + ε− b − C(kT−1) (1) JT−2(kT−2, ε) = y|T−2(kT−2) + ε{z− b − C(kT−2}) instantaneous profit + βλ [∫ ε RT−1(kT−2,kT−1)J T−1(k T−2, kT−1, x)dG(x)− F G(RT−1(kT−2, kT−1)) ] | {z }
expected profit in T− 1 if new shock + β(1| − λ)max{JT−1{z(kT−2, kT−1, ϵ),−F }}
expected profit in T − 1 if the shock lasts
(2)
8
As we only focus on training and firing decisions of firms, we do not account for the hiring process. Therefore and for the sake of simplicity, we consider associations already productive.
9
The additive form of the output of the match we assumed between an endogenous component (yi(ki))
and another exogenous one (ε) clearly simplifies calculations but also fits the usual definition of training. Usually, training is considered as a way to improve workers’ skills. Without training, workers are still able to produce but at lower productivity levels. To mention only a few, Lechthaler (2009) and Belot, Boone and van Ours (2007), within the framework of endogenous human capital and productivity shocks, consider an additive form of the output of the match as well.
10
We could also have formalized a specific older worker employment protection by considering firing costs due at any age but a higher tax for the last period of working life.
11
The function yi(ki) is supposed strictly increasing and concave, with y(0) = 0.
12
Integrating by parts ∫RεT−1(kT−2,kT−1)JT−1(kT−2, kT−1, x)dG(x) in equation (2) leads to ∫ε RT−1(kT−2,kT−1)(1− G(x))dx − F [ 1− G(RT−1(kT−2, kT−1)) ] . Therefore, equation (2) comes to : JT−2(kT−2, kT−1, ε) = yT−2(kT−2) + ε− b − C(kT−2) + βλ [∫ ε RT−1(kT−2,kT−1) (1− G(x))dx − F ] + β(1− λ)max{JT−1(kT−2, kT−1, ϵ) + F, 0} −β(1 − λ)F (3)
The endogenous job destruction rule leads to a reservation productivity RT−1(kT−2, kT−1)
in T − 1 defined by JT−1(kT−2, kT−1, RT−1) =−F as a firing cost has to be paid at this
period. On the other hand, the reservation productivity RT−2(k
T−2, kT−1) in T − 2 is
de-fined by JT−2(kT−2, RT−2) = 0 as dismissals do not imply any cost. Therefore, the firing
cost F has an opposite effect on RT−1(kT−2, kT−1) and on RT−2(kT−2, kT−1). It leads to
reduce the job destruction flow in T−1 while it increases it in T −2. As argued by Chéron et al. (2011), the reason is that it is in the best interest of firms in T − 1 to wait for the imminent retirement age that allows them to not to be subject to the tax. This is the labor-hoarding effect of firing costs. On the opposite, in T− 2, firms anticipate the future firing tax and increase dismissals. This is the perverse anticipation effect of age-specific firing costs. And the higher the firing cost, the more extensive these effects. In addition, training investments improve job tenure increasing future productivity gains. In particular, the higher the option value of filled jobs (expected gains in the future) depending on the training investments, the weaker the job destructions.
RT−1(kT−2, kT−1) =−yT−1(kT−2, kT−1) + b + C(kT−1)− F (4) RT−2(kT−2, kT−1) =−yT−2(kT−2) + b + C(kT−2) + βF − βλ ∫ ε RT−1(kT−2,kT−1) (1− G(x))dx − β(1 − λ)max{JT−1(k T−2, kT−1, RT−2) + F, 0} (5)
Training investment decision Firms choose how many firm-specific skills they invest in, in order to maximize the net expected value of a filled job. It follows that the investment decision in T − 2 is stated as:
max
ki≥0
Ji(ki, ε) =⇒ C′(ki) = J1(ki, ε) (6)
In this way, firms decide on the sum they invest in specific training so that the expected marginal return on investment is equaled to its marginal cost. The marginal return depends on present and future expected profits. In T − 1, the expected value of a filled job only depends on the instantaneous profit as workers retire in T . But the expected profit in T−1 is also determined by the training investment carried out in T − 2. Therefore, let denote
kT−1= κ(kT−2)13the optimal investment decision rule in T− 1 conditionally to kT−2 that
results from:
C′(kT−1) = y2T−1(kT−2, kT−1) (7)
If the job productivity drawn in T−2 lasts in T −1 (with probability 1−λ), the job also does if JT−1(kT−2, κ(kT−2), ϵ)≥ −F , which occurs with probability P (JT−1(kT−2, κ(kT−2), ϵ)+
F ≥ 0). This is the probability that jobs will be robust to ageing since the job
destruc-tion rule changes in T − 1 following the introduction of the firing tax14. By increasing productivity in T − 1, the training investment in T − 2 affects not only the expected job value in T − 1, but also this probability. Therefore, max
kT−2≥0 J T−2(k T−2, κ(kT−2), ε) leads to C′(kT−2) = J1(kT−2, κ(kT−2), ε) + J2(kT−2, κ(kT−2), ε), that is to: C′(kT−2) = y′T−2(kT−2) + βλ ∂∫RεT−1(kT−2,κ(kT−2))(1− G(x))dx ∂kT−2 + β(1− λ) { ∂P (JT−1(k T−2, κ(kT−2), ϵ) + F ≥ 0) ∂kT−2 [ JT−1(kT−2, κ(kT−2), ϵ) + F ]} + β(1− λ) { ∂JT−1(kT−2, κ(kT−2), ϵ) ∂kT−2 [ P (JT−1(kT−2, κ(kT−2), ϵ) + F ≥ 0) ]} (8)
First, from equation (1), ∂JT−1(kT−2,κ(kT−2),ϵ)
∂kT−2 is equivalent to y T−1 1 (kT−2, κ(kT−2)) + κ′(kT−2) [ yT2−1(kT−2, κ(kT−2))− C′(kT−2) ]
. Let denote A this expression. It is the net marginal return in T − 1 on the training investment carried out in T − 2 and is strictly positive. Second, from the Leibniz rule, differentiating ∫RεT−1(kT−2,κ(kT−2))(1− G(x))dx
with respect to kT−2 leads to: A
[
1− G(RT−1(kT−2, κ(kT−2)))
]
. Accordingly, equation (8) can be rewritten as:
C′(kT−2) = y′T−2(kT−2) + A{βλ [1− G(RT−1(.))] + β(1− λ) [ P (JT−1(kT−2, κ(kT−2), ϵ) + F ≥ 0) ]} + β(1− λ)[JT−1(kT−2, κ(kT−2), ϵ) + F ] [∂P (JT−1(k T−2, κ(kT−2), ϵ) + F ≥ 0) ∂kT−2 ] (9)
2.3 The effect of the age-specific firing cost on firms’ training incentives
Considering the effect of F on kT−2, we explore two different cases separately, according
to the value of the rate λ. This helps us to identify mechanisms at work.
13
With κ′(kT−2)≥ 0.
14JT−1(k
No persistence of shocks (λ = 1) Combining equations (9) and (4) implies:
Φ(kT−2, F )≡ −C′(kT−2) + yT′−2(kT−2) + βA
[
1− G(RT−1(.))]= 0 (10)
Differentiating equation (10) leads to ∂kT−2
∂F =−
Φ2(kT−2,F )
Φ1(kT−2,F ) where Φ1(kT−2, F ) is
nec-essarily negative to get an interior solution. Therefore, the impact of F on kT−2 only
depends on the sign of Φ2(kT−2, F ):
Φ2(kT−2, F ) = βA [ ∂[1− G(RT−1(.))] ∂F ] ≡ βAg(RT−1(k T−2, κ(kT−2))) > 0 (11)
The impact of F (due in T−1) on kT−2rests on the way the tax affects the probability
the job does not terminate after a productivity shock. When there is no persistence of shocks for sure, an increase in the firing cost clearly rises firms’ incentives to engage in workers’ training in T−2. This comes from a complementarity effect between training and firing decisions15. In particular, firms have strong incentives to protect matches against bad productivity shocks when a new shock will definitely hit the job and while dismissals in the next period are subject to the tax. The training investment increases the worker’s productivity and therefore the (intertemporal) job value, which in turns reduces the risk of layoff that would become too costly at the next period because of the tax. It is worth notic-ing that firms’ trainnotic-ing incentives concerns both bad and high productive jobs (determined by the value of ϵ) as the value of the new shock in T − 1 is completely independent of its value in T− 2. Nevertheless, this unambiguous impact of F on training is not independent of the degree of persistence of the i.i.d. shock.
Possible persistence of shock (0 < λ < 1) Combining equations (9) and (4) implies:
Φ(kT−2, F )≡ − C′(kT−2) + yT′−2(kT−2) + A{βλ [1− G(RT−1(.))] + β(1− λ) [ P (JT−1(kT−2, κ(kT−2), ϵ) + F ≥ 0) ]} + β(1− λ)[JT−1(kT−2, κ(kT−2), ϵ) + F ] [∂P (JT−1(k T−2, κ(kT−2), ϵ) + F ≥ 0) ∂kT−2 ] = 0 (12)
Again, the derivative of kT−2 has the same sign as Φ2(kT−2, F ):
15
Chéron and Rouland (2011) show that job destructions and training investments are highly comple-mentary since firms have strong incentives to invest in training to protect matches from idiosyncratic productivity shocks. Expected productivity gains due to training investments rise the job tenure, which in turn encourages firms to invest more.
Φ2(kT−2, F ) = βλAg(RT−1(.)) + β(1− λ)A [ ∂P (JT−1(.) + F ≥ 0) ∂F ] + β(1− λ) [ ∂P (JT−1(.) + F ≥ 0) ∂kT−2 ] + β(1− λ) [ ∂2P (JT−1(.) + F ≥ 0) ∂kT−2∂F ] [ JT−1(.) + F] (13)
The last term on the right-hand side is equal to zero as the training investment in T−2 affects the probability P (JT−1(k, ε) + F ≥ 0) through the accumulation of human capital,
which does not depend on the tax level. Therefore, when shocks may be persistent between periods, the effect of the firing cost in T − 1 on the training investment in T − 2 not only depends on the positive effect of the tax on the probability the job does not terminate after a productivity shock (first term of the right-hand side), but also on the way the training investment itself and the firing cost affect the probability that the job will be robust to ageing (second and third term of the right-hand side). This second impact is not clearly stated. In particular, the tax may have no effect on this probability that the job will be robust to ageing considering high productive jobs for which the job is initially robust (the job value is higher than −F from T − 2). The lower the idiosyncratic productivity drawn
in T − 2, the more likely the tax has an effect on this probability. Overall, the lower the
persistence of shocks (i.e. the higher λ), the higher firms’ incentives to engage in training
in T − 2 to protect matches against bad productivity shocks. But, for low values of λ,
the job productivity has to be low in order to encourage firms to engage in training. The impact of F on kT−2 actually depends on the value of λ and on the initial job productivity.
The 1999 Delalande tax change leads to increase firing taxes differences in age terms by rising the firing costs of workers aged 50 and above. Following the theoretical predictions we developed, training rates of workers affected by the reform (50 and above) are not likely to increase following the tax change. The tax change only may have an effect on the training incidence of workers below the threshold-age. But all depend on the evolution of technology and of the initial job productivity. In the event of rapid change of technology, training investments ensure a higher job value by increasing workers’ productivity, which in turn reduces the risk of layoff that would become too costly after 50. Training investments help to protect matches against future bad productivity shocks. Conversely, in the event of persistent idiosyncratic productivity, the lower the initial productivity, the higher firms’ training incentives. Next sections empirically quantify these effects.
3
Data and descriptive statistics
3.1 Data description
To assess the effect of the Delalande tax reform on firm-provided training, we use in this study two complementary French databases. The first one is a cross-sectional survey entitled “Formation Continue” conducted by INSEE (the French National Institute for Statistics and Economic Studies) in March 2000. It was carried out on a sample of 28667 individuals. The main interest of this survey is that it includes detailed information on training. In particular, it provides accurate information on the different training periods
followed by each respondent along the life cycle. From the questionnaire, it is possible to separate three main periods: i) from exit to school to February 1998, ii) from March 1998 to December 1998 (training in 1998 hereafter), and iii) from January 1999 to March 2000 (training in 1999 hereafter). The "Formation Continue" survey gives information about the financing organization. We decide to only consider firm-financed training as the Delalande tax reform affects firms. This was the case for about 81% (80%) of the older workers having participated in a training program in 1998 (1999). The survey also describes the type of experienced training using four categories: i) training in a work situation, ii) apprenticeships, iii) work placement or training courses and iv) self-training. Furthermore, we have information about the purpose of the training activity, which has to fit in one of the following categories: i) to adapt to the job, ii) to switch to another job or to get a job, iii) to obtain a diploma or a certification, iv) to execute political duties, v) personal or cultural reasons, and vi) no specific reason. When turning to the data, we choose to only consider the first motive since it was the result of 75% (82%) of the firm-financed training sessions received by employees in 1998 (1999).
We merge these data with the 1998 and 1999 waves of the French Labor Force Survey (“Enquête Emploi”). This is a rotating panel since exactly one-third of the sample is dropped from the sample each year and is replaced with a new, comparable sample drawn from the current population. The size of the Enquête Emploi is about 135000 individuals who are yearly interviewed about their situation on the labor market. The main feature of these data is that they provide detailed information over two years for two-third of the 1998 original sample. This means that we can investigate firms training decisions before and after the reform. Finally, for each respondent, the Enquête Emploi contains detailed information about socio-demographic individual characteristics, as well as job and firm characteristics.
3.2 Sample selection and descriptive statistics
We define our sample in the following way. First, we exclude farmers and self-employed as well as individuals working in the public sector since layoffs are very infrequent in the public sector. We focus on the population of respondents aged from 45 to 54 in March 199816. Furthermore, we restrict our analysis on men to control for the distance to retirement that determines the number of contributive years from graduation17. As the distance to retirement is expected to have a strong impact on firm training decisions, we consider only men in our sample. Dropping the few missing values (mainly because of missing firm sizes)
16Workers aged 55 are so close to the retirement age that we expect the reform will have no effect on
their access to firm-financed training (“horizon” effect).
17Following Hairault et al. (2010), distance to retirement is captured by the difference between the
current age and the retirement age. Considering the French pension system, the retirement age can be approximated by the required number of contributive years to get the full pension rate: the full pension age which is exogenous to the labor market status. The distance to retirement for an individual is then equal to the full pension age minus her current age. However, if a person enters the job market at a very young age, she cannot retire before the eligibility age for full pension (60 years old) even though she has accumulated the required number of contributive quarters before this age. In this case, the retirement age is then set at 60 and the distance to retirement is 60 minus the current age. While unemployment episodes in the French system are included in the number of contributive periods, this proxy for the retirement age does not take into account non-continuous careers due to maternity leaves and family commitments. The retirement age is then only relevant for male, which implies to consider only male workers in our sample selection.
and selecting only workers who were working both in 1998 and in 199918, we have a total
set of 1000 observations for each year. We consider the participation of these individuals to a firm-financed training spell while employed between March 1998 and December 1998 for the pre-reform period and between January 1999 and March 2000 for the post-reform period.
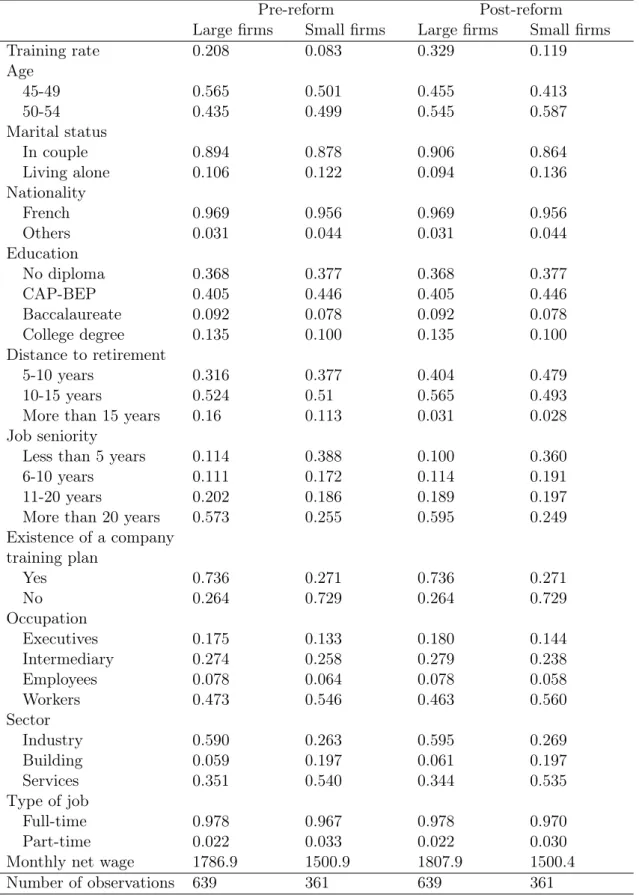
Some descriptive statistics about the sample we use are provided in table 7 in appendix. First, focusing either on large or small firms, there are very few differences between the pre- and the post-reform period, except for the distance to retirement. Beyond these differences, comparing individuals employed in firms with 50 workers or more and those employed in firms with less than 50 workers is of particular interest to us. Not surprisingly, the probability that the firm has a training plan is overwhelming in large related to small firms (depending on the year, about 73% against 27%)19. Similarly, we observe that job seniority tends to be much higher for individuals working in large firms than for those working in small firms. Furthermore, the sectoral composition strongly depends on firms’ size as well. For instance, the building sector represents barely 6% of all the jobs in large firms while it is about 20% in small ones. Large firms are also characterized by the predominance of the tertiary industry while the manufacturing sector is the greatest in small firms. Lastly, regarding the wage distribution, workers in large firms have on average better paid jobs than workers in small ones (about 1800 euros a month against 1500 euros)20.
As these variables may strongly matter in explaining the access to firm-financed train-ing, the observed deviations make both groups not comparable. We have then to estimate the causal effect of the change in the Delalande tax schedule on workers’ training rate by accounting for the differences in the distribution of covariates between both groups. Following Heckman, Ichimura and Todd (1998) and Blundell and Costa Dias (2000, 2004), we exploit the panel aspect of the data using a conditional DiD approach.
4
Quantitative analysis: Identification strategy and results
The goal of the paper is to measure the impact of stricter employment protection among older workers on firms’ incentives to provide training. We exploit a discontinuity in the Delalande tax reform: in 1999, the legislation led to an increase in the tax for firms with 50 workers or more while the tax remained unchanged for firms with fewer than 50 employees. The treatment is a unexpected one-time change in government policy and applied almost equally to all members of the treatment group21. The one-time nature of the change makes it easy to select specific pre- and post-treatment points in time. Consequently, we choose
18This selection allows us to use a balanced panel for estimations. However, less than 1% of individuals
employed in 1998 were fired in 1999.
19This result is in line with Bassanini et al. (2007) and Montizan et al. (2010) for instance, who show
that training incidence is much higher among larger organizations.
20
Table 8 in appendix gives the difference in means between both groups for each observable character-istic. This confirms results in table 7. Thus, the difference in the probability of having a company training plan between large and small firms exceeds 0.46 for each year and for both samples for instance. Besides, jobs in building or tertiary sector are over-represented in small organizations, while jobs in the industrial sector represent around one third of all the jobs in large firms.
21As reported in table 1, even though the due tax doubles in most ages, the tax reform is not strictly
equally applied to all workers according to their age since it also trebles in cases. The rise is also less significant in oldest ages. However, given the sizeable tax reform, the effect is never insignificant, so that evaluating its impact on the whole group is not a problem.
to use a DiD approach combined with propensity score matching for our evaluation22.
The basic intuition of the DiD approach is to study the impact of some “treatment” on the recipients, comparing the difference in average performance of the eligible group pre- and post-treatment relative to the performance of some control group pre- and post-treatment. More formally, let Pi,t be a dummy variable equal to 1 if worker i has participated to a
firm-financed training session at time t, with t ∈ {1998; 1999}. Treatment and control group are identified by the dummy variable Ti, such that Ti= 1 if the worker i is employed
in a large firm (i.e. a firm with more than 50 employees)23. A set of covariates Xi,t
assumed to affect significantly the access rate to firm-provided training is also included. In this way, we include common training determinants such as gender, marital status, occupation, education, nationality, job seniority, existence of a training plan in the firm. Finally, following Hairault et al. (2010), we also include the distance to retirement in the set of regressors.
We aim at estimating the following linear probability model:
E(Pi,t= 1) = βXi,t+ Uit if t = 1998 (14)
E(Pi,t= 1) = βXi,t+ αiTi+ Uit if t = 1999 (15)
where Ui,t is the error term assumed to be normally distributed with a mean 0. In
equation (15), αi measures the effect of the change in the tax schedule on the access rate
to firm-provided training of each individual i. As shown by Blundell and Costa Dias (2000), the individual-specific component of the treatment effect may differ between the treatment and the control group of individuals, making the identification of the average effect of the treatment more difficult. In this setting, a DiD approach allows us to recover the average effect of the treatment on the treated individuals (ATT effect hereafter) under certain conditions. The DiD estimator can be stated as:
αDiD= [E(Pi,99= 1|T = 1) − E(Pi,99= 1|T = 0)] (16)
− [E(Pi,98= 1|T = 1) − E(Pi,98= 1|T = 0)]
In addition, we consider the following decomposition of the error term Ui,t:
Ui,t = ϕi+ θt+ µi,t
where ϕi stands for an individual-specific effect constant over time. θt represents a
common time effect (or common macro effect) and µi,t is a temporary individual specific
effect. Substituting equations (14) and (15) into (16), the DiD estimator can be expressed in the following way:
αDiD = E(αi|Ti = 1)
+ β[E(Xi,99|Ti = 1)− E(Xi,99|Ti= 0) + E(Xi,98|Ti= 0)− E(Xi,98|Ti = 1)] (17)
+ [E(µi,99|Ti = 1)− E(µi,98|Ti = 1) + E(µi,98|Ti = 0)− E(µi,99|Ti= 0)]
22Of course, DiD method and natural experiments are not the only way to evaluate the effect of a
treatment. See Blundell and Costa Dias (2000) for a review of non-experimental methods for the evaluation of social programmes.
23
Workers employed in large firms but hired after 50 years old are included in the control group, together with workers employed in small firms.
The first term in the right-hand side represents the ATT effect. The second term stands for the difference in means of covariates across groups (i.e. treatment and control groups) for each year. The last term indicates the unobserved temporary individual-specific com-ponent of the error term. It is worth noting that the DiD estimator allows to remove unobservable individual-specific effects constant over time and common time effects. How-ever, the second and the third term must equal to 0 in order the DiD estimator to provide a consistent estimate of the ATT effect. Thus, the DiD estimator is based on the identifying assumption that, in absence of the treatment, the average outcome for the treated would have experienced the same variation as the average outcome for the untreated (such that without treatment αDiD = 0): this is the “time invariance” assumption. Formally, this
identifying assumption writes:
E(Pi,99= 0|T = 1, X1,99)− E(Pi,98= 0|T = 1, X1,98) (18)
= E(Pi,99= 0|T = 0, X0,99)− E(Pi,98= 0|T = 0, X0,98) (19)
In the next part, we estimate the ATT effect of the change in the Delalande tax schedule on the access rate to firm-provided training, assuming time invariance through a DiD approach. Then, we relax this assumption by re-estimating the ATT effect through a DiD regression combined with a propensity score matching procedure. Finally, we try to identify workers’ characteristics for which the ATT is significant and positive.
4.1 A DiD approach
We first aim at checking whether the tax change had an effect on firms’ incentives to provide training. As in Kugler and Pica (2008), we then estimate the following linear probability model to control for the possibility that higher training rates are the result of changing characteristics of workers:
E(Pi,t = 1|Xi,t, Ti, τt) = βXi,t+ δ1Ti+ δ2τt+ αDiD(Ti∗ τt) + ci+ Ui,t (20)
where ci is an individual effect and τt a dummy variable that takes the value of 1
from 1999 (ie after the reform) and zero otherwise. The interaction term between the large firm dummy and the post-reform dummy captures the effect of interest. αDiD then
identifies the causal effect of treatment under the identifying assumption (18) resulting in E[ui,t|Pi,t] = 0.
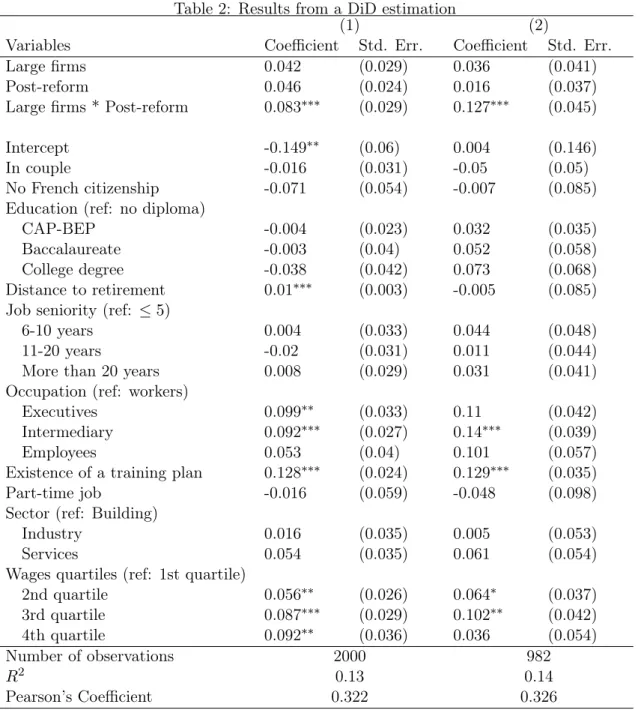
Table 2 reports marginal effects of the linear probability model using equation (20). Column (1) reports results for the whole sample of workers aged between 45 and 54 while column (2) gives results for workers aged between 45 and 49. First, they show a large and statistically significant raise in training access in large relative to small firms after the reform was introduced. Thus, increasing employment protection of older workers through the tax reform leads to rise by 8.3 (12.7) percentage points the training rate of workers aged 45-54 (45-49) in large firms. The treatment effect is stronger for the 45-49 age group than for the 45-54, which just goes to prove that 50 is a fateful threshold that determines firms’ firing and training decisions. Besides, the training access rate only significantly rises for workers aged between 45 and 49. This result confirms theoretical predictions of section 2.
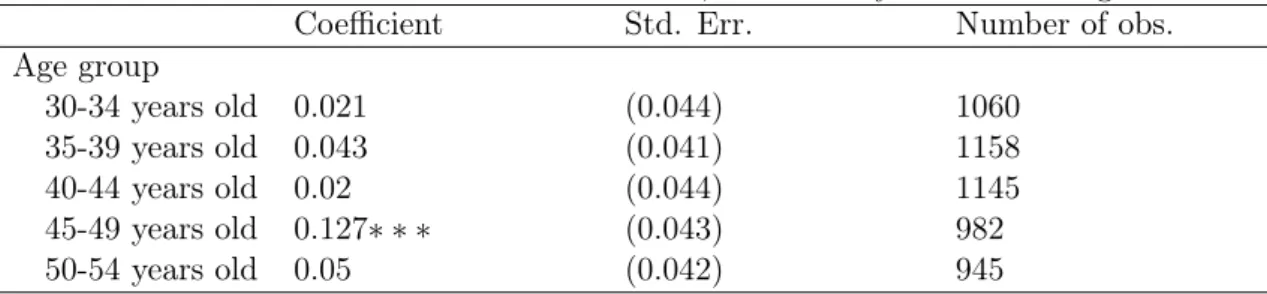
The positive and significant ATT effect for workers aged between 45 and 49 might result from the implementation of other reforms than the change in the Delalande tax schedule. For instance, in 1999, the French government introduced the 35-hour workweek regulation but all French firms did not sign an agreement on working time reduction at the same time. As shown in Aeberhardt et al. (2011), the signing date of such a regulation strongly depends on firms size. In particular, the signing date was earlier for large firms than for small firms. Consequently, this could have a differentiated impact on firms’ training incentives between treated and control groups of observations. We suggest a simple test to check whether the effect of working time reduction on training rates would differ across groups. In the null hypothesis, the effect would be the same between both groups and would be removed by the DiD approach. Therefore, the DiD estimator would be significant only for workers aged 45-49, in line with our theoretical results. In the alternative hypothesis, the effect of the switch to the 35-hour workweek would differ across groups and the DiD estimator should be significant for all cohorts of workers. To perform this test, we estimate the same linear probability model as in equation (20) without any selection on age, including workers aged between 30 and 54. Results are presented in table 3. Only interaction terms αDiD are
reported. This table shows that the training access rate only significantly rises for workers aged between 45 and 49. Therefore, the null hypothesis cannot be rejected. The effect of the switch to the 35-hour workweek is similar between groups and is removed by the DiD approach.
Finally, table 2 also gives information on the determinants of workers’ access to firm-financed training sessions. Results show that there are neither nationality nor sectoral differences in participation. There is also no significant differences between job seniority. But there is a positive effect of occupation on the probability of having been trained. Thus, training is much more frequent among executives and intermediaries. As expected, the existence of a training plan in the firm raises significantly enrolments in training. The higher the wage, the higher the training incidence as well. The last finding is the positive effect of the distance to retirement. That is for sure all the more profitable for firms to train older workers that they are likely to remain employed for a long time24
4.2 A DiD matching strategy
Time invariance assumption implies that the average training propensities for workers employed in large firms would have experienced the same variation as the ones for workers employed in small ones, had they worked in small firms as well. To be plausible, this assumption then requires that being employed in a large firm is similar to working in a small one. However, given differences between both groups highlighted in tables 7 and 8, one may not be confident with the time invariance assumption. Therefore, to account for the differences in the distribution of covariates between the treated and the control group, we implement a conditional difference-in-differences estimator (CDiD), as suggested by Heckman, Ichimura and Todd (1998) and Blundell et al. (2000, 2004). This method combines a propensity score matching approach with DiD such that, at each period, a counterfactual outcome for workers employed in large firms if they were working in a small one is estimated semiparametrically. This technique enables us to relax, relative to standard DiD, the linear assumption when controlling for observables and to control for unobservables exploiting the panel dimension of the data. The matching procedure
24All in all, these results are in line with Chéron, Rouland and Wolff (2008) who estimate the impact of
Table 2: Results from a DiD estimation
(1) (2)
Variables Coefficient Std. Err. Coefficient Std. Err.
Large firms 0.042 (0.029) 0.036 (0.041) Post-reform 0.046 (0.024) 0.016 (0.037) Large firms * Post-reform 0.083∗∗∗ (0.029) 0.127∗∗∗ (0.045) Intercept -0.149∗∗ (0.06) 0.004 (0.146) In couple -0.016 (0.031) -0.05 (0.05) No French citizenship -0.071 (0.054) -0.007 (0.085)
Education (ref: no diploma)
CAP-BEP -0.004 (0.023) 0.032 (0.035)
Baccalaureate -0.003 (0.04) 0.052 (0.058)
College degree -0.038 (0.042) 0.073 (0.068)
Distance to retirement 0.01∗∗∗ (0.003) -0.005 (0.085)
Job seniority (ref: ≤ 5)
6-10 years 0.004 (0.033) 0.044 (0.048)
11-20 years -0.02 (0.031) 0.011 (0.044)
More than 20 years 0.008 (0.029) 0.031 (0.041)
Occupation (ref: workers)
Executives 0.099∗∗ (0.033) 0.11 (0.042)
Intermediary 0.092∗∗∗ (0.027) 0.14∗∗∗ (0.039)
Employees 0.053 (0.04) 0.101 (0.057)
Existence of a training plan 0.128∗∗∗ (0.024) 0.129∗∗∗ (0.035)
Part-time job -0.016 (0.059) -0.048 (0.098)
Sector (ref: Building)
Industry 0.016 (0.035) 0.005 (0.053)
Services 0.054 (0.035) 0.061 (0.054)
Wages quartiles (ref: 1st quartile)
2nd quartile 0.056∗∗ (0.026) 0.064∗ (0.037) 3rd quartile 0.087∗∗∗ (0.029) 0.102∗∗ (0.042) 4th quartile 0.092∗∗ (0.036) 0.036 (0.054) Number of observations 2000 982 R2 0.13 0.14 Pearson’s Coefficient 0.322 0.326 Significance levels: ∗: 10% ∗∗: 5% ∗∗∗: 1%
Source: French Training Survey “Formation Continue 2000” and Labor Force Survey (waves 1998 & 1999) Lecture: Column (1) gives results for the whole sample while column (2) gives results for the restricted sample on age, including only workers between 45 and 49. The interaction term between “large firms” and “post-reform” measures the DiD.
Table 3: Results from a DiD estimation, without any selection on age
Coefficient Std. Err. Number of obs.
Age group 30-34 years old 0.021 (0.044) 1060 35-39 years old 0.043 (0.041) 1158 40-44 years old 0.02 (0.044) 1145 45-49 years old 0.127∗ ∗ ∗ (0.043) 982 50-54 years old 0.05 (0.042) 945 Significance levels: ∗ ∗ ∗ : 1%
Note: Only interaction terms αDiD of DiD are reported.
makes the distribution of covariates across groups comparable by building a suitable sample control group. Besides, Smith and Todd (2005) show that the DiD matching estimator performs the best among nonexperimental matching based estimators.
As it is the only age-group for which the Delalande tax change had an effect, we focus in this section only on workers aged between 45 and 49. We first build a correct sample counterpart for the missing information on the treated outcomes, had they not been treated. This leads to re-establish the conditions of an experiment with a total random assignment into treatment, by matching each treated observation with a similar individual of the control group on the basis of some observable variables. In a second step, we estimate the ATT effect using a DiD regression and weighting non treated observations according to their closeness to the treated ones in terms of a set of covariates X.
As before, Ti is the dummy variable equal to one if the agent i is employed in a firm
with more than 50 workers. Following Rosenbaum and Rubin (1983), matching is usually carried out on the propensity to participate as a function of observable characteristics X:
e(X) = P (Ti = 1|Xi), which is the propensity score. The usual assumption required to
estimate what would be the average probability of being trained of workers employed in large firms if they were working in a small one is the conditional independence assumption:
E(Pi99= 1|Ti= 0)− E(Pi98= 1|Ti = 0)⊥ Ti|e(Xi) (21)
We use a probit model to estimate the propensity score, that is the probability of work-ing in a large firm dependwork-ing on observable covariates. These ones should ideally include all important variables influencing this probability. The propensity score matching proved to be successful since the goodness of fit of the probits is high: on average, they correctly predict the treatment status in approximately 78% of the cases. Results of the probit estimates are reported in Appendix (Table 9). Not surprisingly, some observables such as job seniority or the presence of a training plan in the firm strongly affect the probability of working in a firm with 50 workers or more. Workers employed in the industrial sector are also more likely to work in a large firm.
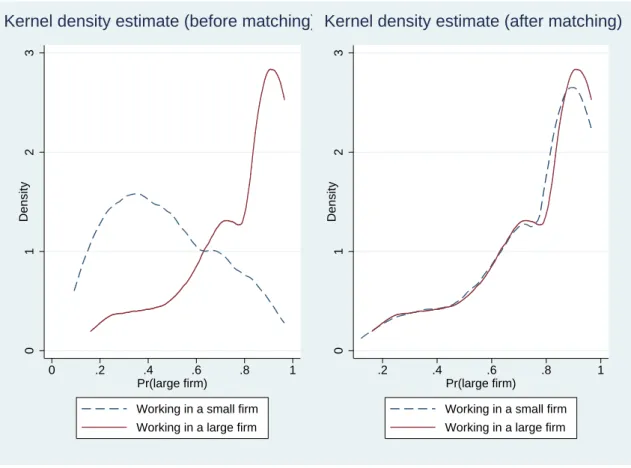
Propensity score matching can be successful concerning the conditioning on observable characteristics only if the estimated propensity scores of workers employed in large and small firms overlap sufficiently. We implemented a common support requirement which led to the discarding of sixteen cases that were outside the common support region. Fi-nally, after matching, all observable characteristics should be balanced between workers employed in a large firm and matched comparison observations. This is illustrated below in Figure 1, which reports the kernel density estimates of the propensity scores for workers
employed in large firm and those employed in small ones. The matching procedure do allows to make the distribution of covariates across groups comparable.
Figure 1: Common support of the propensity scores
0 1 2 3 Density 0 .2 .4 .6 .8 1 Pr(large firm)
Working in a small firm Working in a large firm
Kernel density estimate (before matching)
0 1 2 3 Density .2 .4 .6 .8 1 Pr(large firm)
Working in a small firm Working in a large firm
Kernel density estimate (after matching)
In a second step, we estimate the ATT effect by using a DiD regression and implement-ing a weight function Wij in the sample of workers employed in a small firm, relative to the
predicted propensity score e(X) of each individual i. We apply kernel matching estima-tors. The counterfactual outcome is then estimated on the basis of a weighted average of all workers employed in a small firm j. Denoting by αDiDM the DiD matching estimator,
we can write:
αDiDM = Σi[(E(Pi,99= 1|Ti= 1)− E(Pi,98= 1|Ti= 1)) (22)
− ΣjWij(E(Pj,99 = 1|Ti = 0)− E(Pj,98 = 1|Ti= 0))]
where Wij is the weight placed on comparison observation j for individual i.
Once we make observations comparable between treated and control groups, we find that the change in the EPL led to an increase in the access rate to employer-provided training of treated individuals by 11.5 points of percentage25, which is very similar to the effect we estimated using a simple DiD approach.
25
The corresponding standard error is (0.041), which means that the estimate is significant at the 5% level.
4.3 A different treatment effect across skill groups
Results from empirical sections have highlighted that costlier firing taxes for workers above 50 and employed in large firms rise firms’ training incentives, but only the 45-49. According to the theoretical predictions from section 2, one may wonder whether these firing taxes had a different impact among the 45-49 depending on the skill level. Indeed, we have shown that, in the event of persistent productivity shocks, the effect of the firing tax on training rests on a simple productivity effect that determines whether the tax affects the probability that the job will be robust to ageing. Considering high productive jobs for which the job is initially robust, the tax will have no effect on training incidence. The lower the initial productivity, the more likely the tax has an effect on firms’ training incentives. Accordingly, we can expect that the 1999 Delalande tax change only had an effect on the training incidence of less productive workers. Conversely, in the event of rapid evolution of technology, all workers maintained in employment are likely to face higher training rates following the tax change, whatever their initial skill level. This comes from a complementarity effect between job destructions and training investments. Therefore, we should not find any significant differences across skill groups.
One may assume that the less productive workers are also the less educated, those whose earnings are the lowest, or else workers who have the less important jobs. Therefore, we address these concerns by performing new estimations based on equation (20) and decomposing by occupation, wages quartiles and education26. Again, the interaction term between the large firm dummy and the post-reform dummy captures the effect of interest and identifies the causal effect of treatment. Results are presented in tables 4 to 6. They show that the treatment effect tends to be stronger for the less productive jobs, suggesting that the evolution of technology is not so rapid. High-productive workers do not become bad from one day to another. Therefore, training investments allow firms to increase productivity of less productive workers who have been kept on working so that their job will be robust to ageing. More productive workers do not need training since the expected value of their job plus the firing tax is strictly positive from the beginning. Precisely, the tax reform leads to rise significantly the training propensity of workers in blue-collar jobs and employed in large firms (+14.5 percentage points) while it did not affect significantly training incidences of others categories of workers. Workers whose earnings belong to the second quartile are the only one to have benefited from the tax reform (+8 percentage points)27 and the 1999 tax change only had a significant impact on workers who have no
diploma.
5
Conclusion
This paper investigates, both theoretically and empirically, the effect of stricter employ-ment protection among older workers on firm’s training incentives. First, we develop a simple model with finite working life-time, endogenous job destruction and firm’s training investment. We show that age-specific employment protection affects firms’ incentives to engage in training only for the unprotected age group (below the threshold-age). This
26
For instance, we regress a first time equation (20) for executives, a second time for intermediaries, a third time for employees and a fourth time for workers. Estimations are then repeated for each education levels and each occupation dummies.
27
The lowest wages are quite dissociated from productivity because of minimum wage. This may explain why the effect of the tax change is not significant for workers among the first quartile of wages.
Table 4: Treatment effect on training participation in large firms: differences among skill groups (1)
Occupation Executives Intermediaries Employees Workers
Interaction term 0.085 0.146 0.108 0.145∗∗
(0.166) (0.12) (0.236) (0.064)
Number of obs. 139 259 76 508
Significance level: ∗∗ : 5%
Note: Only interaction terms αDiD of DiD are reported. Other control variables are: marital status,
distance to retirement, job seniority, nationality, wages quartiles, education levels and sectoral dummies.
Table 5: Treatment effect on training participation in large firms: differences among skill groups (2) Wages quartiles 1st 2nd 3rd 4th Interaction term -0.014 0.271∗∗∗ 0.08 0.155 (0.077) (0.102) (0.127) (0.136) Number of obs. 258 251 256 217 Significance levels: ∗: 10% ∗∗: 5%
Note: Only interaction terms αDiD of DiD are reported. Other control variables are: marital status,
distance to retirement, job seniority, nationality, education levels and sectoral and occupation dummies.
Table 6: Treatment effect on training participation in large firms: differences among skill groups (3)
Education No diploma CAP-BEP Baccalaureate College degree
Interaction term 0.152∗ 0.122 0.145 0.144
(0.085) (0.083) (0.193) (0.192)
Number of obs. 328 443 92 119
Significance level: ∗: 10%
Note: Only interaction terms αDiD of DiD are reported. Other control variables are: marital status,
comes from a complementarity effect between training and job destruction. Since the ex-pected separation cost is higher, firms have strong incentives to invest in training to protect matches against bad productivity shocks. However, we argue that the complementarity effect matters only if the job is likely to be hit by an idiosyncratic shock at the next period. Consequently, the effect of age-specific employment protection on firms’ training incentives strongly depends on the persistence of shocks. If there is no persistence, the lay-off tax unambiguously increases the training incidence of workers below the threshold-age. Conversely, in the event of persistent productivity shocks, this effect is no longer clearly stated and may depend on the initial productivity of the job. If the job is highly productive and therefore robust to ageing even without investment in training, stricter employment protection on older workers does not affect firms’ incentives to engage in training.
We confront these theoretical predictions to French data, exploiting a change in the Delalande tax schedule in 1999 that concerns only firms employing 50 workers or more. We implement a conditional difference-in-difference estimator to remove selection bias into treatment on observables, individual specific effect constant over time and macro effects common to both groups. We find that the increase in the Delalande tax for large firms significantly raised the access rate to employer-provided training of treated workers aged 45 to 49 by 11.5 points of percentage. Further, a skill-decomposition of this effect shows that the 1999 reform only had a positive and significant effect on the training rate of less productive workers. According to our theoretical findings, this could result from the persistence of shocks.
As shown by Picchio and van Ours (2011), a better access to on-the-job training has an effect on the employability of workers, even for older workers. Therefore, the authors suggest to introduce age-specific subsidies or layoff taxes to stimulate job training and to retain the employability of older workers. Nevertheless, our results show that specific employment protection does not lead to increase firms’ incentives to engage in older work-ers’ training due to their shorter distance to retirement. Therefore, looking at the effect of age-specific training subsidies on firm-provided training to older workers could be an interesting issue for future work.
Further, beyond older workers, it is also an important concern for policy makers to worry about the employability of low-skilled workers. In this respect, we have shown that age-specific firing taxes led firms to direct their training effort on less productive workers just below the threshold-age of the tax. Alternatively, it could be worth comparing this positive effect with the impact of training subsidies on firm’s incentives to train, decomposing by skill level of workers. We could expect that such subsidies would be used for workers who already have a strong labor market position, which would be of limited interest.
References
Aeberhardt R., Givord P., and Marbot C. 2011. “Minimum wage and wage inequality in France: An unconditional quantile regresion approach.” Forthcoming in Documents de Travail de la DESE-Working Papers of the DESE.
Bassanini A., Booth A., Brunello G., De Paola M., and Leuven E. 2007. In Workplace training in Europe, edited by Wasmer E. (eds) Education in Brunello G., Garibaldi P. and Training in Europe. Oxford University Press.
Behaghel L., Crépon B., and Sédillot B. 2008. “The perverse effects of partial employement protection reform: The case of French older workers.” Journal of Public Economics 92 (3-4): 696–721.
Belot M., Boone J., and van Ours J. 2007. “Welfare-improving employment protection.” Economica, no. 295.
Blundell R., and Costa Dias M. 2000. “Evaluation methods for non-experimental data.” Fiscal Studies 21 (4): 427–468.
Blundell R., Costa Dias M., Meghir C., and Van Reenen J. 2004. “Evaluating the Employment Impact of a Mandatory Job Search Program.” Journal of the European Economic Association 2 (4): 569–606.
Chéron A., Hairault J.-O., and Langot F. 2007, February. “Job creation and job destruc-tion over the life cycle: The older workers in the spotlight.” Iza discussion papers 2597, Institute for the Study of Labor (IZA).
Chéron A., Hairault J.-O., and Langot F. 2011. “Age-dependent employment protection.” Forthcoming in Economic Journal.
Chéron A., and Rouland B. 2011. “Inefficient Job Destructions and Training with Holdup.” forthcoming in Labour: Review of labour economics and industrial relations.
Chéron A., Rouland B., and Wolff F.-C. 2008. “Returns to firm-provided training in France: Evidence on mobility and wages.” Working Paper.
Hairault J.-O., Langot F., and Sopraseuth T. 2010. “Distance to retirement and older workers’ employment: The case for delaying the retirement age.” Journal of the European Economic Association 8 (5): 1034–1076.
Heckman J., Ichimura H., and Todd P. 1998. “Matching as an econometric evaluation estimator.” Review of Economic Studies 65 (2): 261–294.
Khaskhoussi T., and Langot F. 2008. “La proximité de l’âge de la retraite. Quels effets sur l’accumulation du capital humain et sur la recherche d’emploi?” Revue Économique 59 (3): 641–652.
Kugler A., and Pica G. 2008. “Effects of employment protection on job and workers flows: Evidence from the 1990 Italian reform.” Labour Economics 15 (1): 78–95.
Lechthaler W. 2009. “The interaction of firing costs and firm training.” Empirica 36 (3): 331–350.
Montizaan R., Cörvers F., and De Grip A. 2010. “The effects of pension rights and retirement age on training participation: Evidence from a natural experiment.” Labour Economics 17 (1): 240–247.
Picchio M., and van Ours J. C. 2011, Mar. “Retaining through Training: Even for Older Workers.” Iza discussion papers 5591.
Rosenbaum P., and Rubin D. 1983. “The central role of the propensity score in observa-tional studies for causal effects.” Biometrika 70:41–55.
Schnalzenberger M., and Winter-Ebmer R. 2009. “Layoff tax and employment of the elderly.” Labour Economics 16 (6): 618–624.
Smith J., and Todd P. 2005. “Does matching overcome LaLonde’s critique of nonexperi-mental estimators?” Journal of Econometrics 125 (1-2): 305–353.
Young D. 2003. “Employment Protection Legislation: its economic impact and the case for reform.” Economic paper 186, European Commission Directorate-General for Economic and Financial Affairs.
Table 7: Description of the sample, before and after the reform (in shares)
Pre-reform Post-reform
Large firms Small firms Large firms Small firms
Training rate 0.208 0.083 0.329 0.119 Age 45-49 0.565 0.501 0.455 0.413 50-54 0.435 0.499 0.545 0.587 Marital status In couple 0.894 0.878 0.906 0.864 Living alone 0.106 0.122 0.094 0.136 Nationality French 0.969 0.956 0.969 0.956 Others 0.031 0.044 0.031 0.044 Education No diploma 0.368 0.377 0.368 0.377 CAP-BEP 0.405 0.446 0.405 0.446 Baccalaureate 0.092 0.078 0.092 0.078 College degree 0.135 0.100 0.135 0.100 Distance to retirement 5-10 years 0.316 0.377 0.404 0.479 10-15 years 0.524 0.51 0.565 0.493
More than 15 years 0.16 0.113 0.031 0.028
Job seniority
Less than 5 years 0.114 0.388 0.100 0.360
6-10 years 0.111 0.172 0.114 0.191
11-20 years 0.202 0.186 0.189 0.197
More than 20 years 0.573 0.255 0.595 0.249
Existence of a company training plan Yes 0.736 0.271 0.736 0.271 No 0.264 0.729 0.264 0.729 Occupation Executives 0.175 0.133 0.180 0.144 Intermediary 0.274 0.258 0.279 0.238 Employees 0.078 0.064 0.078 0.058 Workers 0.473 0.546 0.463 0.560 Sector Industry 0.590 0.263 0.595 0.269 Building 0.059 0.197 0.061 0.197 Services 0.351 0.540 0.344 0.535 Type of job Full-time 0.978 0.967 0.978 0.970 Part-time 0.022 0.033 0.022 0.030
Monthly net wage 1786.9 1500.9 1807.9 1500.4
Number of observations 639 361 639 361
Table 8: Differences in means of covariates between the treated and the control group 1998 1999 In couple 0.015 0.042∗∗ (0.021) (0.020) Distance to retirement 5-10 years -0.061∗ -0.075∗∗ (0.031) (0.033) 10-15 years 0.015 0.072∗∗ (0.033) (0.033)
More than 15 years 0.046∗∗ 0.004
(0.023) (0.011)
Job seniority
Less than 5 years -0.274∗∗∗ -0.260∗∗∗
(0.026) (0.025)
6-10 years -0.061∗∗∗ -0.077∗∗∗
(0.022) (0.023)
11-20 years 0.016 -0.007
(0.026) (0.026)
More than 20 years 0.318∗∗∗ 0.345∗∗∗
(0.031) (0.031) Training plan 0.464∗∗∗ 0.464∗∗∗ (0.029) (0.029) Occupation Executives 0.042∗ 0.036 (0.024) (0.025) Intermediary 0.016 0.04 (0.029) (0.029) Employees 0.015 0.020 (0.017) (0.017) Workers -0.073∗∗∗ -0.096∗∗∗ (0.033) (0.033) Sector Industry 0.327∗∗∗ 0.326∗∗∗ (0.031) (0.031) Building -0.137∗∗∗ -0.136∗∗∗ (0.021) (0.020) Services -0.190∗∗∗ -0.190∗∗∗ (0.032) (0.032) Wages quartiles 1st quartile -0.174∗∗∗ -0.162∗∗∗ (0.028) (0.028) 2nd quartile -0.015 -0.024 (0.028) (0.028) 3rd quartile 0.093∗∗∗ 0.092∗∗∗ (0.028) (0.029) 4th quartile 0.096∗∗∗ 0.094∗∗∗ (0.028) (0.028) Significance levels: ∗: 10% ∗∗: 5% ∗∗∗: 1%
Table 9: Estimation of the propensity score for the 45-49 years
Variable Coefficient Std. Err.
In couple -0.076 (0.210)
No French citizenship 0.004 (0.354)
Education (ref:No diploma)
CAP-BEP -0.291∗ (0.154)
Baccalaureate -0.201 (0.253)
College degree -0.077 (0.283)
Distance to retirement (ref: 10-15 years)
More than 15 years 0.141 (0.156)
Job seniority (ref: 5 years or less)
6-10 years 0.15 (0.21)
11-20 years 0.412∗∗ (0.193)
More than 20 years 0.579∗∗∗ (0.175)
Occupation (ref: workers)
Executives -0.116 (0.291)
Intermediary -0.134 (0.184)
Employees 0.516∗∗ (0.254)
Existence of a training plan 1.032∗∗∗ (0.137)
Sector (ref: building)
Industry 1.062∗∗∗ (0.223)
Services 0.311 (0.221)
Part-time job 0.197 (0.426)
Wage quartiles (ref:1st quartile)
2nd quartile 0.076 (0.196) 3rd quartile 0.188 (0.198) 4th quartile 0.17 (0.246) Intercept -0.963∗ (0.32) Number of observations 542 Pseudo R2 0.256
Source: Labor Force Survey (wave 1998) and Training Survey Significance levels: ∗: 10% ∗∗: 5% ∗∗∗: 1%