HAL Id: hal-02088295
https://hal.archives-ouvertes.fr/hal-02088295
Submitted on 9 Oct 2020HAL is a multi-disciplinary open access archive for the deposit and dissemination of sci-entific research documents, whether they are pub-lished or not. The documents may come from teaching and research institutions in France or abroad, or from public or private research centers.
L’archive ouverte pluridisciplinaire HAL, est destinée au dépôt et à la diffusion de documents scientifiques de niveau recherche, publiés ou non, émanant des établissements d’enseignement et de recherche français ou étrangers, des laboratoires publics ou privés.
Role of cyclic and pseudo-cyclic electron transport in
response to dynamic light changes in Physcomitrella
patens
Mattia Storti, Alessandro Alboresi, Caterina Gerotto, Eva-Mari Aro, Giovanni
Finazzi, Tomas Morosinotto
To cite this version:
Mattia Storti, Alessandro Alboresi, Caterina Gerotto, Eva-Mari Aro, Giovanni Finazzi, et al.. Role of cyclic and pseudo-cyclic electron transport in response to dynamic light changes in Physcomitrella patens. Plant, Cell and Environment, 2019, 42 (5), pp.1590-1602. �10.1111/pce.13493�. �hal-02088295�
ROLE OF CYCLIC AND PSEUDOCYCLIC ELECTRON TRANSPORT IN MOSS PHYSCOMITRELLA PATENS RESPONSE TO LIGHT DYNAMICS
Mattia Storti1, Alessandro Alboresi1, Caterina Gerotto2, Eva-Mari Aro2, Giovanni Finazzi3 and Tomas Morosinotto1,*
1 Dept. of Biology, University of Padova, 35121 Padova, Italy;
2 Dept. of Biochemistry, Molecular Plant Biology, University of Turku, FI-20014 Turku, Finland 3 Laboratoire de Physiologie Cellulaire et Végétale, UMR 5168, Centre National de la Recherche Scientifique (CNRS), Commissariat à l'Energie Atomique et aux Energies Alternatives (CEA), Université Grenoble Alpes, Institut National Recherche Agronomique (INRA), Institut de Recherche en Sciences et Technologies pour le Vivant (iRTSV), CEA Grenoble, F-38054 Grenoble cedex 9, France
* Address correspondence to: Tomas Morosinotto, Dipartimento di Biologia, Università di Padova, Via Ugo Bassi 58B, 35121 Padova, Italy. Tel. +390498277484, Fax. +390498276300, Email: [email protected]
Abstract
Photosynthetic organisms support cell metabolism by harvesting sunlight and drive electron transport chain at the level of thylakoid membranes. Excitation energy and electrons flow in the photosynthetic apparatus is continuously modulated in response to dynamic environmental conditions. Alternative electron flow around photosystem I plays a seminal role in this regulation contributing to photo-protection by mitigating over-reduction of the electron carriers.
Different pathways of alternative electron flow coexist in the moss Physcomitrella patens, including cyclic electron flow mediated by the PGRL1/PGR5 complex and pseudo cyclic electron flow mediated by the flavodi-iron proteins FLV. In this work we generated P. patens plants carrying both pgrl1 and flva knock-out (KO) mutations. A comparative analysis of the WT, pgrl1, flva and pgrl1 flva lines suggests that cyclic and pseudo cyclic processes have a synergic role in the regulation of photosynthetic electron transport. However, while both contribute to photosystem I protection from over-reduction by modulating electron flow following changes in environmental conditions, FLV activity is particularly relevant in the first seconds after a light change while PGRL1 has a major role upon sustained strong illumination.
Keywords: Photosynthesis; Bryophyta; Evolution, Molecular; photoprotection; Energy metabolism;
Introduction
Life on earth largely depends on oxygenic photosynthesis which enables plants, algae and cyanobacteria to convert light into chemical energy. Sunlight powers the transfer of electrons from water to NADP+ by the activity of two photosystems (PS), PSII and PSI, generating NADPH and ATP to sustain cell metabolism. Natural environmental conditions are highly variable, and changes in sunlight irradiation drastically affect electron flow. ATP and NADPH consumption rates are also dynamic following the different demands from various metabolic pathways (Külheim, Agren & Jansson 2002; Peltier, Tolleter, Billon & Cournac 2010; Allahverdiyeva, Suorsa, Tikkanen & Aro 2014; Bailleul et al. 2015). Photosynthetic organisms are able to thrive in such a dynamic environment thanks to the evolution of mechanisms that divert/feed electrons from/to linear transport chain to adjust ATP and NADPH (Allen 2002; Shikanai 2016; Shikanai & Yamamoto 2017) production based on metabolic and environmental constraints.
Photosynthetic electron transport is modulated by proton accumulation in the lumen that inhibits the activity of cytochrome b6f (Cyt b6f) (Stiehl & Witt 1969; Rumberg & Siggel 1969; Nishio & Whitmarsh 1993; Finazzi & Rappaport 1998), avoiding PSI over-reduction (Joliot & Johnson 2011). A second mechanism for regulation is cyclic electron flow (CEF) around PSI, in which electrons are redirected from PSI to PQ or Cyt b6f (Arnon & Chain 1975), contributing to proton translocation and ATP synthesis without NADPH formation (Munekage et al. 2002; Peng, Fukao, Fujiwara, Takami & Shikanai 2009; Joliot & Johnson 2011; Shikanai 2014; Peltier, Aro & Shikanai 2016). Cyclic electron activity is important to modulate electron transport under different illumination conditions in different plant species (Yamori, Sakata, Suzuki, Shikanai & Makino 2011; Suorsa et al. 2012; Kono, Noguchi & Terashima 2014; Kukuczka et al. 2014). Two CEF pathways have been identified in plants, one related to the PGR5/ PGRL1 complex (Munekage et al. 2002; DalCorso et al. 2008; Hertle et al. 2013) and the other to a NADH dehydrogenase like complex (Shikanai et al. 1998; Peltier et al. 2016).
Alternative, electron flow can occur via the water-water cycles (i.e. Mehler reaction and Flavodiiron proteins), also known as pseudo-cyclic (PCEF) pathways, because they also contribute to the generation of ΔpH without net NADPH production (Shikanai & Yamamoto 2017). These cycles include Mehler reaction, i.e. electron flow from the PSI Fe-S clusters or from ferredoxin to molecular oxygen (Mehler 1951) and electron transport catalysed by Flavodiiron proteins (known as FLV or FDP, (Helman et al. 2003; Allahverdiyeva et al. 2013; Allahverdiyeva, Isojärvi, Zhang & Aro 2015)) likely using ferredoxin (Jokel, Johnson, Peltier, Aro & Allahverdiyeva 2018) as electron donor. Two Flavodiiron proteins, called FLVA/B in eukaryotes, are especially active in mediating responses to dynamic light conditions, protecting PSI from light stress under fluctuating light conditions
(Allahverdiyeva et al. 2013; Gerotto et al. 2016; Shimakawa et al. 2017; Chaux et al. 2017). FLVs are present in cyanobacteria, green algae, non-vascular plants and gymnosperms, but they were lost by Angiosperms (Ilík et al. 2017). In flowering plants, CEF would replace FLV activity, based on the observation that FLV can complement light sensitivity of angiosperm pgr5 mutants (Yamamoto, Takahashi, Badger & Shikanai 2016; Wada et al. 2017).
In the moss P. patens both CEF and FLV are active and mutants depleted in the latter showed increased cyclic activity, suggesting a compensatory role of the two mechanisms (Gerotto et al. 2016). To test this hypothesis and further investigate the influence of these mechanisms of photosynthetic electron transport in an organism where they are naturally present, we generated P. patens mutants depleted in both FLVA and PRGL1. A comparison of the single and the double mutant showed that the latter had a more severe phenotype, showing that these mechanisms play a synergic role in protecting photosynthetic apparatus from over-reduction. The two mechanisms, however, differ for their activation kinetics. FLV role is more prominent for the first minute after an increase in light intensity while PGRL1 takes longer to be activated but remains effective upon sustained illumination.
Materials and methods
Plant material and treatments
Protonemal tissue of P. patens, Gransden wild-type (WT) strain, and knock-out (KO) lines were grown on minimum PpNO3 media in controlled conditions: 24°C, 16 h light/ 8 h dark on photoperiod and light intensity of 50 µmol photons m-2s-1 (Control Light, CL), and analyzed after 10 days of growth. The growth phenotype of KO lines was evaluated on 2 mm spots of tissue grown at different constant light intensities: 5 (low light, LL), 50 (CL), 150 (medium light, ML) and 500 (high light, HL) µmol photons m-2s-1; and with cycles of 5 min at 25 µmol photons m-2s-1 and 1 min 875 µmol photons m-2s-1 , 9 min 25 µmol photons m-2s-1 and 3 min 525 µmol photons m-2s-1 or 10 min at 50 µmol photons m-2s-1 and 10 min 250 µmol photons m-2s-1. Growth was quantified measuring the colonies integrated density (area * mean intensity) after the background exclusion with the imagej (https://imagej.nih.gov/ij/ ) “threshold colour” plugin. Integrated density was used to quantify instead of “area” because this parameter better takes into account the three dimensional of P. patens colonies (Saavedra et al. 2011), which are affected by the different morphologies due to light regimes used for the growth.
Moss Transformation and mutant selection
The FLVA KO construct (Gerotto et al. 2016) was used to remove FLVA from pgrl1 single KO mutant genetic background (Kukuczka et al. 2014). Transformation was performed as in (Alboresi, Gerotto, Giacometti, Bassi & Morosinotto 2010). After two rounds of selection, in vivo chlorophyll
fluorescence was evaluated with Fluorcam 800 (PSI) to screen resistant lines. Colonies which differs in fluorescence tracks respect to background were homogenized using 3 mm zirconium glass beads (Sigma-Aldrich) and genomic DNA (gDNA) was isolated with rapid extraction protocol as in (Edwards, Johnstone & Thompson 1991) with minor modification. gDNA was then used to confirm insertion by PCR as in (Gerotto et al. 2016). RNA was afterwards purified with Tri Reagent (Sigma Aldrich) and used as template for cDNA synthesis with RevertAid Reverse Transcriptase (Thermo Scientific) to verify FLVA and PGRL1 expression.
Thylakoid and Total Protein Extracts
Thylakoids from protonemal tissue were prepared as in (Gerotto, Alboresi, Giacometti, Bassi & Morosinotto 2012). Total extracts were obtained grinding tissues in solubilization buffer (50 mM TRIS pH 6.8, 100 mM DTT, 2% SDS and 10% glycerol). For immunoblotting analysis, following SDS-PAGE, samples were loaded at the same equivalent amount of chlorophylls and proteins were transferred to nitro-cellulose membranes (Pall Corporation) and detected with alkaline phosphatase conjugated antibody after hybridization with specific primary antibodies (anti-PsaD, Agrisera, catalog number AS09 461; anti-Cyt f, Agrisera, catalog number AS06 119; anti-γ-ATPase, Agrisera, catalog number AS08 312 ; custom-made anti- PGR5, anti-FLVA and anti-FLVB (Gerotto et al. 2016); anti-D2, in house polyclonal antibodies).
Spectroscopic measurements
In vivo chlorophyll fluorescence and P700 absorption signal were monitored simultaneously at room temperature with a Dual-PAM-100 fluorometer (Walz, Germany) in protonemal tissues grown for 10 days in PpNO3 medium and CL condition or in a 10 days plant treated for the last 5 days in a different light condition. Before measurements, plants were dark-acclimated for 40 minutes. For induction/recovery kinetics actinic constant light was set to 540, 170 or 50 μmol photons m-2s-1. Fluctuating light responses were evaluated repeating 5 cycles of 3 min 540 μmol photons m-2s-1, 9 min 26 μmol photons m-2s-1.
PSII and PSI parameters were calculated as following: Fv/Fm as (Fm-Fo)/Fm, Y(II) as (Fm'-F)/Fm', relative qL as qL = (Fm'-F)/(Fm'-Fo') x Fo'/F, NPQ as (Fm-Fm’)/ Fm’, YI as 1 - Y(ND) - Y(NA), Y(NA) as (Pm-Pm')/Pm , Y(ND) as (1 - P700 red), where Fm and Fo represent the maximum and minimum fluoresce yields ((Maxwell & Johnson 2000)), while Pm and Pm’ represent the P700 signals recorded just before (P) then briefly after onset of a saturating pulse (Pm')(Klughammer & Schreiber 1994).
Spectroscopic analysis on WT, flva KO and pgrl1 KO and flva pgrl1 KO lines was performed in vivo on 10-day old intact tissues using a JTS-10 spectrophotometer (Biologic). Relative amount of functional photosynthetic complexes and electron transport rates were evaluated measuring the
Electrochromic Shift (ECS) spectral change on buffer infiltrated plants (HEPES 20mM pH 7.5, KCl 10mM) in presence and absence of 3-(3,4-dichlorophenyl)-1,1-dimethylurea (DCMU 20µM) and hydroxylamine (HA, 4 mM) as in (Bailleul, Cardol, Breyton & Finazzi 2010; Gerotto et al. 2016). Proton motive force (pmf) was evaluated following ECS relaxation kinetics for 20s after actinic light switch-off, gH+ was evaluated by the same kinetics calculating the half relaxation time t1/2 of ECS. P700+ absorption kinetics were measured from the absorption at 705 nm (ΔOD705), following the re-reduction after actinic light switch off. For light treated measures, plants were illuminated for 3 minutes at 940 μmol photons m-2s-1 before actinic light switch off and recording of re-reduction kinetics. Dark adapted re-reduction kinetics were measured on plant acclimated for 10 minutes in the dark, following a 5 seconds light pulse at 940 μmol photons m-2s-1 not sufficient to reach the photosynthetic steady state. Fraction of oxidized P700 was calculated by normalizing the maximum P700+ by the by the maximum P700+ of the same plants infiltrated with DBIMB 150 µM. P700 kinetic rate was estimated by relaxation time t1/2 of P700+ reduction in the dark. Cyt f absorption was measured with the same mode describe for P700+, with an interference filter at 554 nm. In this case 546 and 573 nm were used as background and removed to 554 signal (Finazzi et al. 1997). Oxidized Cyt f and Cyt f kinetic rate were calculated as for P700 measurements.
To assess the existence of restricted diffusion domains, we compared the theoretical equilibrium constants between PSI and its electron donor (Kth) with the experimental one (Kexp), following previous approaches in plants. Kth was estimated based on the redox potentials of Cyt f and of P700 in a range between 60 and 300 s. To evaluate Kexp the following equation was used to relate redox changes of P700 and of Cyt f in an “equilibration plot” (Fig. 6C, D) (Flori et al. 2017).
𝐾𝑒𝑥𝑝= [𝑐𝑦𝑡 𝑓+][𝑃700]
[𝑐𝑦𝑡 𝑓][𝑃700+] [1]
where [cytf], [cytf+], [P700] and [P700+] represent the concentration, of the oxidized and reduced form of the cyt f and P700 pools.
From equation [1] the relationship between the relative amount of oxidized P700 and of cyt f can be derived as: ) 1 .( 1 . exp exp K x x K y , [2] with 𝑦 = 𝑐𝑦𝑡 𝑓+ 𝑐𝑦𝑡 𝑓+𝑐𝑦𝑡𝑓 + [3] and 𝑥 = 𝑃700+ 𝑃700++𝑃700 [4] Results
Double flva pgrl1 KO mutants of P. patens were generated using homologous recombination to disrupt the FLVA gene (Gerotto et al. 2016) in a pgrl1 KO background (Kukuczka et al. 2014) (Figure 1 and Supplementary Figure S1). Results from two independent lines are reported but more than 10 clones with an insertion in the expected target locus were isolated. FLVA expression was lost in flva pgrl1 KO mutants as shown by RT-PCR (Figure 1A) and western blotting analysis confirmed the absence of FLVA protein accumulation (Figure 1B). We also observed an impairment of FLVB protein accumulation in the absence of FLVA, consistent with previous suggestions that FLVA and B form an hetero-tetramer in plants (Yamamoto et al. 2016; Wada et al. 2017). Immunoblot analysis also showed that PGR5 was depleted in pgrl1 KO plants (Figure 1B), as observed in both green algae and Angiosperms (DalCorso et al. 2008; Jokel et al. 2018). The flva pgrl1 KO plants grown under control conditions showed no major alteration of the photosynthetic apparatus composition as compared to WT as assessed by the similar accumulation of Cyt f, γ-ATPase, PSII (D2 antibody) and of PSI (PSAD antibody, Figure 1B) and by the indistinguishable pigment content (Table S1). This finding is in agreement with previous observations in both pgrl1 and flva single KO lines (Kukuczka et al. 2014; Gerotto et al. 2016).
FLVA and PGRL1 have a synergic effect on P. patens growth under different light regimes.
The role of FLV and PGRL1 in response to light dynamics was assessed by exposing WT, flva KO, pgrl1 KO and double flva pgrl1 KO plants to different illumination regimes. Plants were first grown for 10 days in control conditions (CL, 50 µmol photons m-2 s-1) and then moved to constant light of different intensity (CL; ML, 150 µmol photons m-2 s-1; HL, 500 µmol photons m-2 s-1) for 21 days. Some plants were instead exposed to fluctuating light regimes, where cycles of saturating illumination (875, 525 or 250 µmol photons m-2 s-1) and limiting light (25 or 50 µmol photons m-2 s-1) were repeated during the day, as shown in Figure S2. In these experiments, the duration and intensity of the saturating light were chosen to maintain the total number of photons equivalent to a constant illumination of 150 µmol photons m-2 s-1 (Figure S2), i.e. the same as in the ML conditions, while exposing plants to dynamic light changes.
No significant differences in growth were observed between WT and mutant lines in CL conditions. However, clear differences emerged in other illumination regimes (Figure 2; Figure S3). pgrl1 KO showed the strongest growth inhibition under constant HL while flva KO turned out to be particularly sensitive to fluctuating light (Figure 2; Figure S3). flva pgrl1 KO growth was affected in both cases consistent with the phenotype of the parental lines. Under fluctuating illumination, the FLV effect was preponderant and no significant difference between flva KO and flva pgrl1 KO was detectable provided that saturating light exposure was short (1-minute, Figure S3). However, when the duration
of strong illumination was extended to 3 minutes, flva pgrl1 KO plants showed a significantly stronger phenotype than both single KO genotypes, demonstrating a functional redundancy of FLV and PGRL1 in plant photo-protection. Their synergic phenotype was also evident under HL, where growth reduction became larger in flva pgrl1 KO than in pgrl1 KO mutant evidencing an influence of FLV. Overall the growth phenotypes support the hypothesis that FLV and PGRL1 have a partially overlapping role in modulating plant growth.
Consequences of different light regimes on photosynthetic activity was assessed by measuring the PSII maximum quantum yield (Figure 3A, Figure S3 and S4) and the active PSI/PSII ratio (Figure 3B), by measuring chlorophyll fluorescence and the amplitude of the electrochromic shift (ECS) signal induced by a single turnover saturating flash (Bailleul et al. 2010), respectively. The PSI/PSII ratios was largely reduced especially in HL and FL, indicating that the absence of PGRL1 and FLV strongly affects the content of active PSI. Fluorescence data also reveal a reduction of PSII quantum yield. This suggest that PSII activity was also affected to some extent, although an indirect role due to the alteration in PSI content (e.g. due to the overreduction of PSII acceptors, see below) cannot be ruled out (Tikkanen, Rantala, Grieco & Aro 2017)..
Functional investigation of the PGRL1 and FLV synergy
The influence of FLV and PGRL1 on photosynthetic activity was further investigated in vivo. Fluorescence parameters showed that PSII was oversaturated in the light in the absence of FLV and induction of photo-protective responses (NPQ) was slower (Figure S5). This phenomenon was essentially PGRL1 insensitive, flva pgrl1 KO plants behaving as the single flva KO in terms of NPQ induction and PSII efficiency.
The effects on PSI were instead much larger in both flva and flva pgrl1 KO, which showed a lower YI than WT and pgrl1 upon exposition to saturating light (Figure 4A). Such a reduction in YI can be due to a limitation from either the donor or acceptor side and the two cases can be distinguished in vivo by applying saturating light flashes to induce P700 oxidation followed by its reduction (Tikkanen, Rantala & Aro 2015). As shown in Figure 4B-C, the PSI efficiency under saturating illumination in WT plants is mainly limited by the donor side, i.e. by electrons transported from PSII via Cyt b6f. pgrl1 KO plants behaved in a similar way while flva and flva pgrl1 KO showed a strong acceptor side limitation. flva KO plants however quickly recovered and after 2 minutes of illumination they were indistinguishable from the WT while in flva pgrl1 KO PSI remained strongly limited at the acceptor side. This finding suggests that FLVA is seminal to avoid acceptor side limitation in WT plants after an increase in illumination and that PGRL1 is necessary to recover from this limitation in the absence of FLVA (Figure 4B). Overall, these measurements demonstrated a functional synergy
between FLV and PGR5/PGRL1 pathways in maintaining PSI acceptor side oxidised upon illumination changes.
The acceptor side limitation observed in flva and flva pgrl1 KO was dependent on the light intensity, being less pronounced when illumination was less intense. All genotypes, including flva pgrl1 KO, were able to recover acceptor side limitation to WT levels at 50 µmol photons m-1 s-1 of actinic light suggesting that other mechanisms are active in accepting electrons from PSI but have lower capacity and are not able to sustain the required electron transport to respond to a strong increase in illumination (Figure 4).
To further investigate the effect of flva and pgrl1 KO mutations on PSI activity, we monitored changes in the P700 oxidation state in the light by a different spectrophotometric approach (ΔOD705, Figure S6). WT plants exposed to saturating light showed a largely oxidised P700 and at steady state after 180 seconds of saturating illumination, PSI becoming ≈ 80% oxidised (Figure 5A and S6). The pgrl1 KO plants behaved as WT, while flva plants showed lower levels of PSI oxidation immediately after light was switched on, consistent with their high acceptor side limitation. PSI then was progressively oxidised and after 90 seconds of illumination reaching WT oxidation levels at steady state. Interestingly, no such recovery could be observed in flva pgrl1 KO where P700 remained highly reduced even in the presence of saturating light, showing a strong and stable acceptor side limitation. These results clearly demonstrated that in the absence of both FLV and PGRL1, residual mechanisms for PSI re-oxidation are unable to keep P700 oxidized under saturating illumination, consistently with results from YI.
Similar kinetic measurements were performed to assess the activity of Cyt b6f, monitoring Cyt f oxidation state from its differential absorption signal at 554 nm (minus a baseline, see methods) in dark-adapted plants and plants light-treated for 3 minutes (Figure S7). Cyt b6f kinetics in flva pgrl1 KO plants were faster than in WT and both single mutants (Figure S7; Figure 6A). As shown in figure 6A, flva pgrl1 KO kinetics are significantly different from the other genotypes since P700 and Cyt b6f have comparable kinetics while in all other genotypes the reduction rate of the former is much faster. Immunoblot analysis showed that these differences in electron transport capacity cannot be explained by an altered accumulation of Cyt b6f in flva pgrl1 KO (Figure 1) and it should be attributed to differences in regulation at the level of electron transport. To further explore these differences, we studied redox equilibration between PSI and the cytochrome b6f complex. This was done by assessing the relationship between oxidized P700 and oxidized f-type cytochromes (cyt f+) during dark re-reduction after illumination in both dark-adapted and light–treated plants (Figure 6 C and D, respectively). We observed that conditions where P700+ reduction was slow resulted in impaired redox equilibration between PSI and its electrons. This is indicated by the absence of correlation
between the theoretical equilibrium constant between cytochrome f and P700, calculated fromthe redox potentials of the two redox cofactors (Kirchhoff, Schöttler, Maurer & Weis 2004), and the experimental one, evaluated by the “equilibration plot” displayed in Figure 6 (C and D). Higher rates of P700+ reduction resulted in almost perfect redox equilibration between the two complexes, in agreement with previous results in plants (Kirchhoff et al. 2011). Overall, these results suggest that limitation of electron flow at the PSI acceptor side prevents corrects equilibration of electrons between the two complexes.
Plants maintain steady state proton motive force despite alteration in flva- and pgrl1-dependent electron transport activities
Electron flow generates a proton motive force (pmf), which is required for the synthesis of ATP and, via its ΔpH component, affects photosynthesis by inducing NPQ and lowering the electron transport activity of Cyt b6f that can be monitored exploiting the ECS signal. All genotypes showed the same ability to generate a transmembrane potential with ECS curves also showing similar kinetics (Figure 7A). Proton conductivity after steady state saturating illumination (180 seconds) is also indistinguishable between the different genotypes, confirming that plants have similar capacity of generating pmf and using this to synthetize ATP (Figure 7B).
Cumulative effects of fluctuating light
Since mutants showed a strong growth phenotype under fluctuating light conditions, we also measured PSI and PSII yield under conditions where plants were exposed to short-term fluctuating light, alternating 3 minutes of saturating light to 9 minutes of limiting illumination. As shown in figure 8, the first high-light treatment has very similar effect on flva and flva pgrl1 KO with an initial lower YI that recovered after 2 minutes, as previously observed. The repetitions of strong illumination treatments, however, showed an additive effect with PSI efficiency that did not recover under limiting light phases as in WT and pgrl1 KO. Decreases in PSI efficiency were long-lasting, and YI did not recover even by applying a longer dark treatment at the end of the measurement.
The observed reduction in YI was due to acceptor side limitation, which appeared during high light exposure and in flva pgrl1 KO did not recover during the 9 minutes of dim illumination. Consequently, the following high light treatments had an even larger effect with a consequent increase of severity in acceptor side limitation at each cycle of limiting/saturating illumination. As observed above PSII parameters Y(II), 1-qL and NPQ were highly similar for all genotypes upon exposition to strong light treatment (Figure 8D, E and F). Interestingly the repetition of strong illumination in a
fluctuating light regime also affects PSII parameters with a reduction of YII in flva pgrl1 KO accompanied by an over-reduction of PQ redox state, as evidenced by the 1-qL parameter.
Discussion
Cyclic and pseudo-cyclic electron transport are active in synergy to protect PSI from over-reduction Regulation of electron transport in photosynthetic organisms is seminal to maintain the balance between light availability and metabolic demands in a highly dynamic environment. Multiple mechanisms capable to divert/feed electrons from/to linear transport chain have been identified such as cyclic electron flow around PSI and pseudo-cyclic pathways (Shikanai 2016; Shikanai & Yamamoto 2017). Mechanisms for regulation of electron transport were demonstrated to play a major physiological role but they are not all conserved and are unevenly distributed in photosynthetic organisms (Alboresi, Storti & Morosinotto 2018). In this context the study of the moss P. patens is particularly interesting because its genome contains genes encoding proteins involved in both CEF pathways identified in plants plus the FLVs that are active in cyanobacteria, green algae but were lost by Angiosperms (Ilík et al. 2017). Thus, this organism is interesting for in vivo investigation of CEF and PCEF pathways and highlight their functional interaction, also allowing to formulate hypotheses on the reasons why FLV were lost in Angiosperms.
In this work, we investigated the relative contribution of cyclic and pseudo-cyclic electron flow pathways in maintaining a high photosynthetic efficiency by generating a double knock-out mutant of P. patens depleted in both FLVA and PGRL1 (Figure 1) (Kukuczka et al. 2014; Gerotto et al. 2016). In P. patens, as in C. reinhardtii (Jokel et al. 2018) and A. thaliana (DalCorso et al. 2008), the loss of PGRL1 causes the loss of PGR5 attached to thylakoid membranes and therefore the inactivation of the whole PGR5/PGRL1-dependent CEF pathway. Analysis of the double KO evidenced a clear synergy between the activity of cyclic and pseudo-cyclic electron flow, as shown by the finding that the double mutant presents the most severe growth phenotype under different light conditions. Mutant analysis revealed that growth is reduced, mainly because of a damage to PSI, whose levels are strongly reduced in different conditions (Figure 3). The damage to PSI in turn also affects PSII via the PQ pool that is more easily over-reduced (Figure 8E).
Functional measurements help proposing a mechanistic explanation for the moss phenotypes observed in the different genotypes. The flva KO plants suffer strong PSI acceptor side limitation after light is switched on but they recover after a few seconds (Figure 4) (Gerotto et al. 2016). In flva pgrl1 KO, where PGR5/PGRL1-dependent CEF pathway is also inactivated, this acceptor side limitation is instead not recovered, and PSI remains over-reduced. This difference in redox state is highly relevant because an oxidized PSI can withstand exposure to high light intensities, where P700+
is stable thanks to its ability to dissipate energy as heat (Bukhov & Carpentier 2003). On the contrary, over-reduced PSI is instead prone to light damage to Fe-S clusters present on the stromal side of the protein complex (Tiwari et al. 2016). To avoid this phenomenon, other mechanisms capable of accepting electron from PSI are still present and likely active in flva pgrl1 KO plants (e.g. NDH-dependent cyclic electron transport or the Mehler reaction, whose corresponding genes are present in P. patens genome) (Alboresi et al. 2018). However, while the remaining transport pathways can alleviate acceptor side limitation at lower light intensities (Figure 4), they are not able to sustain the elevated electron fluxes that are generated under strong illumination. Similar roles of CEF and FLV have been recently reported in the case of the green freshwater alga Chlamydomonas reinhardtii (Jokel et al. 2018). In this organism, however, CEF activity is mainly active in low oxygen/anaerobic conditions (Finazzi, Furia, Barbagallo & Forti 1999; Takahashi, Clowez, Wollman, Vallon & Rappaport 2013), where FLV are still active, but cannot evacuate alone all the electrons in excess generated by photosynthesis (Burlacot et al. 2018).
While acting in synergy, the CEF mediated by PGRL1/PGR5 and the PCEF catalysed by FLVs show different activation kinetics. Even if flva pgrl1 KO generally showed a stronger phenotype than the single mutants, FLV role is in fact more relevant during the first seconds after abrupt changes in light intensity, while the PRGL1 influence is more evident under prolonged intense illumination (Figure 2, Figure S3).
Despite the observed alterations in the PSI redox state, the flva pgrl1 KO plants still showed the ability to generate a steady state proton motive force similarly to WT plants, suggesting that there are compensating mechanisms to maintain pmf (Figure 7). Photosynthetic efficiency in dim stable illumination is not affected by the mutations and this can be explained considering that, at stationary state, electron transport activity is largely due to linear electron flow from water to NADPH (Kukuczka et al. 2014; Gerotto et al. 2016).
While all WT and mutant plants can generate the same pmf in stationary conditions, they show relevant differences when exposed to stronger illumination. In fact, the reduction in YI has limited consequences under steady dim illumination but has a strong impact when illumination increases and there is the need of alternative mechanisms capable of accepting extra electrons to avoid PSI over-reduction. Even if they play a minor contribution to electron transport in steady state conditions, thus, FLV and PGRL1/PGR5 ensure that there are extra acceptors for PSI available in case of sudden increases in illumination. The lower ceiling of electron transport capacity in flva pgrl1 KO plants, as well as their lack of ability to properly equilibrate electrons between PSI and its electron donors (Figure 6B and C), certainly causes a limited ability of increasing their electron transport upon abrupt
changes in illumination exposing plants to strong risks of over-reduction with a consequent strong impact on growth.
Can alternative electron flows be a disadvantage in some conditions?
P. patens pgrl1 KO mutants can respond well to light fluctuations where they show neither alteration in growth nor significant photodamage (Figure 2-3), at variance with PGR5/PGRL1 mutants in A. thaliana, which are instead highly affected in fluctuating light (Suorsa et al. 2012). To explain this intriguing observation, we propose that the activity of FLVs that can partially compensate for the altered cyclic electron transport, thus mitigating accumulation of electrons at the acceptor side and the consequent damage. This hypothesis is corroborated by results showing that over-expression of heterologous P. patens FLV is able to restore PSI acceptor side limitation phenotypes in Arabidopsis and rice plants depleted for PGR5 (Yamamoto et al. 2016; Wada et al. 2017).
This FLV ability to protect PSI from damage also in flowering plants is puzzling, since FLVs have been lost during Angiosperm evolution (Ilík et al. 2017). Considering the functional overlap observed in this work, CEF is the most likely candidate to protect PSI in the absence of FLV. It is thus possible that upon acquirement of an efficient CEF the selective pressure to keep FLV decreased in Angiosperms ancestors, leading to the gene loss. However, another possibility can be conceived in which FLV were lost because they cause possible disadvantages, e.g. because of energy losses due to the transfer of electrons back to O2 in a futile water-water cycle that are detrimental in limiting light conditions. The results presented here support this possibility. We in fact observe that flva pgrl1 KO showed slower growth (Figure 2B), larger reduction of Fv/Fm and more PSI damage (Figure 3) when compared to pgrl1 KO not only under fluctuating light, but also under constant saturating illumination. This suggests that FLVs are also active in these conditions of steady illumination and consequently it is possible that they have a basal activity even in steady conditions which would be detrimental in limiting light conditions.
Acknowledgements
AA acknowledges the financial support by the University of Padova. TM received financial support by the European Research Council (BIOLEAP grant no. 309485). We thank M. Hippler (Munster, Germany) for providing P. patens pgrl1 ko plants and useful discussion.
References.
Alboresi A., Gerotto C., Giacometti G.M., Bassi R. & Morosinotto T. (2010) Physcomitrella patens mutants affected on heat dissipation clarify the evolution of photoprotection mechanisms upon
land colonization. Proceedings of the National Academy of Sciences of the United States of America 107, 11128–33.
Alboresi A., Storti M. & Morosinotto T. (2018) Balancing protection and efficiency in the regulation of photosynthetic electron transport across plant evolution. The New phytologist. Allahverdiyeva Y., Isojärvi J., Zhang P. & Aro E.-M. (2015) Cyanobacterial Oxygenic
Photosynthesis is Protected by Flavodiiron Proteins. Life 5, 716–743.
Allahverdiyeva Y., Mustila H., Ermakova M., Bersanini L., Richaud P., Ajlani G., … Aro E.-M. (2013) Flavodiiron proteins Flv1 and Flv3 enable cyanobacterial growth and photosynthesis under fluctuating light. Proceedings of the National Academy of Sciences of the United States of America 110, 4111–6.
Allahverdiyeva Y., Suorsa M., Tikkanen M. & Aro E.-M. (2014) Photoprotection of photosystems in fluctuating light intensities. Journal of Experimental Botany.
Allen J. (2002) Photosynthesis of ATP-electrons, proton pumps, rotors, and poise. Cell 110, 273–6. Arnon D.I. & Chain R.K. (1975) Regulation of ferredoxin-catalyzed photosynthetic
phosphorylations. Proceedings of the National Academy of Sciences of the United States of America 72, 4961–5.
Bailleul B., Berne N., Murik O., Petroutsos D., Prihoda J., Tanaka A., … Finazzi G. (2015) Energetic coupling between plastids and mitochondria drives CO2 assimilation in diatoms. Nature 524, 366–9.
Bailleul B., Cardol P., Breyton C. & Finazzi G. (2010) Electrochromism: A useful probe to study algal photosynthesis. Photosynthesis Research 106, 179–189.
Bukhov N.G. & Carpentier R. (2003) Measurement of photochemical quenching of absorbed quanta in photosystem I of intact leaves using simultaneous measurements of absorbance changes at 830 nm and thermal dissipation. Planta 216, 630–8.
Burlacot A., Sawyer A., Cuiné S., Auroy-Tarrago P., Blangy S., Happe T. & Peltier G. (2018) Flavodiiron-Mediated O2 Photoreduction Links H2 Production with CO2 Fixation during the Anaerobic Induction of Photosynthesis. Plant physiology 177, 1639–1649.
Chaux F., Burlacot A., Mekhalfi M., Auroy P., Blangy S., Richaud P. & Peltier G. (2017)
Flavodiiron Proteins Promote Fast and Transient O2Photoreduction inChlamydomonas. Plant physiology 174, 1825–1836.
DalCorso G., Pesaresi P., Masiero S., Aseeva E., Schünemann D., Finazzi G., … Leister D. (2008) A complex containing PGRL1 and PGR5 is involved in the switch between linear and cyclic electron flow in Arabidopsis. Cell 132, 273–85.
plant genomic DNA for PCR analysis. Nucleic acids research 19, 1349.
Finazzi G., Büschlen S., de Vitry C., Rappaport F., Joliot P. & Wollman F.A. (1997) Function-directed mutagenesis of the cytochrome b6f complex in Chlamydomonas reinhardtii:
involvement of the cd loop of cytochrome b6 in quinol binding to the Q(o) site. Biochemistry
36, 2867–74.
Finazzi G., Furia A., Barbagallo R.P. & Forti G. (1999) State transitions, cyclic and linear electron transport and photophosphorylation in Chlamydomonas reinhardtii. Biochimica et biophysica acta 1413, 117–29.
Finazzi G. & Rappaport F. (1998) In vivo characterization of the electrochemical proton gradient generated in darkness in green algae and its kinetic effects on cytochrome b6f turnover. Biochemistry 37, 9999–10005.
Flori S., Jouneau P.-H., Bailleul B., Gallet B., Estrozi L.F., Moriscot C., … Finazzi G. (2017) Plastid thylakoid architecture optimizes photosynthesis in diatoms. Nature communications 8, 15885.
Gerotto C., Alboresi A., Giacometti G.M., Bassi R. & Morosinotto T. (2012) Coexistence of plant and algal energy dissipation mechanisms in the moss Physcomitrella patens. The New
phytologist 196, 763–73.
Gerotto C., Alboresi A., Meneghesso A., Jokel M., Suorsa M., Aro E.-M. & Morosinotto T. (2016) Flavodiiron proteins act as safety valve for electrons in Physcomitrella patens. Proceedings of the National Academy of Sciences of the United States of America 113.
Helman Y., Tchernov D., Reinhold L., Shibata M., Ogawa T., Schwarz R., … Kaplan A. (2003) Genes encoding A-type flavoproteins are essential for photoreduction of O2 in cyanobacteria. Current biology : CB 13, 230–5.
Hertle A.P., Blunder T., Wunder T., Pesaresi P., Pribil M., Armbruster U. & Leister D. (2013) PGRL1 is the elusive ferredoxin-plastoquinone reductase in photosynthetic cyclic electron flow. Molecular cell 49, 511–23.
Ilík P., Pavlovič A., Kouřil R., Alboresi A., Morosinotto T., Allahverdiyeva Y., … Shikanai T. (2017) Alternative electron transport mediated by flavodiiron proteins is operational in organisms from cyanobacteria up to gymnosperms. The New phytologist 214, 967–972. Jokel M., Johnson X., Peltier G., Aro E.-M. & Allahverdiyeva Y. (2018) Hunting the main player
enabling Chlamydomonas reinhardtii growth under fluctuating light. The Plant journal : for cell and molecular biology 94, 822–835.
Joliot P. & Johnson G.N. (2011) Regulation of cyclic and linear electron flow in higher plants. Proceedings of the National Academy of Sciences of the United States of America 108, 13317–
22.
Kirchhoff H., Hall C., Wood M., Herbstová M., Tsabari O., Nevo R., … Reich Z. (2011) Dynamic control of protein diffusion within the granal thylakoid lumen. Proceedings of the National Academy of Sciences of the United States of America 108, 20248–53.
Kirchhoff H., Schöttler M.A., Maurer J. & Weis E. (2004) Plastocyanin redox kinetics in spinach chloroplasts: evidence for disequilibrium in the high potential chain. Biochimica et biophysica acta 1659, 63–72.
Klughammer C. & Schreiber U. (1994) An improved method, using saturating light pulses, for the determination of photosystem I quantum yield via P700+-absorbance changes at 830 nm. Planta 192, 261–268.
Kono M., Noguchi K. & Terashima I. (2014) Roles of the cyclic electron flow around PSI (CEF-PSI) and O₂-dependent alternative pathways in regulation of the photosynthetic electron flow in short-term fluctuating light in Arabidopsis thaliana. Plant & cell physiology 55, 990–1004. Kukuczka B., Magneschi L., Petroutsos D., Steinbeck J., Bald T., Powikrowska M., … Hippler M.
(2014) Proton Gradient Regulation5-Like1-Mediated Cyclic Electron Flow Is Crucial for Acclimation to Anoxia and Complementary to Nonphotochemical Quenching in Stress Adaptation. Plant physiology 165, 1604–1617.
Külheim C., Agren J. & Jansson S. (2002) Rapid regulation of light harvesting and plant fitness in the field. Science (New York, N.Y.) 297, 91–3.
Maxwell K. & Johnson G.N. (2000) Chlorophyll fluorescence - A practical guide. Journal of Experimental Botany 51, 659–668.
Mehler A.H. (1951) Studies on reactions of illuminated chloroplasts. Archives of Biochemistry and Biophysics 33, 65–77.
Munekage Y., Hojo M., Meurer J., Endo T., Tasaka M. & Shikanai T. (2002) PGR5 is involved in cyclic electron flow around photosystem I and is essential for photoprotection in Arabidopsis. Cell 110, 361–71.
Nishio J.N. & Whitmarsh J. (1993) Dissipation of the Proton Electrochemical Potential in Intact Chloroplasts (II. The pH Gradient Monitored by Cytochrome f Reduction Kinetics). Plant physiology 101, 89–96.
Peltier G., Aro E.-M. & Shikanai T. (2016) NDH-1 and NDH-2 Plastoquinone Reductases in Oxygenic Photosynthesis. Annual review of plant biology 67, 55–80.
Peltier G., Tolleter D., Billon E. & Cournac L. (2010) Auxiliary electron transport pathways in chloroplasts of microalgae. Photosynthesis Research 106, 19–31.
dehydrogenase requires supercomplex formation with photosystem I via minor LHCI in Arabidopsis. The Plant cell 21, 3623–40.
Rumberg B. & Siggel U. (1969) pH changes in the inner phase of the thylakoids during photosynthesis. Die Naturwissenschaften 56, 130–2.
Saavedra L., Balbi V., Lerche J., Mikami K., Heilmann I. & Sommarin M. (2011) PIPKs are essential for rhizoid elongation and caulonemal cell development in the moss Physcomitrella patens. The Plant Journal 67, 635–647.
Shikanai T. (2014) Central role of cyclic electron transport around photosystem I in the regulation of photosynthesis. Current opinion in biotechnology 26, 25–30.
Shikanai T. (2016) Regulatory network of proton motive force: contribution of cyclic electron transport around photosystem I. Photosynthesis research 129, 253–60.
Shikanai T., Endo T., Hashimoto T., Yamada Y., Asada K. & Yokota A. (1998) Directed disruption of the tobacco ndhB gene impairs cyclic electron flow around photosystem I. Proceedings of the National Academy of Sciences of the United States of America 95, 9705–9.
Shikanai T. & Yamamoto H. (2017) Contribution of Cyclic and Pseudo-cyclic Electron Transport to the Formation of Proton Motive Force in Chloroplasts. Molecular plant 10, 20–29.
Shimakawa G., Ishizaki K., Tsukamoto S., Tanaka M., Sejima T. & Miyake C. (2017) The Liverwort, Marchantia, Drives Alternative Electron Flow Using a Flavodiiron Protein to Protect PSI. Plant physiology 173, 1636–1647.
Stiehl H.H. & Witt H.T. (1969) Quantitative Treatment of the Function of Plastoquinone in Photosynthesis. Zeitschrift für Naturforschung B 24, 1588–1598.
Suorsa M., Järvi S., Grieco M., Nurmi M., Pietrzykowska M., Rantala M., … Aro E.-M. (2012) PROTON GRADIENT REGULATION5 is essential for proper acclimation of Arabidopsis photosystem I to naturally and artificially fluctuating light conditions. The Plant cell 24, 2934– 48.
Takahashi H., Clowez S., Wollman F.-A., Vallon O. & Rappaport F. (2013) Cyclic electron flow is redox-controlled but independent of state transition. Nature communications 4, 1954.
Tikkanen M., Rantala S. & Aro E.-M. (2015) Electron flow from PSII to PSI under high light is controlled by PGR5 but not by PSBS. Frontiers in plant science 6, 521.
Tikkanen M., Rantala S., Grieco M. & Aro E.-M. (2017) Comparative analysis of mutant plants impaired in the main regulatory mechanisms of photosynthetic light reactions - From
biophysical measurements to molecular mechanisms. Plant physiology and biochemistry : PPB
112, 290–301.
Photodamage of iron–sulphur clusters in photosystem I induces non-photochemical energy dissipation. Nature Plants, 16035.
Wada S., Yamamoto H., Suzuki Y., Yamori W., Shikanai T. & Makino A. (2017) Flavodiiron protein substitutes for cyclic electron flow without competing CO2 assimilation. Plant physiology 176, 1509–1518.
Yamamoto H., Takahashi S., Badger M.R. & Shikanai T. (2016) Artificial remodelling of alternative electron flow by flavodiiron proteins in Arabidopsis. Nature plants 2, 16012. Yamori W., Sakata N., Suzuki Y., Shikanai T. & Makino A. (2011) Cyclic electron flow around
photosystem I via chloroplast NAD(P)H dehydrogenase (NDH) complex performs a significant physiological role during photosynthesis and plant growth at low temperature in rice. The Plant journal : for cell and molecular biology 68, 966–76.
Figure legends
Figure 1. Isolation of flva pgrl1 double KO plants. FLVA was knocked out in pgrl1 KO plants using
homologous recombination. After verifying that the resistance cassette was inserted in the expected genomic region (Figure S1), expression of FLVA and PGRL1 was verified by RT-PCR (A) and FLVA, FLVB, Cyt f, γ-ATPase, D2 and PsaD protein accumulation was verified by immunoblot analysis using specific antibodies (B). For flva pgrl1 KO, two representative independent lines are shown. A total extract equivalent to 2.5 μg of Chl (for Cyt f, β-ATPase FLVB, D2 and PsaD) and 5 μg of Chl (for FLVA and PGR5) was loaded for each sample. For WT, 0.5X corresponds to loading half of the extract.
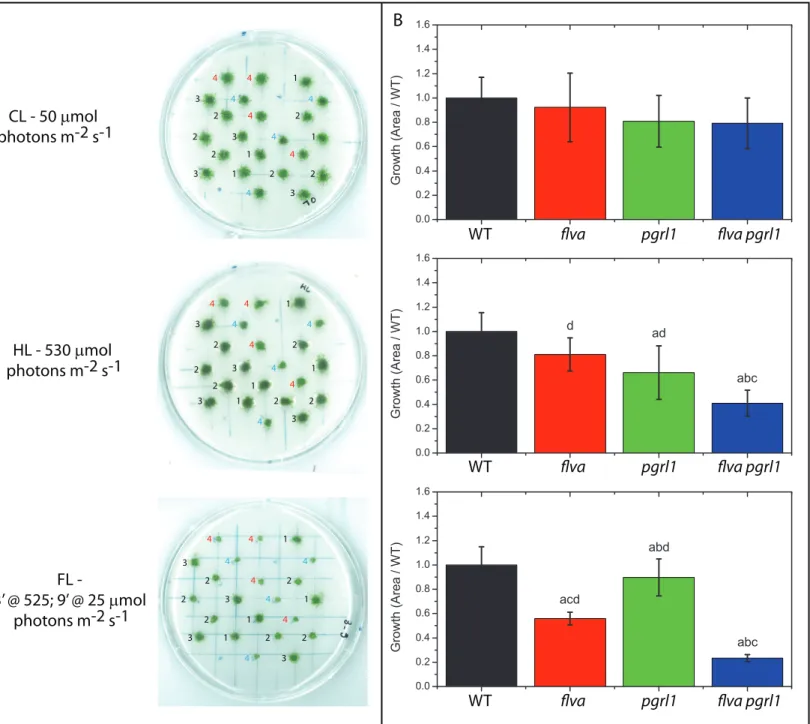
Figure 2. Growth phenotypes of Physcomitrella patens plants. A) Representative pictures of plants
during growth experiments. B) Growth quantification. Plants were grown for 21 days under CL, HL and FL (the case of 3 minutes of intense illumination followed by 9 of low light is shown here). Results from additional conditions are reported in figure S3. Plant position was randomized for each biological replicate (n = 4) but was the same for different light regimes inside the same biological replicate. In panel A, the numbers on the left of each plant indicate the genotypes 1: WT; 2: flva KO; 3: pgrl1 KO; 4: flva pgrl1 KO. In the latter red and blue numbers indicate two independent lines. B) Plant growth quantified from the size of each plant and normalized to the WT. WT, flva, pgrl1 and flva pgrl1 KO are shown respectively in black, red, green and blue. a, b, c and d indicate statistically significant difference from WT, flva, pgrl1 and flva pgrl1 KO respectively. (n = 8-21, p < 0.001).
Figure 3 Effect of growing conditions on maximum PSII efficiency and PSI / PSII ratio.
Measurements were performed on 12-day old plants exposed to the same growth conditions described in figure 2. A) Fv/Fm and B) PSI / PSII. WT, flva, pgrl1 and flva pgrl1 KO are shown respectively in black, red, green and blue. a, b, c and d indicate statistically significant difference from WT, flva, pgrl1 and flva pgrl1 KO respectively (n = 5-10, p < 0.001).
Figure 4. PSI efficiency in flva pgrl1 KO plants. PSI efficiency was evaluated in different plants
using P700+ signal, treating dark adapted plants for 8 minutes by an actinic illumination ((A, D, G) 540, (B, E, H) 175 or (C, F, I) 50 µmol photons m-2 s-1) followed by 10 minutes of dark. A-C) PSI yield (YI). D-F) PSI acceptor side limitation, Y(NA); G-I) PSI donor side limitation Y(ND). WT, flva, pgrl1 and flva pgrl1 are shown respectively as black squares, red circles, green triangles and blue diamonds. Values are expressed as average ± SD of 3-5 independent biological replicates.
Figure 5. Dependence of PSI oxidation state from illumination duration. A) Dark adapted plants
were subjected to saturating constant illumination (940 µmol photons m-2 s-1) for different time intervals (15, 45, 90 or 180 s) before light was switched off. Oxidized fraction is expressed as the ratio between P700+ signals at the end of illumination and the maximal oxidation levels obtained by addition of DCMU and DBIMB (examples in Figure S6). Reported values are average ± SD of at least 4 independent replicates for each time point. B) P700+ reduction kinetics after 180s actinic light exposure in the different genotypes. WT is shown in black, flva KO in red, pgrl1 KO in green and flva pgrl1 in blue. Curves shown are average of 4-6 independent measurements.
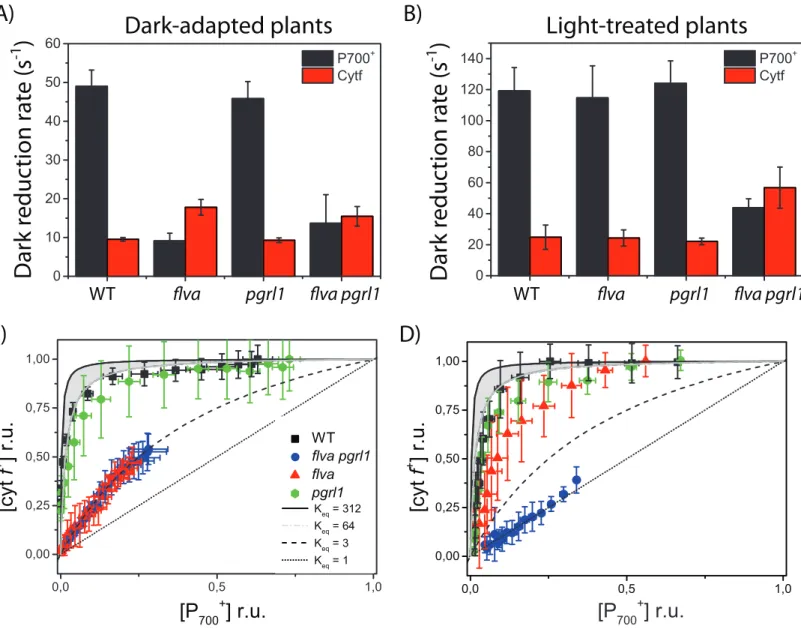
Figure 6. Dark reduction kinetics and equilibrium of P700 and cytochrome f. A-B) half-time of
dark reduction kinetics reported in figure S7. Values for P700 (black bars) and Cyt f (red bars) were obtained from dark-adapted (A) and light-treated (B) protonema cells. C-D) Equilibration plot of cytochrome f and P700 in dark-adapted (C) and light-treated (D) protonema cells. WT is shown in black, flva KO in red, pgrl1 KO in green and flva pgrl1 in blue. The grey area indicates the range for theoretical equilibrium between cytochrome f and P700 based on their redox potential. Reported values are average ± SD of 4-6 independent replicates for each time point.
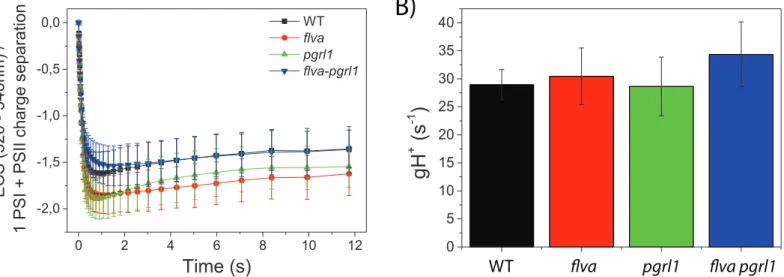
Figure 7. Proton motive force generation. Relaxation of ECS signal in the dark after a saturating
light was switched off was exploited to evaluate plants capacity to generate a proton motive force. A) ECS signal kinetic after light is switched off. B) Proton conductivity (gH+) calculated form the rate of ECS decay after the actinic light was switched off. WT, flva, pgrl1 and flva pgrl1 KO are shown
respectively in black, red, green and blue. Data reported are average ± SD of 6-10 independent replicates.
Figure 8. Effect of short-term fluctuating light treatments on PSI and PSII efficiency. PSI
Efficiency (YI, A), its acceptor (YNA, B) and donor side limitations (YND, C) were monitored together with PSII efficiency parameters (YII (D), PQ redox state (1- qL, E) and NPQ (F)). Plants were exposed to a fluctuating light cycles by alternating 3 minutes of exposition to 525 µmol photons m-2 s-1 and 9 minutes to 25 µmol photons m-2 s-1. After five cycles plants were left in the dark for 15 minutes. WT is shown in black, flva KO line in green, pgrl1 KO line in blue and flva pgrl1 KO in red. Values are expressed as average ± SD of at least 3 replicates.
A)
FLVA
PGRL1
ACT2
B)
FLVB
FLVA
flva pgrl1 KO
PsaD
D2
#2
#1
pgrl1 KO
flva KO
WT
0.5x
WT
1x
pgrl1 KO
flva KO
WT
Cytf
g-ATPase
PGR5
flva pgrl1 KO
#2
#1
Figure 1. Isolation of flva pgrl1 double KO plants. FLVA was knocked out in pgrl1 KO plants using
homologous recombination. After verifying that the resistance cassette was inserted in the
expected genomic region (Figure S1), expression of FLVA and PGRL1 was verified by RT-PCR (A) and FLVA, FLVB, Cyt f, γ-ATPase, D2 and PsaD protein accumulation was verified by immunoblot analysis using specific antibodies (B). For flva pgrl1 KO, two representative independent lines are shown. A total extract equivalent to 2.5 μg of Chl (for Cyt f, β-ATPase FLVB, D2 and PsaD) and 5 μg of Chl (for FLVA and PGR5) was loaded for each sample. For WT, 0.5X corresponds to loading half of the extract.
CL - 50 mmol photons m-2 s-1 HL - 530 mmol photons m-2 s-1 FL - 3’ @ 525; 9’ @ 25 mmol photons m-2 s-1 A B 1 1 1 1 2 2 3 3 3 3 4 4 4 4 4 4 2 2 2 2 4 4 1 1 1 1 2 2 3 3 3 3 4 4 4 4 4 4 2 2 2 2 4 4 1 1 1 1 2 2 3 3 3 3 4 4 4 4 4 4 2 2 2 2 4 4 WT flva pgrl1 flva pgrl1 WT flva pgrl1 flva pgrl1 WT flva pgrl1 flva pgrl1
Figure 2. Growth phenotypes of Physcomitrella patens plants. A) Representative pictures of plants during
growth experiments. B) Growth quantification. Plants were grown for 21 days under CL, HL and FL (the case of 3 minutes of intense illumination followed by 9 of low light is shown here). Results from additional conditions are reported in figure S3. Plant position was randomized for each biological replicate (n = 4) but was the same for different light regimes inside the same biological replicate. In panel A, the numbers on the left of each plant indicate the genotypes 1: WT; 2: flva KO; 3: pgrl1 KO; 4: flva pgrl1 KO. In the latter red and blue numbers indicate two independent lines. B) Plant growth quantified from the size of each plant and normalized to the WT. WT, flva, pgrl1 and flva pgrl1 KO are shown respectively in black, red, green and blue. a, b, c and d indicate statistically significant difference from WT, flva, pgrl1 and flva pgrl1 KO respectively. (n = 8-21, p < 0.001).
d d abc d d abc ac bd ac abc abc cd abd acd bd
A)
B)
Figure 3 Effect of growing conditions on maximum PSII efficiency and PSI / PSII ratio. Measurements were
performed on 12-day old plants exposed to the same growth conditions described in figure 2. A) Fv/Fm and B) PSI / PSII. WT, flva, pgrl1 and flva pgrl1 KO are shown respectively in black, red, green and blue. a, b, c and d indicate statistically significant difference from WT, flva, pgrl1 and flva pgrl1 KO respectively (n = 5-10, p < 0.001).
A B C
D E F
G H I
540 mE 170 mE 50 mE
Figure 4. PSI efficiency in flva pgrl1 KO plants. PSI efficiency was evaluated in different plants using P700+ signal,
treating dark adapted plants for 8 minutes by an actinic illumination ((A, D, G) 540, (B, E, H) 175 or (C, F, I) 50 µmol photons m-2 s-1) followed by 10 minutes of dark. A-C) PSI yield (YI). D-F) PSI acceptor side limitation, Y(NA); G-I) PSI donor side limitation Y(ND). WT, flva, pgrl1 and flva pgrl1 are shown respectively as black squares, red circles, green triangles and blue diamonds. Values are expressed as average ± SD of 3-5 independent biological replicates.
A)
B)
Figure 5. Dependence of PSI oxidation state from illumination duration. A) Dark adapted plants were
subjected to saturating constant illumination (940 µmol photons m-2 s-1) for different time intervals (15, 45, 90 or 180 s) before light was switched off. Oxidized fraction is expressed as the ratio between P700+ signals at the end of illumination and the maximal oxidation levels obtained by addition of DCMU and DBIMB (examples in Figure S6). Reported values are average ± SD of at least 4 independent replicates for each time point. B) P700+ reduction kinetics after 180s actinic light exposure in the different genotypes. WT is shown in black, flva KO in red, pgrl1 KO in green and flva pgrl1 in blue. Curves shown are average of 4-6 independent measurements.
Dar
k r
educ
tion r
a
te (s
-1)
A)
Dark-adapted plants
B)
Light-treated plants
Dar
k r
educ
tion r
a
te (s
-1)
WT flva pgrl1 flva pgrl1 WT flva pgrl1 flva pgrl1
C)
D)
Figure 6. Dark reduction kinetics and equilibrium of P700 and cytochrome f. A-B) half-time of dark reduction
kinetics reported in figure S7. Values for P700 (black bars) and Cyt f (red bars) were obtained from dark-adapted (A) and light-treated (B) protonema cells. C-D) Equilibration plot of cytochrome f and P700 in dark-adapted (C) and light-treated (D) protonema cells. WT is shown in black, flva KO in red, pgrl1 KO in green and flva pgrl1 in blue. The grey area indicates the range for theoretical equilibrium between cytochrome f and P700 based on their redox poten-tial. Reported values are average ± SD of 4-6 independent replicates for each time point.
WT flva pgrl1 flva pgrl1
A)
B)
Figure 7. Proton motive force generation. Relaxation of ECS signal in the dark after a saturating light was switched off was exploited to evaluate plants capacity to generate a proton motive force. A) ECS signal kinetic after light is switched off. B) Proton conductivity (gH+) calculated form the rate of ECS decay after the actinic light was switched off. WT, flva, pgrl1 and flva pgrl1 KO are shown respectively in black, red, green and blue. Data reported are average ± SD of 6-10 independent replicates.
A
B
D
C
E
F
Figure 8. Effect of short-term fluctuating light treatments on PSI and PSII efficiency. PSI Efficiency (YI, A), its
acceptor (YNA, B) and donor side limitations (YND, C) were monitored together with PSII efficiency parameters (YII (D), PQ redox state (1- qL, E) and NPQ (F)). Plants were exposed to a fluctuating light cycles by alternating 3 minu-tes of exposition to 525 µmol photons m-2 s-1 and 9 minuminu-tes to 25 µmol photons m-2 s-1. After five cycles plants were left in the dark for 15 minutes. WT is shown in black, flva KO line in green, pgrl1 KO line in blue and flva pgrl1 KO in red. Values are expressed as average ± SD of at least 3 replicates.