UNIVERSITÉ DE MONTRÉAL
SEISMIC DEFORMATIONS OF TALLER REINFORCED CONCRETE SHEAR WALLS LOCATED IN EASTERN CANADA
ARMIN SADEGHIAN
DÉPARTEMENT DES GÉNIES CIVIL, GÉOLOGIQUE ET DES MINES ÉCOLE POLYTECHNIQUE DE MONTRÉAL
THÈSE PRÉSENTÉE EN VUE DE L’OBTENTION DU DIPLÔME DE PHILSOPIAE DOCTOR
(GÉNIE CIVIL) AVRIL 2018
ÉCOLE POLYTECHNIQUE DE MONTRÉAL
Cette thèse intitulée :
SEISMIC DEFORMATIONS OF TALLER REINFORCED CONCRETE SHEAR WALLS LOCATED IN EASTERN CANADA
présentée par: SADEGHIAN Armin
en vue de l’obtention du diplôme de : Philosophiae Doctor a été dûment acceptée par le jury d’examen constitué de :
M. BOUAANANI Najib, Ph. D., président
Mme KOBOEVIC Sanda, Ph. D., membre et directrice de recherche M. BEN FTIMA Mahdi, Ph. D., membre
DEDICATIONS
To my parents, Ali and Robab
And to Abtin, Maryam and Arash
ACKNOWLEDGEMENTS
I would like to express my earnest gratitude to my supervisor, Dr. Sanda Koboevic, for her support and direction through the course of this research project. I would also like to thank my evaluation committee members Professors Najib Bouaanani and Mahdi Ben Ftima from Polytechnique de Montreal and Professor Dan Palermo from York University for accepting to read and evaluate this dissertation. I would like thank Professor Pierre Léger for his support and appreciate his cooperation for sharing the computer models of his previous researches. I would also like to acknowledge the financial support of the Canadian Seismic Research Network (CSRN).
My gratitude also goes to my friends and the kind personnel at Polytechnique Montreal and specially the staffs of Groupe de Recherche en génie des Structures (GRS) who helped me throughout the period of my project. During the course of this project I had the precious chance to meet wonderful people, some became my lasting friends. I would like to thank all of them for their friendship and support. Special thanks to Poulad Daneshvar, Ali Imanpour, Yassaman Balazadeh, Morteza Dehghani, Sylvain Renaud, Joanie Smith and Fabien Lagier.
Last but not least, I would like to thank my lovely family for their love and support during this part of life journey. My deepest gratitude and appreciation to my parents, Ali and Robab, for their immeasurable love and sacrifices. They worked hard against all difficulties to make life easier for us and let me build my future with their infinite love and support.
RÉSUMÉ
Les systèmes de murs de refend en béton armé font partie des systèmes structuraux les plus couramment utilisés pour résister aux charges sismiques. L'utilisation de murs de refend dans la conception parasismique est répandue en raison de leur rigidité élevée et la facilité de construction. Ce système est encore plus avantageux pour les bâtiments de grande hauteur, car il est plus critique d'offrir un niveau de rigidité acceptable pour de telles structures.
De nombreux codes modernes, y compris les codes canadiens CNBC 2015 et CSA A23.3-14, utilisent une approche basée sur la force pour la conception parasismique des murs de refend. Bien que cette méthode soit relativement simple et ait été utilisée dans la pratique depuis longtemps, elle a ses propres inconvénients. Un inconvénient important est que le niveau de dissipation d'énergie doit être considéré tout au début du processus de conception en anticipant la ductilité du système. Dans cette approche, le niveau de ductilité effectivement mobilisée sous les charges de conception n'est pas vérifié et le système est conçu pour maintenir la capacité minimale pour un niveau présumé de ductilité. Les normes NBCC 2015 et CSA A23.3-14 énoncent des dispositions spécifiques pour la conception parasismique des murs de refend afin de maintenir le niveau présumé de ductilité.
Contrairement à la méthode de conception basée sur la force, la méthode de conception basée sur le déplacement sismique pourrait prédire le niveau de ductilité des murs de refend conçus, dès le début. Selon les approches basées sur le déplacement, dans les régions de sismicité modérée, tel que l'est du Canada, les déplacements maximales des murs de refend de plus grande hauteur sont souvent plus petits que le déplacement au point de début de plasticité, et donc la réponse sismique élastique est indiquée. Une telle prédiction ne concorde pas avec les hypothèses de la méthode basée sur la force qui suppose que la réponse est toujours inélastique.
Bien qu'en théorie les méthodes basées sur le déplacement permettent de prédire le niveau de ductilité, elles ont des difficultés pour prédire les efforts de conception pour les murs de refend à hauteur élevée dans les régions à sismicité modérée. Contrairement à l'ouest du Canada, les tremblements de terre de l'est du Canada ont une magnitude plus faible et sont riches en ondes à hautes fréquences. La combinaison d’une période fondamentale élevée et de l'exposition à des ondes sismiques à haute fréquence amplifie l'impact des modes supérieurs, ce qui complexifie davantage la prédiction de la réponse des murs de refend à hauteur élevée dans l'est du Canada.
Cette recherche examine les problèmes liés à l'utilisation des méthodes basée sur la force et basée sur le déplacement dans la conception parasismique de murs de refend à hauteur élevée dans l'est du Canada, particulièrement en ce qui concerne les déformations et la ductilité aux niveaux local et globale, puis propose des procédures pouvant améliorer la précision de l’estimation de ces paramètres.
Pour atteindre ces objectifs, dans un premier temps, une étude préliminaire a été réalisée sur deux bâtiments de 17 étages avec murs de refend en béton armé, situés dans l'est et l'ouest du Canada. Les murs de cisaillement ont été conçus conformément aux règles de conception basée sur la force (FBD) du NBCC / CSA A23.3 et la méthode actuelle de conception basée sur le déplacement direct (DDBD), et la différence spécifique des prévisions de conception entre l'est et l'ouest du Canada ont été discutés. Les efforts de conception de chaque approche ont été comparés aux résultats de l'analyse de l'histoire temporelle non linéaire (NTHA) pour des ensembles de mouvements au sol avec des contenus fréquentiels différents. Pour le mur de refend dans l'est du Canada, les résultats ont montré une surestimation du facteur de ductilité par la méthode FBD. Néanmoins, l'approche DDBD actuelle a sous-estimé l’effort de cisaillement et les moments fléchissant. La comparaison des résultats de la NTHA dans différents ensembles d'enregistrements de tremblement de terre a démontré que la courbe de déformation des murs de refend est très sensible à la fréquence des mouvements de sol imposés.
Dans les murs de refend en béton armé à rotule plastique unique à la base, la courbure à la base est le paramètre clé de la ductilité locale. Par conséquent, pour avoir de meilleures prédictions du niveau de ductilité, il est nécessaire d'avoir une prédiction adéquate de la ductilité locale. Les méthodes actuelles d'estimation de la courbure à la base, spécialement celles basées sur les prédictions de conception de la méthode DDBD, s'avèrent inexactes pour les murs en béton armé à hauteur élevée dans l'est du Canada. Pour résoudre ce problème, la courbure à la base des murs de cisaillement dans cette région doit être estimée. Une étude paramétrique a été réalisée sur plus de cent murs de refend afin d'identifier les paramètres ayant le plus grand impact sur le déplacement au sommet et la courbure à la base des murs de cisaillement dans l'est du Canada. Pour cette étude paramétrique, les NTHA ont été effectuées sur OpenSees sous des mouvements de sol simulés sélectionnés. Les résultats de l'étude paramétrique ont été utilisés pour déterminer une équation empirique permettant d'estimer la courbure à la base des murs de refend. La courbure de base prédite peut être utilisée pour calculer la ductilité locale des murs de cisaillement. La ductilité locale
pourrait être utilisée comme indicateur pour évaluer le niveau de réponse inélastique. Une version modifiée de la méthode DDBD utilisant la ductilité locale estimée dans le processus de conception a été proposée. Des facteurs analytiques d'amplification de cisaillement élastique dus aux modes supérieurs ont été suggérés pour répondre à la sous-estimation observée de des efforts de conception de la méthode DDBD. Des exemples de murs de cisaillement conçus selon l'approche proposée ont été comparés avec les résultats de la méthode NTHA et ont montré des résultats améliorés.
ABSTRACT
Reinforced concrete shear wall systems are one of the most commonly used structural system to resist seismic loads. The use of shear walls in seismic design is widespread because of their relatively high stiffness and their ease of construction. Shear wall system is even more beneficial for taller buildings because providing an appropriate level of stiffness for such structures is critical. Many modern design provisions including National Building Code of Canada (NBCC 2015) and CSA A23.3-14 reinforced concrete design standard use force-based design approach for seismic design of shear walls. Although force-based method is fairly simple and have been used in practice for a long time, it has its own drawbacks. One important drawback of the force-based method is that the level of energy dissipation must be considered at the beginning of design process by anticipating the ductility of the system. In this approach, the actual level of mobilised ductility is not verified, and the system is designed to uphold the minimum capacity for a presumed level of ductility. In NBCC 2015 and CSA A23.3-14 there are specific provisions for seismic design of shear walls to maintain the presumed level of ductility.
Contrary to force-based design method, seismic displacement-based design methods permit to determine the level of ductility for the designed shear walls upfront. In regions of moderate seismicity, such as eastern Canada, the displacement-based approaches indicate that the maximum displacement demand for taller shear wall would be smaller than the yield displacement and thus, the common displacement-based methods would predict an elastic response. Such prediction is not in line with force-based method assumptions that the inelastic response is always achieved. Although in theory the displacement-based methods could predict the level of ductility, they have difficulties to accurately predict design forces for tall shear walls in regions with low to moderate seismicity. Compared to western Canada, in eastern Canada the earthquakes have lower magnitude and predominant high-frequency content. The combination of the long fundamental period of vibrations and the exposure to high-frequency ground motions, amplifies the impact of the higher modes which adds to the complexities in predicting the seismic response of tall shear walls in this region. This research investigates the issues involved with using force-based and displacement-based methods in design of tall shear walls in eastern Canada with specific focus on the deformation and ductility response at local and global levels and propose procedures to improve the accuracy of the estimations of these parameters.
As the first step to address these objectives, a preliminary study was carried out on two 17-storey shear wall buildings located in eastern and western Canada. The shear walls were designed according to NBCC/CSA A23.3 force-based design (FBD) and standard direct displacement-based design (DDBD) methods and the specific difference of the design predictions between eastern and western Canada were discussed. The design forces from each design approach were compared with the results of nonlinear time history analysis (NTHA) under ground motion sets with different frequency contents. For the shear wall in eastern Canada the results showed over-estimation of the ductility factor used in FBD method. On the other hand, the standard DDBD approach underestimated the design shear force and bending moments. The comparison of the results of NTHA under different sets of ground motion records demonstrated that the deformation response of the shear walls is very sensitive to ground motions frequency content.
In RC shear walls with single plastic hinge at the base, the base curvature is the key indicator of local ductility. Therefore, to have better predictions of the level of ductility, it is necessary to adequately predict the local ductility. The current methods to estimate the base curvature, specially those used in DDBD design, are found to be inaccurate for the taller RC walls in eastern Canada. To address this issue an objective was set to estimate the base curvature for shear walls in this region. A parametric study was carried out on more than hundred shear walls to identify the parameters that influence the most the top displacement and the base curvature of the shear walls in eastern Canada., Nonlinear time-history analysis (NTHA) were carried out in OpenSees under selected simulated ground motions. The results of the parametric study were then used to develop an empirical equation to estimate the base curvature. The predicted base curvature can be further used to calculate the local ductility of the shear walls, which is a good indicator to assess the level of inelastic response. A modified version of DDBD was proposed that uses the estimated local ductility in the design process. Analytical elastic shear amplification factors due to the higher modes were suggested to achieve an appropriate estimate of design force by DDBD. The seismic response of example walls designed according to the proposed approach were compared with the results of NTHA and showed improved results.
TABLE OF CONTENTS
DEDICATIONS ... III ACKNOWLEDGEMENTS ... IV RÉSUMÉ ... V ABSTRACT ... VIII TABLE OF CONTENTS ... X LIST OF TABLES ... XIV LIST OF FIGURES ... XV LIST OF SYMBOLS AND ABBREVIATIONS... XIXCHAPTER 1 INTRODUCTION ... 1
1.1 Objectives ... 3
1.2 Research methodology ... 3
1.2.1 General study on the design predictions for the tall RC rectangular shear walls in Canada using forced-based and displacement-based design methodology ... 4
1.2.2 A parametric study on deformation response of the shear walls in eastern Canada .... 4
1.2.3 Development of a relationship between the base curvature and the top displacement 5 1.2.4 Modification of the existing DDBD based on the proposed relationship between the base curvature and the top displacement ... 6
1.3 Organization of the thesis ... 6
CHAPTER 2 LITERATURE REVIEW ... 7
2.1 Seismic design of shear walls according to Canadian design provisions ... 7
2.2 Seismic deformation of RC shear walls ... 8
2.3 Design provisions related to global ductility, rotational ductility demand and base rotational capacity ... 11
2.5 Experimental studies on slender shear walls ... 17
2.6 Nonlinear time history analysis of RC shear walls ... 19
2.6.1 Ground motion records ... 19
2.6.2 Analytical modeling ... 20
2.7 Seismic displacement-based design of shear walls ... 22
2.7.1 Direct displacement-based design method (DDBD) ... 22
2.7.2 Direct displacement-based design using elastic spectra ... 23
2.7.3 Displacement-based design method using inelastic spectra (DBDIS) ... 25
2.7.4 Displacement-based design using yield point spectra ... 27
2.7.5 Displacement design spectrum for eastern Canada ... 27
2.8 Recent progress in displacement-based design ... 29
2.9 Summary ... 31
CHAPTER 3 COMPARISON OF FORCE-BASED AND DISPLACEMENT-BASED SEISMIC DESIGN OF TALLER REINFORCED-CONCRETE SHEAR WALLS ... 33
3.1 Force-based seismic design of tall shear walls ... 33
3.2 Direct displacement-based design procedure for tall RC shear walls ... 38
3.2.1 Design displacement spectra ... 43
3.3 Direct displacement-based design of the shear walls under study ... 44
3.4 Comparison of design from DDBD and FBD methods ... 47
3.5 Non-linear time history analysis ... 47
3.5.1 Selection and scaling of ground motion records ... 47
3.5.2 Numerical model ... 50
3.5.3 Discussion of results ... 51
CHAPTER 4 PARAMETRIC STUDY ON SEISMIC DEFORMATION OF TALL SHEAR
WALLS IN EASTERN CANADA ... 63
4.1 Design of RC shear walls for the parametric study ... 66
4.2 The ground motion characteristics, selection and scaling ... 70
4.3 Analytical modeling ... 72
4.3.1 OpenSees model ... 72
4.4 Results of nonlinear time history analysis ... 77
4.4.1 Response to simulated ground motion records versus historical records ... 77
4.4.2 Deformation response of I-shaped wall vs. the rectangular walls ... 79
4.4.3 Base curvature from NTHA vs design predictions ... 81
4.4.4 Top displacements from NTHA vs design prediction ... 84
4.5 Response sensitivity to the studied parameters ... 86
4.5.1 Fundamental period and height ... 86
4.5.2 Axial compressive force ... 91
4.5.3 Cross-sectional reinforcement ratio at the base ... 94
4.5.4 Influence of fundamental period and wall aspect ratio ... 96
4.6 Inter-storey drifts ... 99
4.7 Summary and conclusions ... 101
CHAPTER 5 CALCULATION OF THE BASE CURVATURE FOR TALLER SHEAR WALLS AND THE APPLICATION TO DDBD ... 104
5.1 The important parameters ... 104
5.2 The relation between the base curvature and the top displacement ... 105
5.3 Estimation of β to relate the base curvature to the top displacement ... 106
5.4 Design examples ... 112
5.5.1 General discussion ... 114
5.5.2 Elastic shear amplification due to higher modes for using with DDBD ... 115
5.5.3 Modified DDBD procedure for taller walls in eastern Canada ... 118
5.5.4 Design examples using modified DDBD approach ... 122
5.6 Summary and conclusions ... 135
CHAPTER 6 CONCLUSION AND RECOMMENDATIONS ... 137
6.1 Summary ... 137
6.2 Original contributions of the research ... 138
6.3 Conclusions ... 139
6.3.1 General observations on the design predictions and response of tall shear walls in eastern and western Canada ... 139
6.3.2 Deformation response of the tall shear walls located in eastern Canada ... 141
6.3.3 Base curvature-top displacement relationship for the tall shear walls located in eastern Canada ... 142
6.3.4 Modified DDBD approach for design of tall shear walls in eastern Canada ... 143
6.4 Recommendations for future work ... 144
6.4.1 The impact of soil class ... 144
6.4.2 Design for other performance levels ... 145
6.4.3 Equivalent viscous damping and damping modification factor for eastern Canada 145 6.4.4 The applicability of the proposed equation to other shapes of RC shear walls ... 145
6.4.5 The impact of mass-stiffness eccentricity ... 146
BIBLIOGRAPHY ... 147
LIST OF TABLES
Table 2-1: Ductility properties of shear wall structures in ASCE 7-15 ... 13
Table 2-2: Ductility properties of shear wall structures in New Zealand code (NZS 1170, 2005) 14 Table 2-3: Ductility properties of shear wall structures according to (Eurocode 8, 2008) ... 15
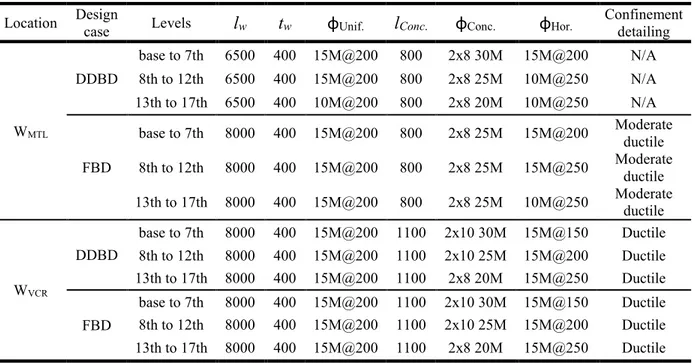
Table 3-1: The cross-sectional reinforcement of the designed shear walls (Units: mm) ... 36
Table 3-2: Seismic design information of W1~4 in Montreal and Vancouver ... 37
Table 3-3 Direct displacement-based design parameters ... 46
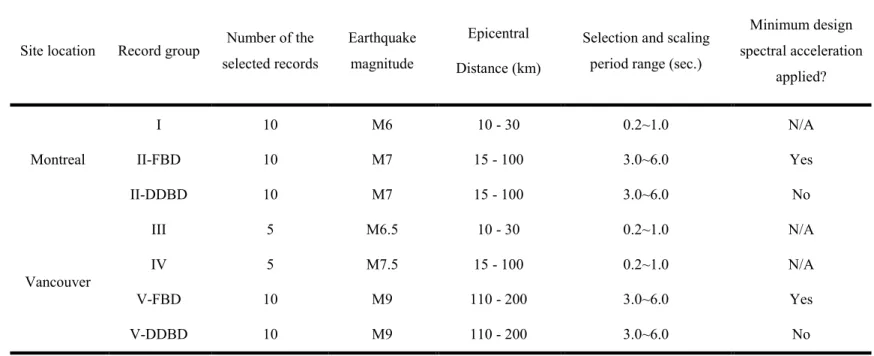
Table 3-4 Summary of selected records for NTHA of the shear walls for the office building ... 49
Table 4-1: FB designed shear walls design information (total 40 shear walls) ... 69
Table 4-2: DDB designed shear walls design information (total 60 shear walls) ... 69
Table 4-3: FB designed I-shaped shear walls design information ... 70
Table 4-4: Ratio of deformation response from VT2 over OS, average of all records ... 76
Table 5-1: Design information, displacement and curvature predictions for the example shear walls from FBD method, NTHA and the proposed equation ... 113
Table 5-2: The design information of the walls used to study the elastic higher mode impact on shear and bending moment ... 117
Table 5-3: Design information and summary of the outputs for the shear walls designed according to the proposed modified DDBD approach ... 123
LIST OF FIGURES
Figure 2-1: Total deformation of the shear wall as the summation of elastic and inelastic portions
after White and Adebar (2004). ... 9
Figure 2-2: Fundamentals of direct displacement-based design (Priestley et al. 2007) ... 24
Figure 2-3: Example of inelastic displacement spectra (Chopra et al., 2001) ... 26
Figure 2-4: Example of yield pint spectra (Asschheim 2002) ... 27
Figure 2-5: Displacement spectra derived by converting NBCC acceleration spectra (2475 years return period) ... 28
Figure 3-1: Base rotational demand and capacity of sample shear walls according to CSA A23.3 ... 34
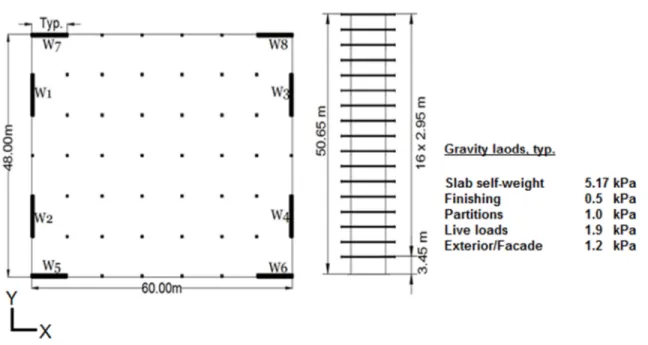
Figure 3-2: Studied building: plan view, wall elevation and gravity loads ... 35
Figure 3-3: Typical section for the designed shear walls ... 36
Figure 3-4: The yield and maximum curvature of a shear wall section according to CSA A23.3-14 ... 39
Figure 3-5: Design displacement spectra based on NBCC 2010 UH acceleration spectra ... 44
Figure 3-6: Curvature profile for shear wall in (a) Montreal and (b)Vancouver ... 52
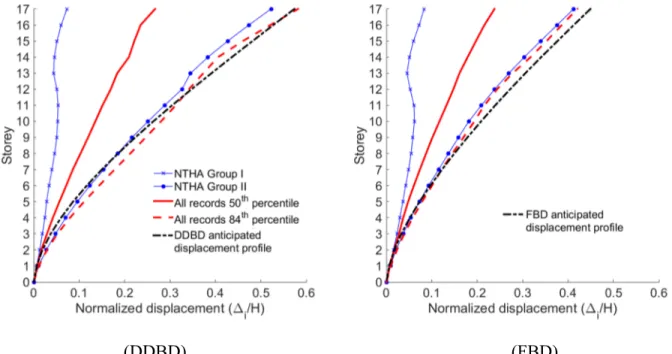
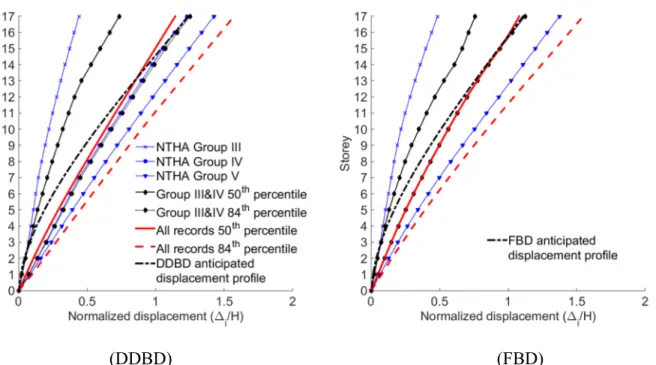
Figure 3-7 Displacement profile for shear wall in Montreal based on normalized displacement (∆i/H) ... 54
Figure 3-8 Displacement profile for shear wall in Vancouver based on normalized displacement (∆i/H) ... 55
Figure 3-9: Bending moments profile for Montreal ... 56
Figure 3-10: Bending moments profile for Vancouver ... 57
Figure 3-11: Shear force profile for Montreal ... 59
Figure 3-12: Shear force profile for Vancouver ... 60
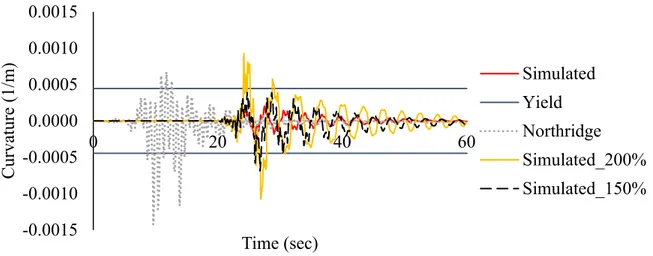
Figure 4-1: Time history response of the base curvature of the example shear wall to various ground motions. ... 65
Figure 4-2: Time history response of the top displacement of the example shear wall to various
ground motions. ... 65
Figure 4-3: The acceleration spectrum of the scaled ground motion records used for the parametric study in comparison with NBCC 2015 design spectra for Montreal ... 72
Figure 4-4: OpenSees fiber modeling schematic ... 74
Figure 4-5: VT2 model for 20 and 25-storey shear walls ... 75
Figure 4-6: Displacement profile from calibrated OpenSees versus the VT2 models. ... 76
Figure 4-7: Maximum displacement profiles from the simulated and historical ground motion records ... 78
Figure 4-8: Maximum curvature profiles from the simulated and historical ground motion records ... 79
Figure 4-9: The ratio of the displacement and curvature prediction for the I-shaped shear walls to the displacement and curvature of the rectangular walls with similar fundamental periods . 80 Figure 4-10:Curvature predictions from design versus NTHA ... 82
Figure 4-11: The ratios of the curvature from NTHA to the design predictions ... 82
Figure 4-12: Base curvature predictions from design functions based on NTHA displacements versus NTHA base curvature ... 83
Figure 4-13: Displacement predictions from design (FBD or DDBD) versus median response of all records from NTHA ... 85
Figure 4-14: Displacement predictions from design (FBD or DDBD) versus median response of low frequency records from NTHA ... 86
Figure 4-15: Base curvature response of the shear walls versus their analytical periods ... 87
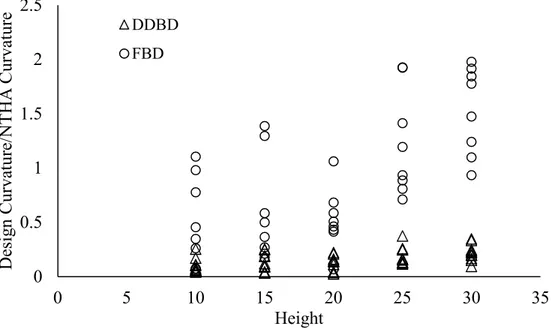
Figure 4-16: Base curvature demands variation with height. ... 88
Figure 4-17: Base curvature response comparison; Median response of all records versus 84th percentile response of all records versus median response of the low frequency records. The normalized curvature (i.e. the curvature ductility) is show on right axis. ... 89
Figure 4-18: Top displacement variation of the shear walls against their height. Since the displacement become relatively constant above 20-storeys, the global drift (shown on the right
axis) decrease. ... 90
Figure 4-19: Variation of base curvature for the walls with different compressive axial force... 92
Figure 4-20: Variation of top displacement for the walls with different axial compressive force 93 Figure 4-21: Comparison of the impact of the reinforcement ratio at the base on variation of base curvature against height. ... 95
Figure 4-22: Comparison of the impact of the reinforcement ratio at the base on variation of top displacement against height. ... 96
Figure 4-23: The impact of the seismic mass on the variation of base curvatures against height . 97 Figure 4-24: The impact of the seismic mass on the variation of top displacements against height ... 97
Figure 4-25: Impact of aspect ratio (hw/lw) of the shear walls on base curvature variation against height ... 98
Figure 4-26 Impact of the aspect ratio of the shear walls on top displacement variation against height ... 99
Figure 4-27: Maximum storey drift of the shear walls versus their height. The maximum inter-storey drift normally occurs at the top inter-storey of the shear walls ... 100
Figure 4-28: Maximum inter-storey drift versus the global drift ... 101
Figure 5-1: Variation of β against height ... 106
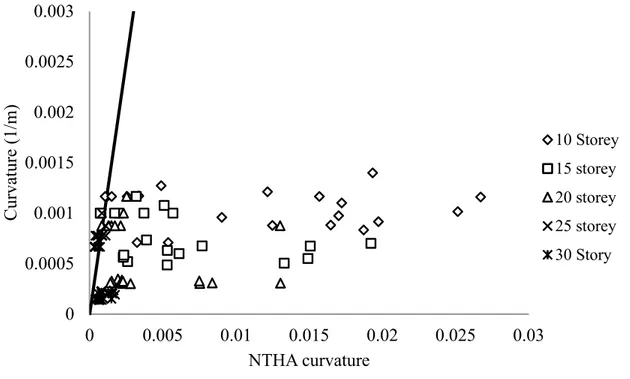
Figure 5-2: The predicted base curvature from Equation 5-2 versus NTHA ... 109
Figure 5-3: Ratio of the base curvature from NTHA to the base curvature from the proposed equation and base predicted base curvature by FBD or DDBD ... 111
Figure 5-4: Elastic shear amplification variation against the shear wall period ... 116
Figure 5-5: Predicted curvature profile of 10-storey shear wall compared to NTHA demands .. 124
Figure 5-6: Predicted displacement profile of 10-storey shear wall compared to NTHA demands ... 125
Figure 5-7: Predicted shear force profile of 10-storey shear wall compared to NTHA demands 125 Figure 5-8: Predicted bending moment profile of 10-storey wall compared to NTHA demands 126 Figure 5-9: Force-displacement relations of SDF system for 20-storey shear wall. ... 127 Figure 5-10: Predicted curvature profile of 20-storey shear wall compare to NTHA demands .. 128 Figure 5-11: Predicted displacement profile of 20-storey shear wall compare to NTHA demands ... 128 Figure 5-12: Predicted shear force profile of 20-storey shear wall compare to NTHA demands 129 Figure 5-13: Predicted bending moment profile of 20-storey wall compared to NTHA demands ... 129 Figure 5-14: Predicted curvature profile of 25-storey shear wall compare to NTHA demands .. 130 Figure 5-15: Predicted displacement profile of 25-storey shear wall compare to NTHA demands ... 131 Figure 5-16: Predicted shear force profile of 25-storey shear wall compare to NTHA demands 131 Figure 5-17: Predicted bending moment profile of 25-storey wall compared to NTHA demands ... 132 Figure 5-18: Predicted curvature profile of 30-storey shear wall compare to NTHA demands .. 133 Figure 5-19: Predicted displacement profile of 30-storey shear wall compare to NTHA demands ... 133 Figure 5-20: Predicted shear force profile of 30-storey shear wall compare to NTHA demands 134 Figure 5-21: Predicted bending moment profile of 30-storey wall compared to NTHA demands ... 134
LIST OF SYMBOLS AND ABBREVIATIONS
c Compression depth of the cross section
C Coefficient that relates the base curvature to the top displacement (Dezhdar, 2012) Cd The ductility coefficient according to ASCE 7
DB Displacement-based
DBD Displacement-based design DDBD Direct displacement-based design
FB Force-based
FBD Force-based design hw, Hn Height of shear wall
He Height of the equivalent single degree of freedom system
Hi Height of ith level
Ie Importance factor of the building according to NBCC
Ke Effective stiffness of the equivalent single degree of freedom system
lw Length of shear wall
Me Mass of the equivalent single degree of freedom system
mi Seismic mass of ith level
Mv-NBCC Elastic amplification factor due to the higher modes according to NBCC
Mv Elastic amplification factor due to the higher modes
Mw Modal magnitude of the earthquake
N Number of storeys
Pf Axial compressive force at the base of the sear wall
q Ductility factor according to EC 8 q0 Behaviour factor according to EC 8
R Analytical load reduction factor (Dezhdar, 2012)
R Load reduction factor according to ASCE 7 OR the epicentral distance of the earthquake
Rd Ductility related load reduction factor according to NBCC
Roadj Adjustedover-strength related load reduction factor
Ro Over-strength related load reduction factor according to NBCC
Rξ Damping reduction factor
S(Ta) Seismic design acceleration
SI Stability index factor T1, TAnalitical Fundamental period
Ta Empirical design period according to NBCC
Tc Corner period
Td Seismic design period
Te Effective period of the equivalent single degree of freedom system
Vd Seismic design base shear
β Coefficient that relates the base curvature of the shear wall to its top displacement δu Ultimate inelastic displacement at the top of the shear wall according to ACI 318
∆de Design displacement of the equivalent single degree of freedom system
∆i Total displacement at ith floor
∆max Maximum spectral displacement
∆max,ξ=5% Maximum spectral displacement with 5% damping
∆ye Yield displacement of the equivalent single degree of freedom system
∆yi Displacement at ith level at the yielding point
∆f Elastic displacement of the shear walls according to CSA A23.3
∆t Top displacement of the shear wall
∆y Yield displacement of the shear wall
∆ye Yield displacement of the equivalent single degree of freedom system
ϵcu Concrete crushing strain
ϵcu Yielding strain of reinforcement steel
µ Global ductility factor, displacement ductility factor µφ Base curvature ductility factor
Ωv Inelastic shear amplification factor due to higher mode effects
φy Yield curvature
γw Nominal over-strength factor of the shear wall according to CSA A23.3
θid Rotational demand at the base of shear wall according to CSA A23.3
θic Rotational capacity at the base of shear wall according to CSA A23.3
θm Maximum allowed drift
θy Drift at yielding point
ξ Damping of the system
CHAPTER 1
INTRODUCTION
Reinforced concrete (RC) shear wall systems are commonly used as the seismic force resisting system (SFRS) in high-rise buildings. The ease of design and construction as well as their efficient integration into common architectural layouts make them a popular choice for structural engineers. Depending on the level of seismic forces, as well as the layout and the height of the building, either simple or coupled shear wall systems could be used. Because of the higher share of the low-to-medium rise structures in building construction, seismic design provisions have been developed having this group of structures in mind and do not explicitly account for differences in seismic response of taller buildings. Not recognizing the particularities of seismic behavior of these structures may lead to designs that could be overly conservative or even unfeasible.
Canadian seismic design provisions use force-based design (FBD) methodology to determine design forces for building structures. It is assumed that in response to seismic loads, the structures dissipate seismic energy through inelastic deformations of dedicated structural elements. Design forces are first estimated from the elastic design spectrum, and subsequently modified by reduction factors to account for system over-strength and inelastic structural response. These factors, prescribed by design codes for different structural systems (Mitchell et al., 2003), are essential to initiate the design process. The FBD method is simple and direct but has several drawbacks. The procedure requires that the stiffness, fundamental period and the mobilized ductility be estimated in advance (Humar et al., 2011, Priestley et al., 2007) and falls short to establish the clear relationship between structural strength and inflicted damage. Numerous studies have been conducted in recent years to improve the accuracy of the FBD approach (Priestley and Amaris, 2002, Luu et al., 2013b, Boivin and Paultre, 2012b). However, the design assumptions of this approach heavily depend on first mode behavior which is difficult to justify for tall buildings. Such conceptual drawbacks still remain and are accentuated in the design of taller buildings, especially those with reinforced concrete (RC) shear walls.
An important research effort has been made to improve the force based seismic design method and account appropriately for higher modes effects for the taller RC shear walls. In Canada, the elastic higher modes shear amplification of base shear was introduced in 2005 edition of NBCC (NRC 2005) after the studies carried out by Humar and Mahgoub (2003). The inelastic effects of higher modes on shear forces and bending moments were recently studied by Boivin and Paultre (2012b)
and Luu et al. (2013b) for western and eastern Canada, respectively. While these studies focused mainly on the force amplification, in particular that of the shear forces, in the study by Dezhdar (2012) the impact of higher modes on the drift and curvature of cantilever shear walls in western Canada was also investigated. It was found that the requirements of CSA A23.3-14 based on the FBD procedure overestimated the base curvature and could not adequately establish the relationship between the maximum base curvature and the maximum top displacement. Considering that the ground motions in western Canada are dominated by low frequencies while the earthquakes in the east are rich in high frequencies (Atkinson, 2009), the effects of higher modes in eastern Canada are likely to be larger. Thus, for eastern Canada, the estimate of the curvature-displacement relationship would be even less accurate.
In low-to-moderate seismic zones, such as eastern Canada, taller shear walls are more likely to exhibit an elastic response to seismic loading. Such behaviour was observed by Luu et al. (2013a) based on the mean rotational ductility demand at the base of the wall. This response contradicts the predictions by the FBD method that relies on the assumption of the development of the full plastic hinge, and thereby overestimates the force reduction factors for such walls. Providing the minimum ductility capacity regardless of the type of structural response can become a limiting design criterion for taller walls, and potentially lead to uneconomical solution.
Contrary to the force-based design (FBD) in which displacement are verified at the end of the design process, displacements are essential design criteria in the displacement-based design (DBD). An important research effort has been deployed to develop design methods aimed to achieve desired displacements and/or inter-story drifts in the structure by Priestley et al. (2000 and 2007), Chopra and Goel (2001 and 2004), Aschheim (2002) and Tjhin et al. (2007). The direct displacement-based design (DDBD) method proposed by Priestley et al. (2007) is simple and efficient and can be easily implemented in practice. However, when applied to tall shear walls, DDBD has several downsides. Similar to the FBD, the procedure relies on the assumption that the first mode dominates the seismic response. Once determined, the seismic base shear has to be adjusted to account for higher mode effects. Humar et al. (2011) illustrated the use of the DBD design with the example of a 12-story RC shear wall building located in western North America. Effects of the higher modes were assessed by performing additional modal push-over analysis once the design was completed. In this study, it was possible to achieve a unique design because the structure was located in high-seismicity zone, and in the mid-range heights. Humar concluded that
the ductility assumed in the design codes can be rarely mobilised if the drifts remain below the code-specific drift limits or the drifts limits required to avoid instability caused by P-D effects. No other Canadian study explored the use of the DBD design for taller RC shear walls or structures located in eastern Canada.
In view of limited number of studies investigating seismic response of RC shear walls in eastern Canada and in absence of a detailed study on the deformation and ductility response of the tall RC shear walls in eastern Canada it appears pertinent to conduct a research addressing the issues discussed above.
1.1 Objectives
The main objectives of this PhD thesis are to study the seismic response of tall RC shear walls in eastern Canada, with focus put on their deformation response and to establish a relationship between global and local ductility indicators that could be used to improve seismic design procedures for this system. The methodology applied to achieve these objectives is detailed in the following section.
1.2 Research methodology
The research conducted in this study was regrouped around four distinct topics. The initial study was carried out to identify the shortcomings of available design methodologies in the context of taller RC shear wall seismic design, as well as specific differences in the seismic behaviour of these structures in eastern and western Canada. The attention is then directed to a detailed study of deformation response through the parametric study. Next, the results were used to develop a more appropriate relationship between the global and local ductility indicators (top displacement and base curvature). The developed relationship was then applied to improve displacement-based design procedure for this type of structure.
1.2.1 General study on the design predictions for the tall RC rectangular shear
walls in Canada using forced-based and displacement-based design
methodology
For the initial study, 17-storey shear walls in typical buildings located in Montreal and in Vancouver were designed according to NBCC 2015/CSA A23.3 force-based design (FBD) method and governing design parameters were identified. In parallel, DDBD method, proposed by Priestly et al (2007), was adapted for taller RC walls accounting for the possible elastic and inelastic approach. In the absence of explicit design displacement spectra in NBCC, displacement spectra were constructed following recommendations available in literature.
The seismic response of the walls was then studied using the nonlinear time history analysis using OpenSees. The models were calibrated following the recommendations available in literature (Luu et al, 2013 and ATC-72-1, 2010). The analyses were conducted for a set of twenty simulated ground motion records selected from the database proposed by Atkinson (2009).The sensitivity of the response to the frequency content of ground motions was evaluated. Two designs were compared by tracking the curvature ductility, lateral displacements, bending moments and story shears. Also, the impact of higher modes on seismic response of both regions was investigated.
1.2.2 A parametric study on deformation response of the shear walls in eastern
Canada
In view of the findings from the initial study, a parametric study was carried out with focus on the deformation response of the tall RC shear walls in eastern Canada. The aim of this study was to identify the parameters which influence the most displacement and curvature response of such shear walls and to assess their specific impact on the top displacement and the base. Top displacement and base curvature were chosen as global and local deformation indicators respectively.
To carry out the parametric study, large number of rectangular shear walls had been designed with heights varying between 10- to 30-storeys. All shear walls were assumed to be located in Montreal, QC, on site class “C”. To obtain a variety of options with different geometrical properties and capacity-to-demand ratios, the shear walls were designed according to either FBD or DDBD
approaches. The level of axial compressive force was varied as well. To introduce different dynamic characteristics, the seismic mass was also varied for certain walls with the same geometry. Although the focus of this research was on the rectangular shear walls, in order to investigate the possibility of expanding the conclusions to I-shaped shear walls, several I-shaped walls were also designed using the FBD approach and their response was compared to that of rectangular shear walls.
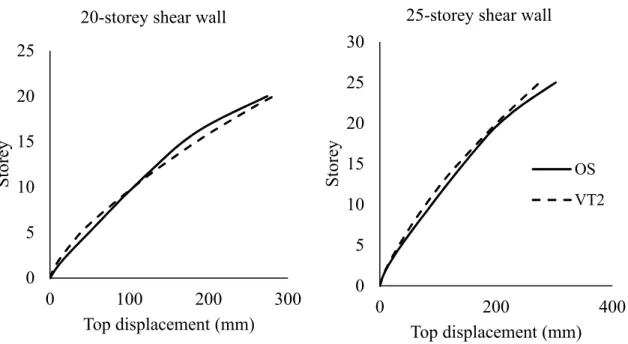
The designed shear walls were modeled in OpenSees for NTHA, that were calibrated using the available experimental test data on an 8-storey shear wall carried out at Polytechnique de Montreal (Ghorbanirenani et al, 2010). Additionally, the OpenSees modeling strategy was compared and calibrated with FE models in VecTor 2 for taller walls (20 and 25-storey shear walls) to confirm its accuracy especially regarding the prediction of base curvature and top displacement.
A set of thirteen simulated ground motions (Atkinson 2009) were chosen to perform the parametric study out of which eight records with relatively low frequency content and five records with high frequency contents. The records were selected and scaled following the guidelines provided in NBCC 2015. The response to the simulated ground motion records was compared with the response to the historical ground motions compatible with the governing earthquake scenarios in eastern Canada. The results of NTHA were assessed using different statistical values (i.e. mean, median, 84th percentile etc.). The results of the NTHA were compared with the design predictions for both FB and DDB designed walls and the sources of the discrepancy were investigated.
Once identified, the most influential parameters were then considered to develop a relationship between the two key deformation responses, the top displacement and the base curvature.
1.2.3 Development of a relationship between the base curvature and the top
displacement
In this part of the study, a function relating the top displacement to the base curvature is proposed. This function should improve the deficiencies of the base curvature prediction based on current FBD and DDBD approaches and lead to a more accurate estimate of the base curvature for the tall shear walls located in eastern Canada. The proposed relationship is then applied to walls designed in the parametric study and design predictions from the proposed relationship are compared against the estimates obtained from original design as well as the results of NTHA. The proposed
relationship is then further validated on nine different shear walls with heights between 10 to 30-storeys.
1.2.4 Modification of the existing DDBD based on the proposed relationship
between the base curvature and the top displacement
The proposed relationship to predict the base curvature is then used to put forward a modified DDBD methodology, better adapted to design of taller RC shear walls. A study was carried out to estimate the elastic shear amplification factor due to higher mode appropriate for use with this method. The proposed procedure was then used to design different shear walls with varying heights. The design predictions were compared with the results of NTHA to investigate the accuracy of the proposed method.
1.3 Organization of the thesis
Chapter 1 introduces the problematics, sets objectives of the study, discusses the methodology adopted and describes the organisation of the thesis. The review of the literature pertinent for the project is presented in Chapter 2.
In Chapter 3, the initial study carried out on two shear wall buildings located in Montreal and Vancouver, is presented. This preliminary study introduces the reader to specific challenges regarding the design of tall shear walls and examines the fundamental differences in response of the shear walls in eastern Canada and western Canada.
The extensive parametric study used to identify the parameters that influence the most the deformation response of taller shear walls is described in Chapter 4. The relevant information regarding the NTHA, including the calibration of the analytical model and selection and scaling of the ground motion records are explained in this chapter.
Chapter 5 of this thesis presents the proposed statistical formulation that relates the base curvature to the top displacement. Later in this chapter a modified DDBD approach is proposed and its applicability is examined using NTHA.
Last chapter of this thesis, Chapter 6, includes the summary and conclusions of the research and provides the suggestions for the future studies.
CHAPTER 2
LITERATURE REVIEW
2.1 Seismic design of shear walls according to Canadian design
provisions
The design of structural reinforced concrete (RC) shear walls according to Canadian design codes (NBCC, 2015 and CSA A23.3, 2014) follows a force-based approach. In NBCC (2015), the inelastic seismic base shear is calculated using the following equation:
Equation 2-1 V = ( )
where Td is the design fundamental period of the structure, S(Td) is the spectral acceleration at the
design period with a probability of exceedance of 2% in 50 years; Mv is the factor accounting for
the increase in base shear due to higher mode effects; IE is the importance factor, W is the seismic
weight, and Rd and Ro are the ductility and over strength-related force reduction factors,
respectively. Rd factorsare specified in NBCC for various structural systems and they quantify the
energy dissipated through inelastic deformations. To find the demand forces, either static or dynamic analysis can be used. The seismic base shear, determined from dynamic analysis, must be calibrated to the base shear determined by equivalent static force method following the rules established for the regular and irregular buildings. Once the forces are determined, the estimates of total displacements can be obtained by multiplying the elastic displacements caused by the design force Vd by RdRo. This approach based on the equal displacement principal, which stipulates that
the total displacements of inelastic and elastic systems are approximately equal. Newmark and Hall (1982) showed that for medium-to-long period structures (T ≥ 0.5 s), the equal displacement principle does apply and that the ductility-related force modification factor, Rd, can be considered
equal to the global ductility ratio, µ.
For regular buildings with RC shear walls used as the primary lateral load resisting system, it is assumed that most of the earthquake energy is dissipated through flexural inelastic rotations at a region at the base of the shear wall commonly known as the plastic hinge. The design procedure prescribed by CSA A23.3 (2014), incorporates the capacity design principles, and should provide a wall with an adequate resistance, stiffness and ductility. The section at the base of the wall is first designed to have an adequate flexural resistance for the bending moment introduced by seismic
loading. The design bending moments for the sections above the plastic hinge, are amplified by the ratio of the section’s flexural resistance at the base of the wall and the bending moment demand at the top of the plastic hinge. The design shear forces are also found by the capacity design approach through amplifying the shear demands by the ratio of the nominal or probable bending moment capacity to the bending moment demand at the base of the shear wall, for ductile and moderately ductile walls, respectively. The ductility requirements are verified next. These include the verification of the minimal quantity of concentrated and distributed vertical and horizontal reinforcement and the construction details, the verification of stability of compression zone, and comparison of the inelastic rotational demand and the rotational capacity in the plastic hinge region. The verification of the inter-storey drifts against the limits described by NBCC completes the design process.
2.2 Seismic deformation of RC shear walls
Although there have been many studies addressing the seismic force response of RC shear wall structures, the studies on the deformation response of this type of structures are relatively limited. One of the most comprehensive studies on this topic in Canada was carried out by White and Adebar (2004) with the objective of investigating the rotational and displacement demands in simple and coupled shear walls, using nonlinear time history analysis. The findings of this study provided the bases for the ductility provisions of CSA A23.3 in 2004. The study was done for 10 to 40 storey high walls using a set of ten strong ground motion records with predominantly low frequency contents, representative of earthquakes in western North America.
The study showed that simple walls developed smaller rotational and displacement ductility demands compared to coupled walls because the participation of the elastic displacement in total displacement in simple cantilever shear walls is usually more significant. Even though the ground motion records were dominated by low frequencies, the impact of the higher modes on the deformation response was noticeable because of the wall height. White and Adebar (2004) assumed that the inelastic displacements of a shear wall were proportional to the inelastic rotation around the center of the plastic hinge (see Figure 2-1).
Figure 2-1: Total deformation of the shear wall as the summation of elastic and inelastic portions after White and Adebar (2004).
Consequently, the elastic deformation profile of the shear wall can be found by deducting the inelastic deformation from the total deformation profile. It is presumed that these elastic deformations include the higher mode contribution and inelastic deformation can be simplified as a rigid body rotation at the mid-height of the plastic hinge. It was assumed that although due to higher mode impacts, the maximum base rotation and top displacement do not occur at the same instant, the inelastic response can be derived from deducting the elastic portion from the total displacement. The total displacement is derived by multiplying the elastic displacement by the ductility factor.
Although White and Adebar (2004) noted that for the taller walls, the maximum rotation at the base and the maximum top displacement did not occur at the same instant, their proposed method assumed that there is a direct geometrical relationship between the base rotation and the top displacement. Because of its simplicity and reasonable accuracy for the low-to-intermediate height walls, their method was adapted by CSA A.23 and is being used in current version of the code (A23.3 2014). However, as it was pointed out before, this study addressed the walls located in western North America for which the impact of the higher modes is not as significant as in eastern North America. For tall shear walls located in eastern Canada, the wall ductility assumed in the force-based approach may not be fully mobilized implying that estimating the ultimate displacement form the elastic deformation could be very conservative and inaccurate.
Dezhdar and Adebar (2012) continued the research on the relationship between the base rotation and the top displacement of cantilever walls using a statistical approach through a parametric study.
Similar to the study by White and Adebar (2004), their study focused on western Canada. The seismic response of a total of fifteen shear walls with heights varying between 10 to 50 storeys was studied using non-linear time history analysis. The inelastic shear wall response was modeled using a trilinear moment-curvature law and the concentrated plasticity simulation. The analysis was carried out for a set of fifty-three ground motion records representative of western North America selected and scaled to achieve the compatibility with NBCC design spectrum over a selected period range.
After evaluating the base rotation and the top displacement response of the shear walls, the authors proposed the following equation to relate the top displacement and the base curvature:
Equation 2-2 φ = ∗
in which φd is the demand curvature, Δt is the top displacement, and hw and lw are respectivelythe
height and the length of the shear wall. The coefficient C is a statistical parameter introduced by the authors to correlate the base curvature and the top displacement. The proposed coefficient is inversely proportional to the force reduction factor (R), thus directly proportional to the global ductility µ. In their study, the reduction factor (R) is not the presumed reduction factor of the NBCC code (Rd), but is the ratio of the inelastic base shear to elastic base shear force that was calculated
for each shear wall. The expressions for the upper and lower bound values of C are based on the mean and the mean plus one standard deviation results and are respectively as follows
Equation 2-3 = 1.8 − 0.017 ∗ > 0.8 = 2.8 − 0.022 ∗h$ > 1.0#
The first equation should be used if lower wall ductility is anticipated while the second one is appropriate for walls that develop higher ductility demand. The authors showed that the proposed equation provided a good accuracy in estimating the base curvature for shear walls up to 20-storeys high. For taller walls, the impact of higher modes is very significant, and the scatter of the results obtained for base curvature increases. Consequently, it becomes more difficult to put forward a unique equation to cover all shear walls with different geometry and design properties.
2.3 Design provisions related to global ductility, rotational ductility
demand and base rotational capacity
NBCC (2015) defines three options that can be considered in seismic design of non-coupled reinforced concrete shear walls which are related to the global system ductility: conventional construction (Rd = 1.5 Ro =1.3), moderately ductile shear walls (Rd = 2.0 Ro =1.4) and ductile
shear walls (Rd = 3.5 Ro =1.6). Height limitations are imposed for walls of conventional construction as a function of the location (40m and 30m for eastern and western Canada, respectively).
CSA A23.3 (2014) provides specific design and detailing requirements to ensure that the desired system ductility is achieved while maintaining the adequate resistance and avoiding any instability. However, like in other force-based methods, there are no explicit verifications at the end of the design process to confirm to what degree the assumed ductility is effectively mobilized by the seismic demand. To provide the capacity for ductile deformation, CSA A23.3-14 prescribes specific reinforcement detailing for ductile and moderate ductile walls, these being more stringent for ductile shear walls. Concentrated vertical reinforcement has to be on the edges of the shear wall as well as at the corners and the intersections with other walls in order to achieve a more efficient and ductile performance by the shear wall. Also, a minimum quantity of vertical and horizontal reinforcements must be provided. Longer development and overlap lengths are required for the reinforcement to guaranty the sufficient bond between the steel rebar and the concrete during an earthquake. The maximum distance between the bars is limited for a better inelastic performance. The vertical concentrated reinforcement must be tied to avoid flexural buckling failure modes and provide the necessary confinement for concrete. Depending on the level of ductility, the distributed vertical reinforcement should also be tied to prevent the flexural buckling of these rebars under compression.
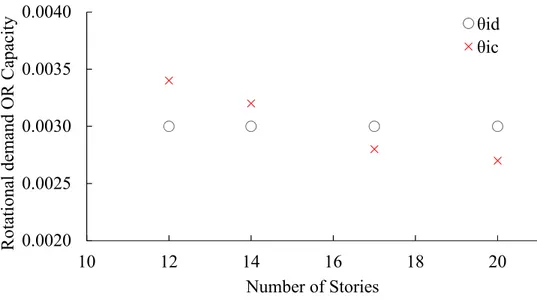
While the global ductility (µ=Rd) is not verified explicitly during the design process, verification
of local ductility at plastic hinge is required by CSA A23.3-14 (clause 21.5.7.2&3). The design must demonstrate that the inelastic rotation of the shear wall, θid, at the base does not exceed the
rotational capacity of the section, θic (θid≤ θic). θid and θic can be calculated from the following
Equation 2-4 θ& = '∗ (∗ ) '∗*
)+,-. ≥ (θ& )1&2
Equation 2-5 θ&3=456∗
73 − 0.002 ≤ (θ&3)19:
where lw is the length of the wall, hw is the total height, Rd and Ro are the related force reduction
and over-strength factors, respectively, ∆f is the displacement at the roof level at yielding under
inelastic seismic load, γw is the ratio of the nominal flexural resistance to the factored flexural
moment at the base, c is the depth of compression zone of the concrete section, and ϵcu is the
maximum concrete compression strain. (θid)min ensures a minimum ductility for buildings with
small inelastic drifts and (θid)min is equal to 0.003 and 0.004 for moderately ductile and ductile
walls, respectively. (θid)max is taken as 0.025 for the two ductility levels to account for the possibility
that the tensile strain capacity of the reinforced bars limits the inelastic rotational capacity of the shear wall. By combining the demand and capacity equations and assuming (hw/lw=5) the
formulation of the local ductility requirements can be stated in term of the ratio of the length of the compression zone to the length of the wall as follows (Adebar, Mutrie, and DeVall, 2005):
Equation 2-6
For moderate ductile walls:
3 ≤ 1 (1 + 300 ∗ (⁄ '∗ ∗ ) ∗ (7.>)*
?.@ )) ≤ 0.40
For ductile walls:
3 ≤ 1 (1 + 430 ∗ (⁄ '∗ ∗ ) ∗ (@.B)*
C.D )) ≤ 0.33
In American standards (ASCE 7, 2015 and ACI 318, 2017) two categories of shear walls are defined in relation to the level of ductility: Ordinary reinforced shear walls and Special reinforced shear walls. In ASCE (2015), instead of the two reduction factors (Ro and Rd) prescribed by NBCC
(2015), only one force reduction factor (R) is represented which is equivalent to (Ro*Rd). Contrary
to the Canadian code in which the ductility factor is assumed to be the same as the reduction factor, in ASCE a separate ductility factor (Cd) is presented. The force reduction (R) and ductility (Cd)
factors for each level of ductility are given in Table 2-1. The bearing wall systems are those in which bearing walls are the major elements to support the vertical loads, and frame systems are those in which frames support the vertical gravity loads. In general, the reduction factors for frame
systems are larger than those for the bearing wall systems as they have better performance in dissipating the seismic energy. For bearing systems, the ductility (Cd) and load reduction factors
(R) are equal, but this is not the case for frame systems. It is noted that the loads reduction and ductility factors in ASCE 7 (2015) are noticeably larger than those in the Canadian code (RoRd).
However, to compare these factors with NBCC 2015, attention must be paid to the difference of the strength reduction factors between the codes.
Table 2-1: Ductility properties of shear wall structures in ASCE 7-15
Structural system R Cd
Bearing Wall System, Special reinforced shear walls 5 5 Bearing Wall System, Ordinary reinforced shear walls 4 4 Building Frame System, Special reinforced shear walls 6 5 Building Frame System, Ordinary reinforced shear walls 5 4.5
R: Load reduction factor Cd: Ductility factor
The ASCE 7 (2015) does not allow the use of ordinary walls in areas with high seismic risk and specifies a limit of 48m (160ft) for systems using special shear walls only. For taller walls in these regions, it is obligatory to use a dual system that is a combination of shear walls and moment resisting frames, capable to resist at least 25% of the total seismic forces. There is no height limit either for ordinary or for special reinforced shear walls in areas of low seismic risk.
In ACI 318-(2017) the available rotational capacity at the base of the shear wall is verified only for special shear walls using Equation 2-7; for ordinary shear walls it is only required to provide special confinement detailing. This control is regardless of the system supporting the vertical loads (i.e. bearing wall or frame system).
Equation 2-7 3∗ ≤ ?
BEE∗+G F6. ≤ 0.238
where c* is the compression depth, hw is the height of the shear wall and δu is the ultimate inelastic
displacement at the top of the shear wall. For comparison, this equation can be rewritten in CSA A23.3 format as shown in Equation 2-6, taking into account the fact that the concrete resistance factor in ACI code is equal to 1.0 while in CSA A23.2 (2014) it is 0.65, (Adebar et al., 2005):
Equation 2-8 3 ≤ ?
DHE∗+∆'∗J ∗JG . ≤ 0.37
In New Zealand standards (NZS 1170, 2004 and NZS 3101, 2006) three types of shear walls are defined as a function of the level of ductility of the shear wall buildings, namely nominal ductile shear walls, limited ductile shear walls and ductile shear walls. The equal displacement approximation is considered applicable for the structures with fundamental periods greater than 0.7s. The maximum ductility factor for each system is shown in Table 2-2. The aspect ratio of the walls influences the value of the ductility factors and consequently, walls with low aspect ratios have smaller ductility factors due to shear failure effects.
The maximum permitted compression depth in ultimate state, that does not require confinement reinforcement, is defined as:
Equation 2-9 K
LM ≤
E.?∗фOM P
where λ is 1.0 for limited ductile walls and 2.0 for ductile walls and φow is the over strength factor.
NZS-3101 limits the maximum curvature ductility (at the ultimate strength of the section) in the plastic hinge region to 6 for limited ductile walls and 14 for ductile walls.
Table 2-2: Ductility properties of shear wall structures in New Zealand code (NZS 1170, 2005)
Structural system µ
Nominal ductile walls 1.25
Limited ductility walls 3.0
Single cantilever ductile walls 4/ βa Two or more cantilever ductile walls 5/βa
Two or more couple ductile walls 5/βa < µ=(3A+4)/βa < 6/βa R=µ for T > 0.7sec. and for soil class A, B, C, D
1 ≤ βa=2.5-0.5Ar ≤ 2.0
Ar: Aspect Ratio of the wall
for walls with aspect ratio more than 3 (Ar ≥ 3) βa is 1.0
A: Degree of coupling of the coupled walls, 1/3 ≤ A= [(Tw*L')/Mow] ≤ 2/3
Similar to NBCC (2015) and CSA A23.3 (2014), Eurocode 2 (2001) and Eurocode 8 (2008) consider two levels of ductility for seismic design: namely moderate ductility and high ductility. Eurocodes use the equal displacement assumption for periods larger than the corner period of the
displacement spectrum (Tc). Corner period is the period at the upper limit of the constant
acceleration region of the spectrum. Similar to the New Zealand code, the ductility factors for the shear walls with low aspect ratios are reduced. The behaviour factor ,q0, which is equivalent to
force reduction factor in the Canadian and the American codes, is defined as the following: Equation 2-10 q = qE∗ k#
The coefficients q0 and kw are given in Table 2-3. The displacement behaviour factor (qd) for shear
walls with a fundamental period larger than the spectral corner period is equal to q0.
Eurocode 8 stipulates that the rotational capacity of plastic hinge regions be such that the maximum strain in concrete does not exceed the maximum allowable strain ϵcu. In addition, the plastic hinge
curvature ductility capacity shall not exceed the following values: Equation 2-11 ST= 2 ∗ UE− 1 if T1 ≥ TC
ST= 1 + 2 ∗ (UE− 1 ) ∗VVXW if T1<TC
where q0 is the behaviour factor used in the analysis and T1 the fundamental period of the building,
both defined for the plane in which bending takes place, and TC is the corner period.
Table 2-3: Ductility properties of shear wall structures according to (Eurocode 8, 2008)
Structural system q0
Cantilever wall system Moderate Ductility 3
Cantilever wall System High ductility 4.0*(αu/α1)
For systems with only two uncoupled walls per horizontal direction: αu/α1=1.0
Other uncoupled wall systems: αu/α1=1.1
Wall-equivalent dual, or coupled wall systems: αu/α1=1.2 0.5 ≤ kw=(1+α0)/3 ≤ 1
α0: Aspect Ratio of the wall
2.4 Higher modes impact on seismic response of shear walls
Filiartault et al. (1994) carried out one of the first studies in Canada on the impact of the higher modes on the response of RC shear walls. It was proposed to apply two different amplification
factors on elastic forces; one for shear forces and the other for bending moments. This approach with some modifications is currently used in New Zealand standard (NZS 1170.5, 2004) which takes into account both elastic and inelastic amplifications due to higher modes effects. NBCC (2015), considers the impact of the higher modes on the elastic response based on the approach proposed by Humar and Rahgozar (2000). In this method, the same higher mode amplification factor (Mv) is applied to the elastic base shear and the bending moment. The elastic base shear is
then reduced by the over-strength (Ro) and ductility (Rd) reduction factors to represent the inelastic
response of the structure (Equation 2-1). Because the higher modes have more significant impact on the shear force compared to the bending moment, a modification must be made by applying a moment reduction factor (J) to the bending moment. The values of coefficients Mv and J specified
in NBCC depend on the type of the structural system, the value of the fundamental structural period and the seismic region. The amplification of the shear is closely related to the spectral shape and differs for different regions. As the ground motion records in eastern Canada have a dominant high frequency content, the impact of the higher modes in eastern Canada is more significant than in western Canada.
Although the impact of the higher modes on the elastic response of the structures have been recognized and addressed in design practice, in recent years important research efforts have been made to evaluate and estimate the impact of the higher modes on the inelastic response of shear walls. Boivin and Paultre (2012) carried out an extensive parametric study on 47 shear walls to investigate the inelastic amplification of shear forces and bending moments for shear wall structures located in western Canada. The key parameters in this study were height, aspect ratio, section profile, over-strength factor (γw) and site class. Although authors briefly reviewed the
curvature ductility demands, the main focus of this study was on the demand shear force and bending moments. From the outputs of this parametric study, it was proposed that the inelastic shear amplification due to the higher modes be expressed by a coefficient related to RoRd/γw ratio
and the fundamental period of vibration. Boivin and Paultre (2012) also proposed a new capacity design envelope for bending moments above the plastic hinge region which are amplified by a similar factor related to RoRd/γw ratio and the fundamental dynamic period.
Luu, Léger and Tremblay (2013) performed another study on the inelastic higher modes amplifications which focused on the response of shear walls located in eastern Canada. A parametric study was carried out on 35 shear walls with varying heights (between five to