DISTRIBUTION OF TEMPERATURE AND SALINITY IN THE CANADIAN ARCTIC ARCHIPELAGO DURING THE 2007 AND 2008 ARCTICNET SAMPLING
EXPEDITIONS
By
Marie-Emmanuelle Rail1 and Yves Gratton1
1
INRS-Eau, Terre et Environnement 490, de la Couronne
Québec, Qc Canada, G1K 9A9
2011, INRS-Eau, terre et environnement
CORRECT CITATION FOR THIS PUBLICATION :
Rail M.E. and Y. Gratton. 2011. Distribution of temperature and salinity in the Canadian Arctic Archipelago during the 2007 and 2008 ARCTICNET sampling expeditions. Report No R0001243, INRS-ETE, Québec (Qc): vii + 65 p.
ABSTRACT
This report presents the CTD (Conductivity, Temperature and Depth) data obtained during the 2007 and 2008 ArcticNet expeditions in the Canadian High Arctic. The report contains the logbooks and detailed maps of sampling sites for the following instruments: a CTD (Conductivity, Temperature and Depth) installed on a Rosette frame, a MVP (Moving Vessel Profiler), a SCAMP (Self Contained Autonomous Micro Profiler), a ship mounted ADCP (Acoustic Doppler Current Profiler) and various instruments attached to mooring lines. Salinity and temperature data are presented as contour plots along West-East or South-North sections. An example of SCAMP data is also included.
RÉSUMÉ
Ce rapport présente un résumé des données échantillonnées lors des missions ArcticNet tenues dans l’Arctique canadien en 2007 et en 2008. Le rapport contient un exemple des logbooks et des cartes détaillées indiquant l’emplacement des sites d’échantillonnage pour chaque instrument utilisé. Les instruments sont les suivants : un CTD (Conductivity, Temperature, Depth) attaché à une Rosette, un MVP (Moving Vessel Profiler), un SCAMP (Self Contained Autonomous Micro Profiler), un profileur de courant (ADCP) fixé sous la coque du navire et plusieurs sondes attachées à des lignes de mouillage. Les données de salinité et de température sont présentées sous forme de contours le long de sections ouest-est ou sud-nord. Un exemple des données du SCAMP est également présenté.
TABLE OF CONTENTS ABSTRACT……….. iii TABLE OF CONTENTS……….. iv LIST OF FIGURES……….. v LIST OF TABLES……… v LIST OF APPENDICES………... vi FOREWORD……… vii 1. INTRODUCTION……….. 1 2. SAMPLING PROGRAM………... 3 ROSETTE………. 3
MOVING VESSEL PROFILER (mvp) ………... 4
SELF CONTAINED AUTONOMOUS MICRO PROFILER (scamp)……... 5
MOORINGS………. 6
SHIP MOUNTED ACOUSTIC DOPPLER CURRENT PROFILER (adcp).. 9
3. DATA PROCESSING AND QUALITY CONTROL……… 10
ROSETTE-CTD DATA……… 10
MOVING VESSEL PROFILER (mvp) ………... 10
MOORINGS DATA………. 10
MOORED ADCP DATA………...……….. 11
4. DISCUSSION………..……….. 11
5. ACKNOWLEDGMENTS……….. 12
6. REFERENCES………... 12
TABLES………... 15
LIST OF FIGURES
FIGURE 1 ArcticNet study area in 2007 and 2008……….…. 1
FIGURE 2 Rosette sampling sites……… 3
FIGURE 3 MVP sections……….……… 4
FIGURE 4 SCAMP sampling sites……….. 5
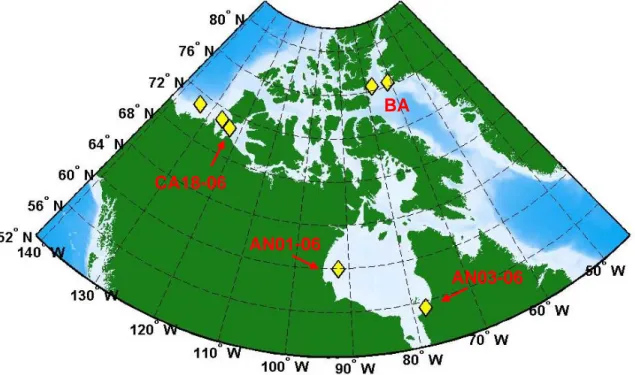
FIGURE 5 Moorings location (2006-2007)………. 6
FIGURE 6 Moorings location (2007-2008) ……… 7
FIGURE 7 Moorings location (2008-2009) ……… 8
FIGURE 8 Ship-mounted ADCP sampling sites………....…. 9
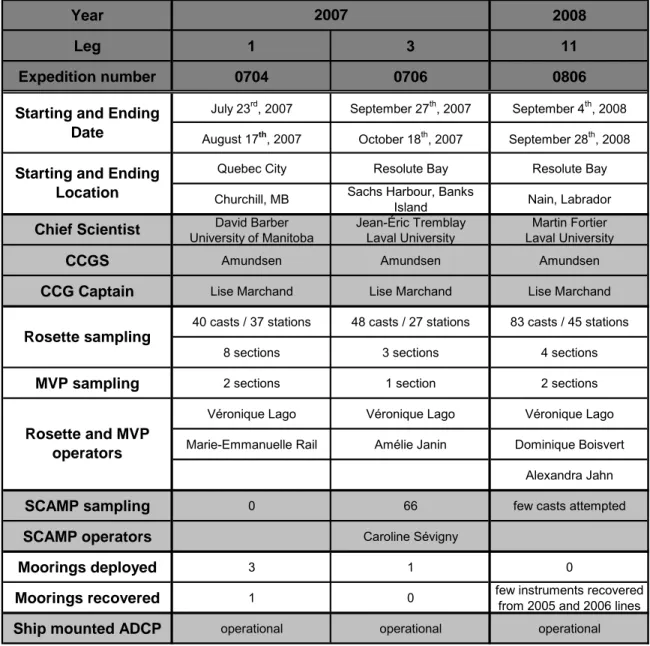
LIST OF TABLES TABLE 1 Summary of ArcticNet expeditions and sampling………...….…... 15
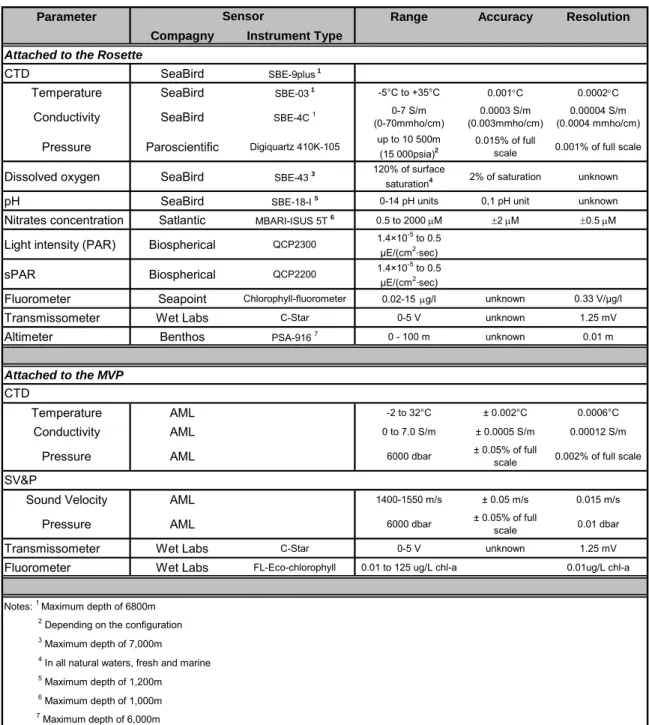
TABLE 2 Rosette and MVP sensors characteristics...………...…… 16
TABLE 3 Moored sensors characteristics……….. 17
TABLE 4a Summary of moored instruments 2006-2007……… 18
TABLE 4a&b Summary of moored instruments 2007-2008……… 19
TABLE 5 Content of the ASCII Rosette-CTD data files………... 20
LIST OF APPENDICES
APPENDIX 1 High resolution maps of Arctic areas where Rosette-CTD, MVP,
SCAMP and moorings data were collected……….……….. 21
APPENDIX 2 Rosette-CTD data logbooks……...……… 30
APPENDIX 3 List of Rosette sections with related casts and stations……...…… 35
APPENDIX 4 List of MVP sections………. 36
APPENDIX 5 Plots of salinity and potential temperature, Leg 1 (0704)…………. 37
APPENDIX 6 Plots of salinity and potential temperature, Leg 3 (0706)…………. 49
APPENDIX 7 Plots of salinity and potential temperature, Leg 11 (0806).…..……. 55
APPENDIX 8 SCAMP data logbook……….………... 63
FOREWORD : ARCTICNET AND THE NETWORK OF CENTRES OF EXCELLENCE
The Canadian Network of Centres of Excellence (NCE) is a unique joint program that brings together several universities, government agencies, industrial companies and non-profit organizations. Their mission is to increase Canada’s economy and social benefits through research and entrepreneurial programs. Three Canadian federal granting agencies the Canadian Institutes for Health Research (CIHR), the Natural Sciences and Engineering Research Council of Canada (NSERC) and the Social Sciences and Humanities Research Council of Canada (SSHRC) as well as Industry Canada, have combined their efforts to financially support and oversee the initiatives of the NCE. (NCE web site at http://www.nce.gc.ca)
ArcticNet is one of the NCE networks. The central objective of this program is to bring specialists from different fields together in order to improve our understanding of the impacts of climate change on Coastal Canadian Arctic ecosystems. Begun in 2004, ArcticNet now has over 145 researchers from 30 Canadian Universities, as well as researchers from 8 federal and 11 provincial agencies and departments. Those scientists are supported in their work by several Inuit organizations and northern communities, industrial partners, and finally others scientists from 12 different countries.
The ArcticNet Network investigators study the impact of climate change in the Canadian Arctic to assess the effect of ongoing warming and modernization on Canadian Arctic ecosystems, economies and societies, as well as to help Canadians better cope with the changes and opportunities that may occur due to climate change. ArcticNet’s structure is set to translate the growing understanding of the changing Arctic ecosystem into national policies, adaptation strategies and impact assessment studies conducted on societies and marine / terrestrial coastal ecosystems in the Canadian High Arctic, the Eastern Arctic, Hudson Bay and Eastern Sub Arctic. (Please see the ArcticNet Annual Report 2007-2009 for more information). (ArcticNet web site at
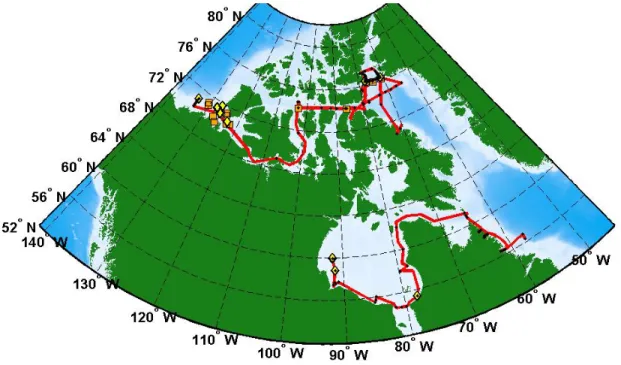
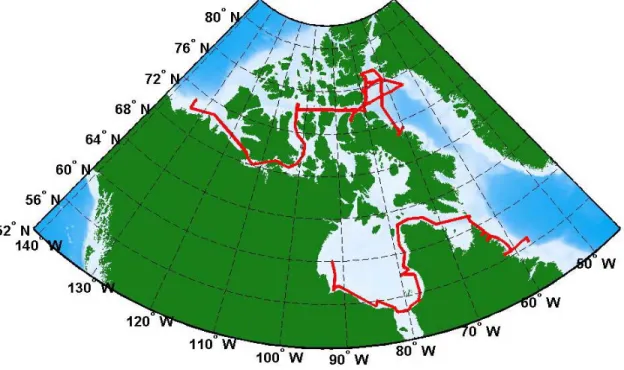
In 2007 and 2008, the ArcticNet sampling expeditions were carried out before and after the expeditions of another research program identified as CFL (Circumpolar Flaw Lead Study). This program included a year round sampling expedition to study the air-sea interactions occurring in the ice-free sections of the southern Beaufort Sea and Amundsen Gulf. Both the ArcticNet and the CFL programs required the services of the CCGS (Canadian Coast Guard Ship) Amundsen which left Quebec City on July 2007 and was set to return on October 2008. ArcticNet’s first 2007 sampling expedition (0704), called Leg 1, was held between July 23rd and August 17th. The ship sailed from Quebec City to Churchill, Manitoba. Sampling efforts were made in three Labrador fjords, in the Hudson Strait and the Hudson Bay (see Figure 1). The second 2007 ArcticNet sampling expedition (0706), called Leg 3, began on September 27th, after the ship spent six weeks visiting Inuit villages located on Cornwalis Island in Resolute Bay, allowing ArcticNet medical and social research teams to conduct their research. By mid-October, the ship had sailed into Northern Baffin Bay and had crossed the Northwest Passage. After a few more days of sampling in the Beaufort Sea, Leg 3 of the ArcticNet program ended on October 18th, when ArcticNet students and staff were replaced by CFL participants. The only 2008 ArcticNet expedition began on September 4th. The ship had spent the previous winter and summer sailing in the Beaufort Sea and was now heading to Quebec City. That expedition (0806), called Leg 11, started in Resolute Bay, sailed across the Northern Baffin Bay and ended on September 28th after the ship was called for a Search and Rescue mission.
FIGURE 1. ArcticNet 2007 and 2008 study area. Ship track is illustrated as a red line, Rosette-CTD sampling locations are represented by black dots. Mooring sites are represented by yellow diamond-shaped dots and scamp sites are represented by orange squares.
This report provides the ArcticNet community with a synthesis of the available data resulting from these three expeditions. The data set includes 171 Rosette-CTD (Conductivity, Temperature, Depth) casts, five MVP (Moving Vessel Profiler) sections and 66 SCAMP (Self Contained Autonomous Profiler) profiles. Also included are two years of data recorded by 50 different instruments recovered from nine (recuperated) mooring lines as well as current data recorded along the ship track by a ship mounted ADCP (Acoustic Doppler Current Profiler). A summary of the three legs sampling effort may be found in Table 1. High resolution maps of sampling sites are presented in Appendix 1.
Related Studies
Several published studies and scientific papers have reported on the physical oceanographic processes in the Canadian Arctic. Extensive CTD profiles were collected in the polynyas of the North Water (NOW) in northern Baffin Bay. Gratton et al. (2006) presented the NOW program data in their report and two special issues have been published, Atmosphere-Ocean (volume 29, no3, 2001) and Deep-Sea Research II (volume 49, no22-23, 2002), which also presented studies on the North Water Polynya. Stewart and Lockhart (2005) have recently carried out an extensive study on the Hudson Bay region. The oceanography of the Northwest Passage was the subject of a chapter in a special issue of «The Sea» (volume 14, part B, 2005). In this paper, McLaughlin et al. (2005) presented their comprehensive study of all the oceanographic aspects and processes encountered in the Northwest Passage and explained in details the physical and chemical oceanography of this area. The Beaufort Sea and Amundsen Gulf are the Canadian Arctic regions that have been studied the most extensively over the years, especially during the Canadian Arctic Shelf Exchange Study (CASES) program and subsequently during ArcticNet expeditions and various projects involving the Circumpolar Flaw Lead System Study (CFL) and the International Polar Year (IPY) programs. In 2008, the Journal of Geophysical Research published eleven papers from the CASES program in a special issue, volume 113, number C3. That same year, a book entitled On thin ice containing a synthesis of the work performed in every main research subject of the CASES program was edited by L. Fortier, D. Barber and J. Michaud. Simard et al. (2008) have also prepared a synthesis report regarding the CTD profiles and other physics data generated during the CASES 2002-2004 expeditions. The oceanography of the Beaufort Sea was also discussed by Ingram et al. in part «A» of the special issue of «The Sea» (volume 14, part A, 2005). Finally, a Compendium of the CFL Cruise Reports has recently been published by the University of Manitoba (Anonymous, 2009).
2. SAMPLING PROGRAM
Rosette
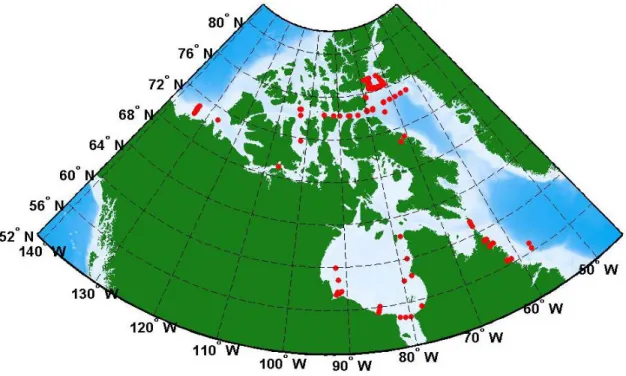
During the 2007 and 2008 expeditions, the rosette was equipped with 24 «Niskin» 12 L bottles, and a SeaBird 911+ CTD with eight independent sensors (see Table 2 for sensors characteristics). It was deployed from the ship and lowered into the water at a rate of 1 m s-1. CTD profiles were carried out in the Hudson Bay and Canadian Arctic (see Figure 2). High resolution maps of rosette sampling sites and station number are found in Appendix 1A. A total of 171 casts were obtained from 99 different stations. Rosette logbooks are presented in Appendix 2. As often as possible, station positions were selected to form section lines at strategic locations. In 2007-2008, 15 sections with a minimum of three stations each were sampled. The connection between the casts, the stations and the sections is presented in Appendix 3. Contour plots of salinity and potential temperature recorded along these sections are presented in Appendices 5, 6 and 7.
FIGURE 2. Location of the 2007 and 2008 Rosette sampling sites.
A summary of the CTD processing and quality control is presented in section 3 of this report. As a general «rule of thumb» CTD data are reserved for the ArcticNet Network Investigators for a period of 3 years. After this period, data will be hosted on the ArcticNet and/or the Integrated Service Data Management (ISDM) website and will be available to the international community.
Moving Vessel Profiler (MVP)
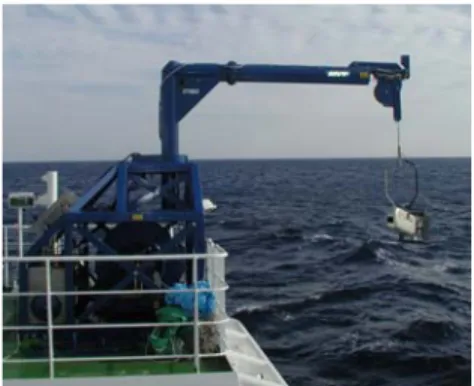
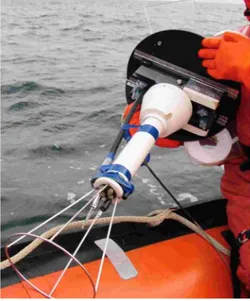
The Moving Vehicle Profiler (MVP) is a towed CTD. It is usually set in automatic mode. The “fish” (right) freefalls at ~ 5 m s-1 and is automatically winched back to 10 m under the surface after each cast. Because of these adjustments, we lose the first and last 10 meters of the water column. It is a MVP300-1700 model, meaning that it is equipped with 1700 m of cable and can profile down to 300 m at 12 knots. The slower the cruising speed the deeper the MVP can reach.
The MVP profiler was equipped with a CTD, a Sound Velocity probe, a fluorometer and a transmissometer. The characteristics of the probes are found in Table 2. Five sections and 465 profiles were carried out in the Hudson Bay and Canadian High Arctic (see Fig. 3 and Appendix 1B). A summary of the sampling data is presented in Appendix 4. Contour plots of the salinity and potential temperature recorded along the sections are presented in Appendices 5, 6 and 7.
Self Contained Autonomous Micro Profiler (SCAMP) The SCAMP is a CTD-type profiler. It samples at a frequency of 100 Hz (i.e. 100 times per second). It free falls at approximately 10 cm s-1, resulting in a vertical resolution of approximately one (1) millimetre, down to a maximum depth of 100 m. The instrument measures the temperature and fluctuations in salinity at a micro-scale in order to estimate the turbulent mixing occurring in the water column. In order to properly measure (as opposed to “estimate”) turbulence, we should also be measuring fluctuations in velocity. Unfortunately, due to budget limitations, we do not have access to a velocity sensor. The other sensors on the SCAMP include three temperature sensors, two salinity sensors (i.e. conductivity), a PAR (Photosynthetically Active Radiation) and fluorescence sensors.
SCAMP profiles were carried out in the Baffin Bay area, the Northwest Passage, the Beaufort Sea and the Amundsen Gulf (see Fig. 4 and Appendix 1C). Measurements were taken on 16 stations (66 casts) during leg 3 (0706). The logbook of SCAMP profiles is presented in Appendix 8 and an example of data profiles is presented in Appendix 9. Scamp data are not available yet. When available, processing and quality control protocols will be provided at the same time as the scamp data.
Moorings
ArcticNet moorings are identified according to the following guidelines: the letters and the first two digits represented the location (CA: Beaufort Sea; BA: Baffin Bay and AN: Hudson Bay); the last two digits are the deployment year.
The year 2006-2007 was a difficult one for moorings. Seven lines (30 instruments) were deployed in the Hudson Bay, Baffin Bay and Beaufort Sea but only two moorings (AN03-06 and CA18-06) and one current meter from AN01-06 were recovered (see Fig. 5 and Appendix 1D). AN03-06 was located in the Hudson Bay. It was recovered during the 0704 expedition. Three of the four probes deployed on this mooring were recovered with the line, but only two RCMs (Recording Current Meter) had recorded data properly. CA18-06 was moored in the Amundsen Gulf in the Western Arctic. Unfortunately, only the two deepest RCMs were recovered. The upper part of the line was apparently snapped by ice. Michaud et al. (2007) have summarized all the problems encountered in their technical report.
BA
CA18-06
AN01-06
AN03-06
FIGURE 5. Mooring locations are identified by the yellow diamond-shaped dots. Seven moorings were deployed in 2006 but only two were recovered in 2007.
Between ArcticNet expeditions 0706 and 0806, the CCGS Amundsen was mobilized with another research program call CFL (Circumpolar Flaw Lead Study). As many of the principal investigators and technical staff of ArcticNet were also involved with the CFL program, the 2007 and 2008 mooring activities in the Western High Arctic were conducted during the CFL expeditions (second half of 0706 and 0805).
Ten moorings were deployed in 2007 (expedition 0704 and second half of 0706 during the CFL program). Three lines (ten instruments) were deployed in the Hudson Bay and seven lines (49 instruments) were deployed in the southern Beaufort Sea (see Fig. 6 and Appendix 1D) including two MMPs. The MMP is a moving profiler sliding up and down along the mooring line recording temperature, salinity and fluorescence data. These two moorings were deployed next to the “classic” moorings CA05 and CA16 and were named accordingly CA05mmp and CA16mmp.
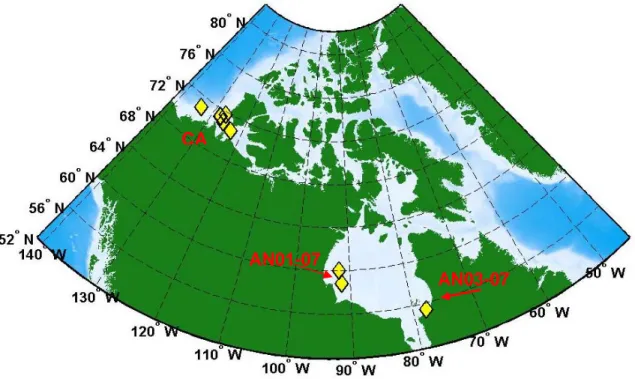
Two of the moorings located in the Hudson Bay, AN01-07 and AN03-07 were recovered in 2009 during the BaySys expedition conducted on the CCGS Pierre Radisson. Only one instrument provided reliable data. Six of the seven moorings located in the Beaufort Sea were recovered in 2008 (expedition 0805) and redeployed for another year of measurements (see Fig. 7 and Appendix 1D). The instruments characteristics are presented in Table 3 and the details about the 41 recovered instruments are found in Table 4a and 4b.
CA
AN01-07
AN03-07
FIGURE 6. Moorings deployed in 2007 and recovered in 2008 (or 2009). Mooring locations are identified by the yellow diamond-shaped dots.
CA
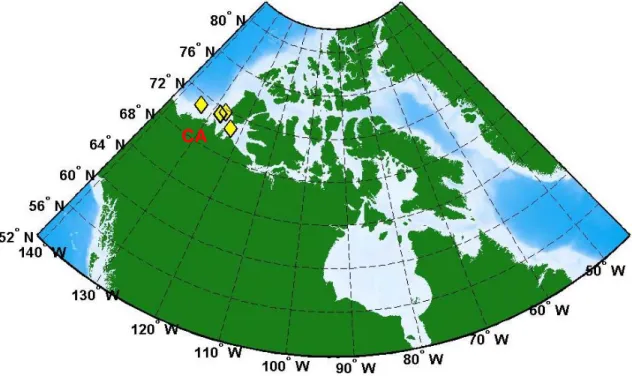
FIGURE 7. Six moorings were deployed in 2008. Mooring locations are identified by the yellow diamond-shaped dots.
Ship mounted Acoustic Doppler Current Profiler (ADCP)
In 2007 and 2008, the CCGS Amundsen was equipped with a ship-mounted RDI Ocean Surveyor 150 kHz ADCP. The settings used for these expeditions were chosen according to the recommendations of the RDI technical staff. Attempts were done to synchronize the hull ADCP with another sensor (an EK-60) mounted close to the ADCP on the Amundsen’s hull but interferences were still occurring.
The hull ADCP recorded current data along the ship’s track from the beginning to the end of the expeditions (see Fig 8). Ship-mounted ADCP data includes date and time, ship location, and finally an average of current speed and current direction for every 8 m cell from 8 m under the ship hull to maximum 250 m. Averages are available for a 5-minute and 10-5-minute periods. Because of sound attenuation by the ice window, the maximum bottom-tracking depth is around 240 m. This value is reduced to 100-150 m when the ship is steaming.
Data validation was not performed. Tests were done at the beginning of the 2006 expedition in the St Lawrence River near Sept-Îles and the collected data was saved for use in future data validation processes. Note that the raw data is available upon request.
3. DATA PROCESSING AND QUALITY CONTROL
Rosette-CTD data
The Rosette data processing and quality control are described in details by Guillot (2007a, 2007b, 2007d and 2008). The «READ ME » file attached to each yearly CTD data set also presents the most important processing steps and corrections applied to the data files. All users should read these files so they can be aware of data limitations.
Processing included the following steps: validation of the calibration coefficients, conversion of data to physical units, alignment correction and extraction of useless data. Oxygen sensor calibration was done using Winkler titrations and salinity data were compared with water samples analysed with a Guildline 8400B Autosal. The CTD data were passed through a set of quality control tests based on UNESCO’s algorithm standards (1990). The recorded data were averaged every 1 dbar. The computed oceanographic parameters were calculated using the averaged data. Missing data were linearly interpolated. Lastly, there is one ASCII file for every CTD cast. The variables and units in a typical ASCII file are shown in Table 5.
CTD profiles cover the water column down to 10 meters from the sea-bed. To reduce the amount of information presented in this report, temperature and salinity contours are only provided for each section presented in Appendix 3. The contours are presented in Appendices 5, 6 and 7. One cast was selected for every station location in the interpolation process. The temperature and salinity data were interpolated on a 5 km by 5 m grid with a triangle-based cubic interpolation method and contoured in Matlab®. The origin of each section is the westernmost or southernmost cast. For the West-East sections, West is on the left and East on the right; for the South-North sections, South is on the left and North on the right. The colorbar scales are the same for all sections of a same expedition regardless of the instrument used. More information is found in Table 6. MVP data
MVP profiles cover the water column from 10 meters of the surface down to 10 meters from the sea-bed. The temperature and salinity contours are provided for each section shown in Appendix 4. The contours are presented in Appendices 5, 6 and 7. The temperature and salinity data were averaged every 1 dbar but were not interpolated. The contours plots use the original data. The origin of each section is the westernmost or southernmost cast. For the West-East sections, West is on the left and East on the right; for the South-North sections, South is on the left and North on the right.
Mooring data
Processing steps for mooring data are described in Boisvert (2010a and 2010b). It consisted of meta-data and calibration coefficients validation, control of the instrument depth and clock, and comparison of mooring data with Rosette-CTD data recorded at the same location. Instrument depth and salinity data were corrected by adding an offset
when needed. Erroneous time tags were corrected. Missing data and questionable data are mentioned in the quality control report, and they were replaced by NaNs (Not a Number). Users should consult the Quality Control Report (Boisvert 2010a and 2010b). ASCII files were created for each instrument (see Table 4a and 4b).
Moored ADCP data
The processing and quality control of ArcticNet ADCP data are still ongoing. The quality control procedures on ADCP data were adapted from the «ADCPtools» toolbox of the U.S. Geological Survey’s «Sediment Transport Instrumentation Group». The «ADCPtools» functions used by the USGS were adapted to the peculiarities of ArcticNet’s data. The tests include the validation of the calibration, data and meta-data. The modified tests used are based on comparisons between data and defined «thresholds». If a data point does not meet the thresholds it is rejected and all its associated data points are then considered as «questionable». A document presenting in details the finalized procedures of processing and quality control of ADCP data is available (Guillot, 2007c).
4. DISCUSSION
The International Polar Year 2007-2008 was a major sampling year for the CCGS Amundsen: three ArcticNet, six-week legs and eight CFL six-week legs. The sampling area covered by the ArcticNet 2007 expedition was huge (as usual): Hudson Bay and Strait, northern Baffin Bay, Canadian Arctic Archipelago, Amundsen Gulf and southern Beaufort Sea. Between legs 0706 and 0806 the CCGS Amundsen spent the winter of 2007-2008 in Amundsen Gulf. We also obtained, for the first time, a section across the Northwest Passage: from 65°W to 130° W, roughly. The eastern part of the section was sampled in expedition 0706 and the western part of the section was covered in expedition 0804.
The CFL expeditions (legs 0707 to 0805) are not covered in this report. However, it is worth mentioning that McLure Strait was sampled for the first time in history in leg 0804. That year (2008) we have “closed” Parry Channel with two MVP sections: one at the mouth of Lancaster Sound (leg 0806) and one at the mouth of McLure Strait (leg 0804). Numerous eddies were also observed in the winter of 2007-2008 from ship-based data (CTD) and mooring data (MMPs).
Hudson Bay was covered at large for a second time. The first time was in ArcticNet expedition 0502. In 2008, a set of four moorings were deployed across Hudson Strait in collaboration with Woods Hole Oceanographic Institute (Dr. Fiamma Straneo). Details will be presented in the 2009 ArcticNet report.
5. ACKNOWLEDGMENTS
We thank Captains Julien and Marchand and their crew aboard the CCGS Amundsen for their outstanding collaboration. We also thank the «Rosette team», Véronique Lago, Amélie Janin, Dominique Boisvert and Alexandra Jahn, and all the «Rosette monkeys» for their outstanding sampling effort cast after cast after cast. Thanks to the mooring team: Luc Michaud, Pascal Massot, Sylvain Blondeau, Alexandre Forest, Louis Létourneau and Steeve Gagné. Thanks to Caroline Sévigny for its zodiac outings in order to obtain the SCAMP profiles. And last but not least, many thanks to Pascal Guillot for his data processing efforts.
6. REFERENCES
Anonymous, 2009. CFL Scientific Cruise Report Compendium, Vol. I (legs 3-6) and II (legs 7-10). University of Manitoba Press, 786 p.
Blondeau, S., P. Massot, A. Forest, and L. Létourneau. 2006. Mooring Operation Cruise Report ArcticNet 2006 – Leg 1. Internal report, Laval University, Québec (Qc): 3 p. Boisvert, D. 2010a. Contrôle de Qualité des données de mouillage de 2006-2007.
Boisvert, D. 2010b. Contrôle de Qualité des données de mouillage de 2007-2008. Fortier, L. D. Barber and J. Michaud [Eds], 2008. On thin Ice. Aboriginal Issues Press,
Winnipeg, 215 p.
Gratton, Y., M. Ouellet, M.E. Rail, and R.G. Ingram. 2006. Distribution of temperature and salinity in Northern Baffin Bay during the International North Water program (August 1997, April to July 1998, and September 1999). Internal Report No R897, INRS-ETE, Québec (Qc): x + 124 p.
Guillot, P. 2007a. Processing notes about the ArcticNet 0704 data. Technical Report, Québec-Océan, Université du Québec à Rimouski: 28 p.
Guillot, P. 2007b. Processing notes about the joined ArcticNet and CFL 0706 data. Technical Report, Québec-Océan, Université du Québec à Rimouski: 75 p.
Guillot, P. 2007c. Rapport de traitement de données Workhorse ADCP (Acoustic Doppler Current Profiler). Technical report, draft version, Québec-Océan, Université du Québec à Rimouski, 99 p.
Guillot, P. 2007d. Sea-Bird CTD Processing and Quality Control Procedure. Technical report, draft version, Québec-Océan, Université du Québec à Rimouski: 44 p.
Guillot, P. 2008. Processing notes about the ArcticNet 0806 data. Technical Report, Québec-Océan, Université du Québec à Rimouski: 44 p.
Ingram, R.G., E.C. Carmack, F.A. McLaughlin, and S. Nicol. 2005. Polar Ocean Coastal Boundaries, chapter 3 in: The SeaIdeas and Observations on Progress in the Study of the Seas, Volume 14 part A, A.R. Robinson and K.H. Brink (eds), Harvard University Press, Cambridge: pp. 61-81.
Lago, V. and A. Janin. 2007. ArcticNet 0706 – Physical team sampling report from September 27th to November 8th on board the CCGS Amundsen. Technical Report (Unpublished), INRS-ETE, Québec (Qc), 5 p.
Lago, V., D. Boisvert and A. Jahn. 2008. ArcticNet 0806 – Physical team sampling report from September 4th to September 28th on board the CCGS Amundsen. Technical Report (Unpublished), INRS-ETE, Québec (Qc), 12 p.
Lanos, R., 2009. Circulation générale, masses d’eau, cycles d’évolution et transports entre la mer de Beaufort et le Golfe d’Amundsen. Ph.D. Thesis, INRS-ETE, September 2009.
McLaughlin, F.A., E.C. Carmack, R.G. Ingram, W.J. Williams, and C. Michel. 2005. Oceanography of the Northwest Passage, chapter 31 in: The SeaIdeas and Observations on Progress in the Study of Seas, Volume 14 part B, A.R. Robinson and K.H. Brink (eds), Harvard University Press, Cambridge: pp. 1213-1244.
Melling, H. 1999. Observations by moored instruments in Northern Baffin Bay 1997-1998. Unpub. Rep., Institute of Ocean Sciences, Sydney, B.C.: 37 p.
Michaud, L., P. Massot, S. Gagné, L. Létourneau. 2007. ArcticNet cruise report – Leg 3 – Mooring operation. Technical Report (Unpublished), Laval University, Québec (Qc), 9 p.
Rail, M.E. and V. Lago. 2007. ArcticNet 0704 – Physical team sampling report from July 26th to August 17th on board the CCGS Amundsen. Technical Report (Unpublished), INRS-ETE, Québec (Qc), 4 p.
Simard, A., M.E. Rail, and Y. Gratton. 2010a. Distribution of temperature and salinity in the Beaufort Sea during the Canadian Arctic Shelf Exchange Study sampling expeditions 2002-2004. Report No 1187, INRS-ETE, Québec (Qc): vii + 128 p. Simard, A., M.E. Rail, and Y. Gratton. 2010b. Distribution of temperature and salinity in
the Canadian Arctic Archipelago during the 2005 ARCTICNET sampling expedition (from August 5th to October 27th 2005). Report No R1126, INRS-ETE, Québec (Qc): vi + 79 p.
Simard, A., M.E. Rail, and Y. Gratton. 2010c. Distribution of temperature and salinity in the Canadian Arctic Archipelago during the 2006 ARCTICNET sampling expedition (from August 22nd to November 9th 2006). Report No R1127, INRS-ETE, Québec (Qc): vi + 79 p.
Stewart, D.B., and Lockhart, W.L. 2005. An overview of the Hudson Bay marine ecosystem. Can. Tech. Rep. Fish. Aquat. Sci. 2586: vi + 487 p.
TABLE 1. Summary of the three 2007 and 2008 ArcticNet expeditions.
Year 2008
Leg 1 3 11
Expedition number 0704 0706 0806
July 23rd, 2007 September 27th, 2007 September 4th, 2008
August 17th, 2007 October 18th
, 2007 September 28th, 2008
Quebec City Resolute Bay Resolute Bay
Churchill, MB Sachs Harbour, Banks
Island Nain, Labrador
David Barber Jean-Éric Tremblay Martin Fortier University of Manitoba Laval University Laval University
CCGS Amundsen Amundsen Amundsen
CCG Captain Lise Marchand Lise Marchand Lise Marchand 40 casts / 37 stations 48 casts / 27 stations 83 casts / 45 stations
8 sections 3 sections 4 sections
MVP sampling 2 sections 1 section 2 sections
Véronique Lago Véronique Lago Véronique Lago Marie-Emmanuelle Rail Amélie Janin Dominique Boisvert
Alexandra Jahn
SCAMP sampling 0 66 few casts attempted
SCAMP operators Caroline Sévigny
Moorings deployed 3 1 0
Moorings recovered 1 0 few instruments recovered
from 2005 and 2006 lines
Ship mounted ADCP operational operational operational
2007
Starting and Ending Date
Starting and Ending Location
Rosette and MVP operators Chief Scientist
TABLE 2. Characteristics of Rosette and MVP sensors used during ArcticNet 2007-2008 sampling expeditions.
Parameter Range Accuracy Resolution
Compagny Instrument Type
CTD SeaBird SBE-9plus 1
Temperature SeaBird SBE-03 1 -5°C to +35°C 0.001C 0.0002C
Conductivity SeaBird SBE-4C 1 0-7 S/m
(0-70mmho/cm)
0.0003 S/m (0.003mmho/cm)
0.00004 S/m (0.0004 mmho/cm)
Pressure Paroscientific Digiquartz 410K-105 up to 10 500m (15 000psia)2
0.015% of full
scale 0.001% of full scale
Dissolved oxygen SeaBird SBE-43 3 120% of surface
saturation4 2% of saturation unknown
pH SeaBird SBE-18-I 5 0-14 pH units 0,1 pH unit unknown
Nitrates concentration Satlantic MBARI-ISUS 5T 6 0.5 to 2000 M 2 M 0.5 M
Light intensity (PAR) Biospherical QCP2300 1.4×10
-5 to 0.5
μE/(cm2·sec)
sPAR Biospherical QCP2200 1.4×10
-5 to 0.5
μE/(cm2·sec)
Fluorometer Seapoint Chlorophyll-fluorometer 0.02-15 g/l unknown 0.33 V/μg/l
Transmissometer Wet Labs C-Star 0-5 V unknown 1.25 mV
Altimeter Benthos PSA-916 7 0 - 100 m unknown 0.01 m
Temperature AML -2 to 32°C ± 0.002°C 0.0006°C
Conductivity AML 0 to 7.0 S/m ± 0.0005 S/m 0.00012 S/m
Pressure AML 6000 dbar ± 0.05% of full scale 0.002% of full scale
Sound Velocity AML 1400-1550 m/s ± 0.05 m/s 0.015 m/s
Pressure AML 6000 dbar ± 0.05% of full scale 0.01 dbar
Transmissometer Wet Labs C-Star 0-5 V unknown 1.25 mV
Fluorometer Wet Labs FL-Eco-chlorophyll 0.01 to 125 ug/L chl-a 0.01ug/L chl-a Sensor
Notes: 1 Maximum depth of 6800m 2 Depending on the configuration
7 Maximum depth of 6,000m
Attached to the MVP Attached to the Rosette
3 Maximum depth of 7,000m 4 In all natural waters, fresh and marine 5 Maximum depth of 1,200m 6 Maximum depth of 1,000m
CTD
TABLE 3. Characteristics of instruments moored in 2006, 2007 and 2008.
Parameters Range Resolution Accuracy
Current speed 2.5 to 250 cm/sec ± 1 cm/sec
Current direction 0.35o ± 7.5o / ± 5o
Temperature -2.46°C to 21.48°C 0.1% of selected Range ± 0.05°C Conductivity 0 to 77 mmho/cm 0.1% of Range ± 0.025 mmho/cm
Current speed 2 to 250 cm/sec ± 1 cm/sec
Current direction 0.35o ± 7.5o / ± 5o
Temperature -2.46°C to 5.62°C 0.1% of selected Range ± 0.05°C Conductivity 0 to 74 mmho/cm 0.1% of Range ± 0.025 mmho/cm
Current speed 0-300 cm/s 0.3 cm/s ± 1% of reading
Current direction 0.35° ± 7.5o / ± 5o
Temperature -3.01 to 5.92 °C 0.1% of Range ± 0.05°C Conductivity 24 to 38 mS/cm 0.002 mS/cm ± 0.05 mS/cm
Pressure 0 to 20 Mpa 0.1% of Range ± 0.25% Range Turbidity 0 to 20 NTU 0.1% of full scale 2% of full scale
Oxygen 0 to 500µM <1 µM <8µM
Conductivity 0 to 60 mS/cm 0.001 mS/cm ±0.05 mS/cm
Temperature -5 to 40°C 0.001°C ±0.05°C
ALW Luminosity 0-5000 µmol/s/m² 0.1µmol/s/m² ±1%
Temperature -5 to 40 °C 0.001°C ±0.05°C
Chlorophyll 0-400 ppb 0.01 ppb ±1%
Turbidity 0-1000 NTU 0.03 NTU ±2%
Conductivity 0-85mS/cm ~1μS/cm ±0.003 mS/cm
Temperature -5˚C to 35˚C <0.00005˚C ±0.002˚C Pressure 0-2000 dbar <0.001% full scale ±0.05% full scale
Turbidity 0 to 2,500 NTU - ±2% of value
Oxygen 0-200% - ±2% Temperature -4 to 40 °C 0.01°C 0.1°C Pressure 200 dbar <0.005% 0.5% Velocity ±5m/s - 1% ±0.5cm/s Direction 0.1° 2° Temperature -5°C to 35°C 0.0002°C 0.001°C Conductivity 0-70 mS/cm 0.0004 mS/cm 0.003 mS/cm Pressure 0 to 10 500 m 0.001% of full scale 0.015% of full scale
Temperature -5 to 35°C 0.001°C 0.01°C
Pressure Tide 0 to 270 m 0.2 mm / 0.01 mm 0.01% of full Range Pressure Wave 0 to 270 m 0.4 mm / 0.1 mm 0.01% of full Range
Conductivity 0 to 70 mS/cm 0.0001 mS/cm 0.003 mS/cm
Temperature -5 to 35°C 0.0001°C 0.002°C
Pressure 0 to 7000 m 0.002% of full Range 0.1% of full Range
SBE37 Sea-Bird Electro nics In c. A qu a dop p N ortek In c. CTD 911+ SBE-26 ACTW ACLW R ocklan d O ceano grap hic S ervices Inc. X R -420 RBR RC M -4 RC M -7 RCM-11 Aan deraa Dat a Inst rum ent s
TABLE 4a. Summary of the instruments moored in 2006 or 2007 and recovered a year after for the benefit of the ArcticNet program.
Mooring Water
depth Position Instrument Serial No Instr. Depth (m) Date of first reliable data Date of last reliable data T (°C) Cond (mS/cm) Press (dbar) Spd (m/s) Dir (true) Turb (FTU) Oxy (% or µmol) Chl Luminosity
(µmol/m²s) Quality Control Comments ALEC CT 686 14
RCM4 4640 25 2006-09-14 17:02 2007-08-03 12:10 Approximative time tags
RCM4 740 69 2006-09-16 14:55 2007-08-09 17:04 Speed and direction invalid before 2006-10-12 20:27:52; Approximative time tags WH-ADCP 296 89
ALEC CLW 285 17 RCM 11 274 48 WH-ADCP 7844 89
RCM 11 272 216 2006-10-18 17:29 2007-05-16 18:54
Data was still recorded following 2007-05-16 18:54 but seemed unreliable. Pressure inconsistent.
RCM 7 10301 501 2006-10-18 18:00 2007-10-25 15:00 Speed and pressure recorded, but no valid calibration available AN03-06 134 LOST 55° 24.44' N 077° 55.70' W NO DATA RECORDED CA18-06 543 70° 39.91' N 122° 59.55' W LOST LOST LOST Mooring Water
depth Position Instrument Serial No Instr. Depth (m) Date of first reliable data Date of last reliable data T (°C) Cond (mS/cm) Press (dbar) Spd (m/s) Dir (true) Turb (FTU) Oxy (% or µmol) Chl Luminosity
(µmol/m²s) Quality Control Comments RBR-XR 10421 34 2007-10-18 01:30 2008-07-29 03:55
Aquadopp 2752 34
RBR-XR 13210 92 2007-10-18 01:24 2008-07-29 04:02 Problems with pressure sensor Continental 6075 79 2007-10-18 01:40 2008-07-29 03:40
SBE 37 1697 213 2007-10-18 01:40 2008-07-29 03:50 Aquadopp 2747 213
RBR-XR 13209 285
Aquadopp 2688 285 2007-10-18 02:00 2008-06-26 00:30 Several data points are missing ACLW 877 34 2007-10-23 00:00 2008-07-25 00:00
RBR-XR 10424 35 2007-10-23 00:00 2008-07-25 01:00 ALW 71 35 2007-10-23 00:00 2008-07-25 00:00 ACLW 883 46 2007-10-23 00:00 2008-07-25 00:00 ACTW 151 46 2007-10-23 00:00 2008-07-25 00:00
RBR-XR 10420 89 2007-10-23 00:00 2008-02-19 22:30 Several data points are missing; Offset correction applied to salinity data Continental 6088 88 2007-10-23 01:00 2008-07-25 00:40
RCM11 285 178 2007-10-22 21:29 2008-01-10 00:29 Several data points are missing SBE26 371 192 CA04-07 306 71° 04.87' N 133° 38.11' W CA05-07 200 71° 18.82' N 127° 36.14' W NO DATA RECORDED NO DATA RECORDED NO DATA RECORDED NO DATA RECORDED
TABLE 4b. Summary of the instruments moored in 2007 and recovered in 2008 for the benefit of the ArcticNet program. (Lines were
actually deployed in October 2007 and recovered in July 2008 during CFL expeditions). AN01-07 was recovered in Summer 2009.
Mooring Water
depth Position Instrument Serial No Instr. Depth (m) Date of first reliable data Date of last reliable data T (°C) Cond (mS/cm) Press (dbar) Spd (m/s) Dir (true) Turb (FTU) Oxy (% or µmol) Chl Luminosity
(µmol/m²s) Quality Control Comments CA05 MMP-07 234 71° 24.20' N 127° 38.11' W MMP 12138-05 40-130 2007-10-23 2008-07-24 ACLW 886 24 2007-10-31 06:00 2008-07-27 00:00 ALW 67 29 2007-10-31 06:00 2008-07-27 00:00 ACTW 146 40 2007-10-31 06:00 2008-07-27 00:00 ACLW 885 40 2007-10-31 06:00 2008-07-27 00:00 ALW 72 40 2007-10-31 06:00 2008-07-27 00:00
RBR-XR 13203 79 2007-10-31 06:00 2008-07-27 00:47 Offset correction applied to salinity data Continental 6081 79 2007-10-31 06:00 2008-07-28 00:40
Aquadopp 2754 222 2007-10-31 06:00 2008-07-27 00:00
SBE 37 1695 222 2007-10-31 06:00 2008-07-27 00:40 Problems with pressure sensor RBR-XR 13206 377 2007-10-31 06:00 2008-07-27 00:47 Offset correction applied to salinity data Aquadopp 2793 383 2007-10-31 06:00 2008-07-27 00:00
ACTW 150 26
ACTW 149 41 2007-10-21 01:00 2008-07-22 18:00 Conductivity data are not reliable after 2008-07-04 21:00
RBR-XR 10422 87 2007-10-21 01:00 2008-07-22 19:05 Continental 6085 85 2007-10-21 01:00 2008-07-22 19:00
Aquadopp 2778 222 2007-10-21 01:00 2008-07-15 01:00 Some data points are missing RBR-XR 13205 222
RBR-XR 13211 291 2007-10-21 01:00 2008-07-22 19:05 Problems with pressure sensor; Offset correction applied to salinity data Aquadopp 2746 291 2007-10-21 01:00 2008-07-22 19:00 CA16 MMP-07 356 71° 45.21' N 126° 30.33' W MMP 12138-03 40-190 2007-10-21 2008-07-23 RCM11 280 23 ACTW 148 77 2007-08-16 08:00 2008-09-19 10:59 WH-ADCP 333 77 No reliable data NO DATA RECORDED BROKEN NO DATA RECORDED CA08-07 397 71° 03.23' N 126° 01.36' W CA16-07 309 71° 47.42' N 126° 29.58' W AN01-07 106 59° 58.64' N 91° 56.63' W
TABLE 5. Content of the ASCII Rosette-CTD data files.
Parameters Units Number of
significant digits
Pressure (or depth) dbars 2
Temperature C (ITS-90) 3
Transmissivity % 2
Fluorescence μg/l 2
Salinity PSS (1978) 3
Density, (S,T,P) kg/m3 2
Specific volume anomaly 10-8 m3/kg 0 N2: Brunt-Väisälä frequency 1/sec2 2 Density; (S,T,O) kg/m3 3 Potential temperature (θ) C 3 θ; Sθ,O) kg/m 3 3 Freezing temperature C 2
Dissolved oxygen concentration ml/l 4
pH no units 3
Nitrates mmol/m3 2
PAR pressure dbars 2
PAR μEinsteins/m2/sec 3
Surface PAR μEinsteins/m2/sec 3
TABLE 6. Maximum and minimum values used to draw salinity and temperature contour plots from the Rosette-CTD and the MVP data (appendices 5, 6 and 7). Values
were fixed for all sections of a same expedition regardless of the instrument used.
Leg Expedition
Number Number Minimum Maximum Minimum Maximum
1 0704 21 35 -2 12
3 0706 26 35 -2 2
11 0806 28 35 -2 5
APPENDIX 1. High resolution maps of Arctic areas where Rosette-CTD, MVP, SCAMP and moorings data were collected.
1A. Rosette-CTD sampling sites in Labrador fjords, Hudson Bay, Baffin Bay, Northwest Passage and Beaufort Sea (Legs 1, 3 and 11).
1B. MVP sampling sites in Hudson Bay, Baffin Bay, Northwest Passage and Beaufort Sea (Legs 1, 3 and 11).
1C. SCAMP sampling sites in Baffin Bay, Northwest Passage and Beaufort Sea (Leg 3). 1D. Moorings recovered and deployed in Hudson Bay, Baffin Bay and Beaufort Sea
Hudson Bay and Labrador fjords (Leg 1 - 0704)
Baffin Bay, Northwest Passage and Beaufort Sea (Leg 3 - 0706) APPENDIX 1A. Location of the Rosette-CTD sampling sites during the 2007 expeditions. Numbers represent station name (not to be confused with cast number).
Baffin Bay (Leg 11)
APPENDIX 1A. Location of the Rosette-CTD sampling sites during the 2008 expedition. Numbers represent station name (not to be confused with cast number).
Inukjuak James
Bay
Hudson Bay and Labrador fjords (Leg 1 - 0704)
NOW S5
Baffin Bay, Northwest Passage and Beaufort Sea (Leg 3 - 0706) APPENDIX 1B. Location of the MVP sections during the 2007 expeditions.
Lancaster Sound, East
Gibbs Fjord
Baffin Bay (Leg 11)
Hudson Bay (2006-2007)
Beaufort Sea (2006-2007)
APPENDIX 1D. Moorings deployed in September and October 2006. Only two lines (AN03 and CA18) were recovered in 2007.
Hudson Bay (2007-2009)
Beaufort Sea (2007-2008)
APPENDIX 1D. Moorings deployed in 2007 and recovered in 2008. There were two different lines deployed on station CA05 and CA16. The second line was used for a single instrument know as a MMP. Moorings in Hudson Bay were recovered in 2009.
Beaufort Sea (2008-2009)
APPENDIX 1D. Six moorings were deployed in 2008. As for the 2007-2008 sampling year, there were two different lines deployed on station CA05 and CA16. The second line
APPENDIX 2. Rosette-CTD logs, they included cast locations, sampling time, water depth and corresponding station or mooring numbers during 2007 and 2008 ArcticNet
scientific expeditions.
2A. Rosette logbook for Leg 1 (expedition 0704) 2B. Rosette logbook for Leg 3 (expedition 0706) 2C. Rosette logbook for Leg 11 (expedition 0806)
APPENDIX 2A. Rosette cast locations, sampling time, water depth and corresponding stations or mooring numbers during ArcticNet expedition 0704.
Cast number Station or mooring Start date UTC Start time UTC Latitude (North) Longitude (West) Sea bottom depth (m) Cast depth (m) 001 mak-1 2007-07-30 02:05 56o18.338 057o23.092 1466 899 002 mak-2 2007-07-30 21:11 56o47.155 057o17.816 2027 901 003 621 2007-07-31 11:06 56o24.994 061o30.986 110 102 004 622 2007-07-31 12:20 56o24.980 061o44.012 83 78 005 623 2007-07-31 13:54 56o26.579 061o55.992 95 82 006 624 2007-07-31 15:28 56o25.141 062o04.411 62 50 007 620 2007-07-31 22:02 56o24.044 061o13.112 70 59 008 617 2007-08-01 16:10 58o29.975 062o41.417 139 124 009 610 2007-08-01 20:08 58o31.324 062o50.332 120 117 010 612 2007-08-01 20:57 58o28.175 062o59.275 33 29 011 613 2007-08-01 21:54 58o28.973 063o13.979 253 230 012 614 2007-08-01 23:34 58o24.006 063o23.311 113 106 013 615 2007-08-02 00:49 58o19.174 063o32.261 130 121 014 600 2007-08-02 10:33 59o05.310 063o 25.832 202 192 015 601 2007-08-02 13:34 59o02.666 063o37.258 140 139 016 602 2007-08-02 15:26 59o03.230 063o52.069 158 142 017 604 2007-08-02 19:25 58o59.518 063o53.663 55 50 018 356 2007-08-03 08:25 60o44.660 064o40.870 296 279 019 354 2007-08-03 11:08 60o59.947 064o45.760 518 500 020 352 2007-08-03 14:03 61o 15.962 064o48.901 268 258 021 698 2007-08-05 06:24 62o08.082 078o42.427 149 143 022 699 2007-08-05 17:19 59o59.968 078o26.099 88 80 023 701 2007-08-06 06:46 58o23.272 078o22.415 84 80 024 700 2007-08-06 19:22 58o00.588 079o52.943 140 134 025 702 2007-08-09 18:21 55o24.533 077o55.261 122 116 026 702 2007-08-09 20:47 55o24.612 077o55.766 142 131 027 702 2007-08-10 13:12 55o 24.420 077o55.850 136 122 028 703 2007-08-10 21:33 54o40.608 079o57.199 46 32 029 703a 2007-08-11 05:01 54o42.988 080o50.074 92 80 030 704 2007-08-11 10:45 54o45.800 081o43.022 34 23 031 704a 2007-08-12 03:33 56o02.264 084o41.699 100 95 032 704b 2007-08-12 07:39 55o44.351 084o50.087 67 53 033 704c 2007-08-12 11:27 55o31.586 084o57.194 33 22 034 705c 2007-08-13 21:46 57o42.587 090o54.085 37 25 035 705b 2007-08-13 23:52 57o34.124 091o23.939 41 32 036 705 2007-08-14 06:51 57o41.658 091o 38.488 44 36 037 705a 2007-08-14 16:25 57o26.726 091o53.507 44 31 038 706 2007-08-15 10:56 58o46.854 091o31.177 81 68 039 707 2007-08-15 22:04 59o58.640 091o56.772 102 92 040 707 2007-08-16 09:20 59o58.654 091o57.235 100 92
APPENDIX 2B. Rosette cast locations, sampling time, water depth and corresponding stations or mooring numbers during ArcticNet expedition 0706.
Cast number Station or mooring Start date UTC Start time UTC Latitude (North) Longitude (West) Sea bottom depth (m) Cast depth (m) 001 100 2007-09-28 22:39 74o23.333 080o12.150 716 690 002 101 2007-09-29 18:10 76o24.223 077o25.227 336 320 003 101 2007-09-29 20:29 76o26.057 077o27.409 316 304 004 101 2007-09-29 23:14 76o27.749 077o25.250 266 254 005 103 2007-09-30 09:11 76o21.473 076o37.382 146 136 006 105 2007-09-30 14:51 76o17.722 075o44.075 320 309 007 105 2007-09-30 16:47 76o16.298 075o50.742 347 344 008 105 2007-09-30 17:43 76o15.391 075o54.569 357 350 009 115 2007-10-01 14:53 76o19.873 071o14.452 684 660 010 115 2007-10-01 18:48 76o22.224 071o18.236 633 615 011 115 2007-10-01 23:38 76o19.657 071o22.121 687 663 012 113 2007-10-02 07:04 76o19.123 072o11.852 570 550 013 111 2007-10-02 09:33 76o18.370 073o13.616 600 595 014 111 2007-10-02 12:41 76o18.380 073o13.060 596 588 015 111 2007-10-02 15:32 76o18.054 073o05.908 591 597 016 108 2007-10-03 02:08 76o13.537 074o43.343 451 442 017 108 2007-10-03 10:07 76o15.467 074o37.379 447 440 018 108 2007-10-03 12:25 76o14.543 074o40.309 438 431 019 108 2007-10-03 17:06 76o13.111 074o50.264 441 436 020 134 2007-10-04 07:23 75o38.267 079o29.094 547 530 021 134 2007-10-04 12:51 75o35.526 079o28.192 541 526 022 301 2007-10-07 10:37 74o07.226 083o19.632 690 671 023 302 2007-10-07 18:04 74o09.019 086o11.442 529 513 024 302 2007-10-07 20:34 74o09.011 086o13.186 526 516 025 302 2007-10-08 02:03 74o11.885 086o36.796 501 489 026 305 2007-10-08 23:52 74o19.828 094o58.834 167 164 027 308 2007-10-09 14:36 74o07.565 103o01.634 351 343 028 308 2007-10-09 17:41 74o08.297 103o06.713 346 334 029 308 2007-10-09 20:24 74o07.902 103o08.978 353 345 030 309 2007-10-10 11:43 74o39.234 103o06.870 166 162 031 309 2007-10-10 16:05 74o38.580 103o33.346 175 165 032 310 2007-10-11 18:26 71o42.383 101o44.785 199 194 033 310 2007-10-11 21:09 71o43.772 101o53.616 216 202 034 314 2007-10-12 21:11 68o59.966 106o36.186 107 99 035 Beaufort-1 2007-10-15 02:54 70o54.925 126o55.093 260 241 036 434 2007-10-15 17:20 70o10.414 133o30.948 45 35 037 434 2007-10-15 19:14 70o10.781 133o32.774 40 35 038 433 2007-10-15 22:38 70o17.206 133o34.018 48 44 039 432 2007-10-15 23:24 70o24.336 133o35.867 56 52 040 431 2007-10-16 00:23 70o29.386 133o37.160 61 55 041 430 2007-10-16 01:12 70o35.548 133o39.211 66 58 042 429 2007-10-16 02:17 70o41.054 133o40.360 53 57 043 428 2007-10-16 03:24 70o47.174 133o41.684 71 63 044 427 2007-10-16 06:16 70o52.430 133o42.427 76 69 045 426 2007-10-16 07:33 70o59.004 133o43.638 89 84 046 435 2007-10-16 09:54 71o04.933 133o39.072 302 279 047 435 2007-10-17 19:01 71o04.741 133o38.872 295 279 048 435 2007-10-17 21:03 71o03.532 133o42.678 252 237
APPENDIX 2C. Rosette cast locations, sampling time, water depth and corresponding stations or mooring numbers during ArcticNet expedition 0806 (page 1/2).
Cast number Station or mooring Start date UTC Start time UTC Latitude (North) Longitude (West) Sea bottom depth (m) Cast depth (m) 001 Resolute 2008-09-05 20:17 74o39.580 094o50.430 17 8 002 BarrowStrait 2008-09-06 11:21 74o16.531 091o39.007 320 303 003 303 2008-09-07 07:10 74o14.324 089o39.738 230 223 004 303 2008-09-07 09:01 74o14.338 089o39.667 228 222 005 303 2008-09-07 12:33 74o14.495 089o38.396 227 212 006 303 2008-09-07 14:39 74o14.243 089o40.154 228 218 007 303 2008-09-07 17:18 74o13.991 089o38.748 228 219 008 303 2008-09-07 19:13 74o13.919 089o37.967 229 220 009 302 2008-09-08 03:26 74o09.389 086o16.188 522 515 010 301 2008-09-08 09:10 74o07.405 083o20.687 682 676 011 301 2008-09-08 13:08 74o07.422 083o19.805 678 669 012 301 2008-09-08 15:26 74o08.142 083o23.833 678 667 013 300 2008-09-09 09:38 74o19.126 080o06.653 655 643 014 134 2008-09-09 14:35 74o19.208 080o00.668 620 619 015 134 2008-09-09 18:03 74o28.768 078o00.358 622 617 016 134 2008-09-09 20:10 74o19.208 078o00.890 625 619 017 134 2008-09-09 22:13 74o28.812 078o00.241 639 620 018 136 2008-09-10 08:52 74o46.492 073o37.108 780 773 019 136 2008-09-10 11:55 74o46.253 073o36.328 782 775 020 136 2008-09-10 16:18 74o45.654 073o36.127 779 778 021 137 2008-09-10 20:25 74o51.772 071o20.544 928 920 022 138 2008-09-11 03:06 74o56.183 069o04.009 1068 951 023 138 2008-09-11 05:15 74o56.189 069o04.132 1080 950 024 139 2008-09-11 10:55 74o59.362 066o46.674 546 536 025 140 2008-09-11 15:40 75o02.190 064o29.128 280 272 026 140 2008-09-11 18:32 75o02.153 064o28.967 282 271 027 115 2008-09-12 08:28 76o19.710 071o16.456 678 666 028 115 2008-09-12 11:01 76o20.012 071o18.688 670 667 029 115 2008-09-12 22:51 76o19.669 071o13.801 672 666 030 115 2008-09-13 01:46 76o19.714 071o13.490 670 660 031 115 2008-09-13 04:34 76o19.646 071o13.322 673 660 032 114 2008-09-13 14:43 76o19.576 071o47.068 631 604 033 113 2008-09-13 16:21 76o19.253 072o13.133 568 554 034 112 2008-09-13 18:10 76o18.887 072o42.246 572 556 035 111 2008-09-13 20:24 76o18.395 073o14.110 613 591 036 111 2008-09-14 00:00 76o18.174 073o13.369 600 578 037 110 2008-09-14 03:19 76o18.064 073o37.813 532 526 038 109 2008-09-14 05:35 76o17.330 074o06.970 449 444 039 108 2008-09-14 08:22 76o15.502 074o34.992 443 433 040 108 2008-09-14 11:38 76o16.132 074o34.841 448 439 041 108 2008-09-14 14:20 76o16.019 074o34.756 444 438 042 108 2008-09-14 18:00 76o15.828 074o36.112 450 442 043 107 2008-09-14 23:01 76o17.384 074o56.578 460 447 044 106 2008-09-15 01:08 76o18.545 075o21.336 386 378 045 105 2008-09-15 02:43 76o19.104 075o37.434 324 318 046 104 2008-09-15 07:21 76o20.284 076o10.309 190 180 047 103 2008-09-15 08:48 76o21.658 076o34.768 147 137 048 102 2008-09-15 10:56 76o23.999 076o59.927 245 237 049 101 2008-09-15 17:38 76o21.386 077o26.815 387 382 050 101 2008-09-15 20:06 76o22.294 077o26.668 392 382
APPENDIX 2C. Rosette cast locations, sampling time, water depth and corresponding stations or mooring numbers during ArcticNet expedition 0806 (page 2/2).
Cast number Station or mooring Start date UTC Start time UTC Latitude (North) Longitude (West) Sea bottom depth (m) Cast depth (m) 051 101 2008-09-15 22:22 76o21.521 077o30.334 377 367 052 101 2008-09-16 00:08 76o24.271 077o29.447 403 393 053 200 2008-09-16 03:28 76o32.472 077o16.250 244 238 054 201 2008-09-16 05:26 76o39.974 077o03.204 267 264 055 202 2008-09-16 07:05 76o48.926 076o54.258 192 183 056 202 2008-09-16 11:43 76o48.594 076o55.578 179 167 057 202 2008-09-16 12:31 76o48.511 076o57.208 184 175 058 203 2008-09-16 14:34 76o56.899 076o55.412 155 145 059 204 2008-09-16 16:20 77o07.748 077o27.569 177 165 060 205 2008-09-16 22:53 77o13.558 078o49.052 489 484 061 205 2008-09-17 01:54 77o12.560 078o49.091 583 581 062 206 2008-09-17 06:48 77o11.719 078o06.425 491 487 063 207 2008-09-17 08:58 77o18.642 077o20.615 515 498 064 118 2008-09-17 13:03 77o19.398 076o31.681 475 465 065 118 2008-09-17 15:58 77o18.936 076o34.037 470 467 066 126 2008-09-18 05:17 77o20.573 073o26.220 326 319 067 126 2008-09-18 07:37 77o20.587 073o25.634 325 319 068 126 2008-09-18 11:49 77o20.803 073o25.469 330 321 069 126 2008-09-18 14:52 77o20.299 073o22.951 350 344 070 126 2008-09-18 17:40 77o20.689 073o25.454 326 318 071 230 2008-09-19 14:13 77o06.004 072o25.074 592 571 072 232 2008-09-19 16:45 76o56.706 072o11.980 835 834 073 233 2008-09-19 20:50 76o44.366 071o47.504 746 739 074 233 2008-09-20 00:11 76o43.950 071o51.935 658 627 075 233 2008-09-20 02:49 76o44.318 071o49.518 706 700 076 233 2008-09-20 07:36 76o44.168 071o49.459 704 701 077 234 2008-09-20 09:37 76o32.390 071o32.154 464 456 078 115 2008-09-22 22:33 76o19.870 071o13.364 663 646 079 141 2008-09-23 12:52 73o52.344 074o17.500 850 838 080 Gibbs2 2008-09-24 20:44 70o45.880 072o15.618 454 439 081 Gibbs2 2008-09-24 22:33 70o45.793 072o15.910 455 445 082 Gibbs2 2008-09-25 01:16 70o46.063 072o16.519 451 436 083 Gibbs1 2008-09-25 06:56 71o07.307 070o57.880 449 445
APPENDIX 3. List of Rosette sections and their related stations and casts. Some of these sections have been sampled during previous ArcticNet expeditions. When relevant, the
section name as been preserved.
Section Station Cast Section Station Cast Section Station Cast
621 3 101 2 622 4 103 5 623 5 105 6 303 8 624 6 115 9 302 9 620 7 113 12 301 10 617 8 111 14 300 13 610 9 108 17 134 17 612 10 301 22 136 20 613 11 302 23 137 21 614 12 305 26 138 22 615 13 308 27 139 24 600 14 434 37 140 25 601 15 433 38 115 29 602 16 432 39 114 32 604 17 431 40 113 33 356 18 430 41 112 34 354 19 429 42 111 35 352 20 428 43 110 37 703 28 427 44 109 38 703a 29 426 45 108 42 704 30 435 47 107 43 704a 31 106 44 704b 32 105 45 704c 33 104 46 705c 34 103 47 705b 35 102 48 705a 37 101 52 705a 37 101 52 706 38 200 53 707 40 201 54 202 55 203 58 118 64 115 78 234 77 233 73 232 72 230 71 126 66 Beaufort Sea Line 700 Northern Baffin Bay eastern coast 2 Eastern North-West Passage
Leg 0704 Leg 0706 Leg 0806
Anaktalak fjord Saglek fjord Northern Baffin Bay Section 5 Moorings Northern Baffin Bay Section 5 Northern Baffin Bay western coast Barrow Strait Eastern North-West Passage Nelson River Winisk River James Bay Hudson Strait Nachvak fjord
APPENDIX 4. List of the MVP sections and their related casts and metadata.
Sections of
0704 # of Casts
first and
last cast Date Time Latitude Longitude Bottom (m)
Cast depth (m) 36 August 6th, 2007 10:22 58.362 -78.475 109.9 88.5 221 August 6th, 2007 18:21 58.015 -79.862 122.9 106.2 224 August11th, 2007 00:10 54.686 -80.028 51.8 40.8 449 August11th, 2007 08:32 54.742 -81.394 41.2 28.5 Sections of 0706 # of Casts first and
last cast Date Time Latitude Longitude Bottom (m)
Cast depth (m) 1 October 1st, 2007 02:44 76.203 -73.789 426.6 80.2 58 October 1st, 2007 05:48 76.287 -72.167 535.8 131.4 Sections of 0806 # of Casts first and
last cast Date Time Latitude Longitude Bottom (m)
Cast depth (m) 1 September 9th, 2008 00:03 73.785 -79.992 795.6 82.5 39 September 9th, 2008 07:17 74.511 -80.202 645.2 620.2 40 September 24th, 2008 13:41 71.116 -70.976 454.3 87.7 58 September 24th, 2008 16:58 70.826 -71.895 688 569.4 30 Now S5 Inukjuak 164 Bay James 221 32 18 Lancaster Sound, east Gibbs Fjord
APPENDIX 5. Sections of salinity and potential temperature from the expedition 0704 (Leg 1). It includes data from the Rosette-CTD and from the MVP. The list of the stations
and casts selected for each section is found in Appendices 3 and 4.
The same color scale is used for all sections of this leg regardless of the sensor used. However, it is different from one leg to another. Details are found in Table 6.
5. Location of CTD and MVP sections during expedition 0704
Rosette-CTD sections
5.1 Section in the Anaktalak fjord, Labrador (previously sampled in 2006) 5.2 Section in the Saglek fjord, Labrador (previously sampled in 2006) 5.3 Section in the Nachvak fjord, Labrador (previously sampled in 2006) 5.4 Section 13 across Hudson Strait (previously sampled in 2005 and 2006) 5.5 Section 21 at the mouth of James Bay (previously sampled in 2005)
5.6 Section offshore of the Winisk River, in Hudson Bay (previously sampled in 2005) 5.7 Section offshore of the Nelson River, in Hudson Bay (previously sampled in 2005) 5.8 Section along the Western coast of Hudson Bay between moorings lines
MVP sections
5.9 Section offshore of Inukjuak, Eastern coast of Hudson Bay (previously sampled in 2005)
4
2
3
8
7
9
1
6
5
10
APPENDIX 5. Location of CTD (red) and MVP (purple) sampling sites during the expedition 0704 (Leg 1). The letters identify the
APPENDIX 5.1. Potential temperature and salinity along the section in the Anaktalak fjord. The western sites are on the left and the eastern sites are on the right.
TCCJ 0 12 10 8 -50 ~
.5-
6 .r:. 1i Q) 4 0 -100 2 0 -2 10 20 30 40 50Distance (km) fram West ta East
Salinity 0 -50 ~
.5-.r:. 1i Q) 0 -100 26 24 22 10 20 30 40 50APPENDIX 5.2. Potential temperature and salinity along the section in the Saglek fjord. The western sites are on the left and the eastern sites are on the right.
0 -50 -100 ~
.5-:S -150 D-Q) 0 -200 -250 0 -50 -100 ~ .5-:S -150 D-Q)o
-200 -250ArcticNet
l>Pl>'bC'b)r b )Pr'cr<1'bnrc TCCJ 12 10 8 6 4 2 0 -2 10 20 30 40Distance (km) fram West ta East
Salinity
22
10 20 30 40 50
APPENDIX 5.3. Potential temperature and salinity along the section in the Nachvak fjord. The western sites are on the left and the eastern sites are on the right.
~ -100
.5-.r:. 1i Q)o
-150 -200 ~ -100 .5-.r:. 1i Q) 0 -150 -200 5 10 15 20 25 30Distance (km) fram West ta East
5 10 15 20 25 30
Distance (km) fram West ta East
TCCJ 12 10 8 6 4 2 o -2 Salinity 30 28 26
APPENDIX 5.4. Potential temperature and salinity along the section 13 across Hudson Strait. The southern sites are on the left and the northern sites are on the right.
0 -100 -200 ~
.5-:S -300 D-Q) 0 -400 -500 -600 0 -100 -200 ~ .5-:S -300 D-Q)o
-400 -500 0 10ArcticNet
l>Pl>'bC'b)r b )Pr'cr<1'bnrc 20 30 40 50Distance (km) from South to North
_600L---~---L---~---L---~----~
o 10 20 30 40 50
Distance (km) from South to North
TCCJ 12 10 8 6 4 2 0 -2 Salinity 22
APPENDIX 5.5. Potential temperature and salinity along the section 21 at the mouth of James Bay. The western sites are on the left and the eastern sites are on the right.
TCCJ 0 12 10 8 ~
.5-
6 .r:. -50 1i Q) 4 0 -60 -70 2 -80 0 -90 -100 -2 0 20 40 60 80 100Distance (km) fram West ta East
Salinity 0 -10 -20 ~
.5-28 .r:. -50 1i Q) 0 -60 26 -70 -80 24 -90 22 -100 0 20 40 60 80 100APPENDIX 5.6. Potential temperature and salinity along the section offshore of the Winisk River. The southern sites are on the left and the northern sites are on the right.
ArcticNet
l>Pl>'bC'b)r b )Pr'cr<1'bnrc TCCJ 0 12 10 8 -50 ~.5-
6 .r:. 1i Q) 4 0 -100 2 0 -2 10 20 30 40 50Distance (km) from South to North
Salinity 0 -50 30 ~
.5-.r:. 1i 28 Q) 0 -100 26 24 22 10 20 30 40 50APPENDIX 5.7. Potential temperature and salinity along the section offshore of the Nelson River. The southern sites are on the left and the northern sites are on the right.
TCCJ 0 12 -5 10 -10 -15 8 ~-20
.5-
6 f; -25 D-Q) 4 0 -30 -35 2 -40 0 -2 10 20 30 40 50 60Distance (km) from South to North
Salinity 0 -5 -10 -15 30 ....--20
.5-f; -25 28 D-Q) 0 -30 26 -35 -40 24 22 10 20 30 40 50 60APPENDIX 5.8. Potential temperature and salinity along the Western coast of Hudson Bay. The southern sites are on the left and the northern sites are on the right.
ArcticNet
l>Pl>'bC'b)r b )Pr'cr<1'bnrc TCCJ 0 12 10 8 -50 ~.5-
6 .r:. 1i Q) 4 0 -100 2 0 --2 50 100 150 200 250Distance (km) from South to North
Salinity 0 -50 30 ~
.5-.r:. 28 1i Q) 0 -100 26 50 100 150 200 250APPENDIX 5.9. Potential temperature and salinity along the section offshore of Inukjuak. The western sites are on the left and the eastern sites are on the right.
T(°C) O,---,---,---,---,---~ 12 10 8 -50 ,--., E 6 '--' ..c
-
C-O) 4 0 -100 2o
_150L---~---L---L---~--~ -2o
20 ~ M MDistance (km) from West ta East
Salinity o,---,---,---,---,---~ ..c
1i
0)o
_150L---L---L---L---~--~o
20 ~ M MAPPENDIX 5.10. Potential temperature and salinity along the section at the mouth of James Bay. The western sites are on the left and the eastern sites are on the right.
ArcticNet
l>Pl>'bC'b)r b )Pr'cr<1'bnrc T(°C) O,---~--~--~--~--~--~--~--~~ 12 10 8Ê
-40 6 '--' ..c -501i
Q)o
-60 4 -70 2 -80o
-90 -1 00 L~,---,_---,_---,_---=:::r~~~----,-KLh~ -2o
10 20 30 40 50 60 70 80Distance (km) from West ta East
Salinity 30
Ê
-40 '--' ..c -501i
28 Q)o
-60 26 -70 -80 24 -90 22 -1 00 '---__ "---__ - ' -__ -'---__ -'---__ --'----__ -'""'-__ --"-'-'~L.L______'o
10 20 30 40 50 60 70 80APPENDIX 6. Sections of salinity and potential temperature from the expedition 0706 (Leg 3). It includes data from the Rosette-CTD and from the MVP. The list of the stations
and casts selected for each section is found in Appendices 3 and 4.
The same color scale is used for all sections of this leg regardless of the sensor used. However, it is different from one leg to another. Details are found in Table 6.
6. Location of CTD and MVP sections during expedition 0706
Rosette-CTD sections
6.1. Section 5 in the Northern Baffin Bay (previously sampled in 2005 and 2006) 6.2. Section across the Eastern Northwest Passage in Lancaster Sound (between
Resolute Bay and Baffin Bay) (previously sampled in 2006) 6.3. Section 700 in Beaufort Sea (previously sampled in 2006)
MVP sections
4
1
2
3
APPENDIX 6. Location of CTD (red) and MVP (purple) sampling sites during the expedition 0706 (Leg 3). The letters identify the
sections presented as salinity and temperature contour plots on the next pages.
o
i
9
ArcticNet
t>Pt>~bC~b)rb )Pr'o-<l~bnr(110 W
100 W
o
-500
-1000
-1500
-2000
-2500
-3000
-3500
w
APPENDIX 6.1. Potential temperature and salinity along section 5 in the Northern Baffin Bay. The western sites are on the left and the eastern sites are on the right.
0.5 ~
.5-:S -400 0 D-Q) 0 -500 -0.5 <=> -600 -1 -700 -1.5 -2 20 40 60 80 100 120Distance (km) fram West ta East
Salinity 0 35 -100 34 33 32 ~