An ASABE – CSBE/ASABE Joint
Meeting Presentation
Paper Number: 1894167
Soil compaction resulting from different soil tillage
systems
Destain M.-F.
a, Roisin C.
b, Mercatoris B.C.N.
aa
ULg (GxABT), 2 Passage des Déportés, 5030 Gembloux (Belgium)
b
CRA-W, 9 Rue de Liroux, 5030 Gembloux (Belgium)
aULg (GxABT), 2 Passage des Déportés, 5030 Gembloux (Belgium)
Written for presentation at the
2014 ASABE and CSBE/SCGAB Annual International Meeting
Sponsored by ASABE
Montreal, Quebec Canada
July 13 – 16, 2014
Abstract. The effects of long-term use (8 years) of two different tillage systems were assessed on a Luvisol,
under temperate climate (Belgium). The tillage treatments were (i) conventional tillage (CT) with moldboard ploughing to 27 cm depth and (ii) reduced tillage (RT) with a spring tine cultivator to 10 cm depth. The measurements included bulk density (BD) and precompression stress (Pc) chosen as indicators of mechanical strength, and the pore size distribution (PSD) measured by mercury intrusion porosimetry (MIP). The tillage systems, the depth and their interaction had a significant effect on BD, Pc and PSD.
In CT, in the topsoil, the soil strength was low and the total porosity n was about 50 %. In the subsoil, n decreased to 43 %. The PSD of CT was uni-modal in topsoil and subsoil in the MIP measurement range. The mean value of the mode rmax diminished from the topsoil toward the subsoil (from 2.5µm to 1.9µm).
In RT, in the topsoil, the soil strength was higher than CT. BD did not vary much according to the depth. The total porosity n of RT was comprised between 40-45 % in the soil profile. The PSD was uni-modal and rmax
increased from topsoil ( ≅ 2µm) to subsoil (> 3µm). This suggested the agglomeration of fine particles under the long-term action of mechanical loads, climatic agents, biological organisms or clay minerals acting as cementing agents. These phenomena could be at the origin of the increase of Pc with the depth without significant modification of BD. Such high values of Pc could be responsible of negative effects on root-growth leading to a more superficial root lateral development.
Introduction
Conservation tillage is a combination of non-reverting soil management practices, crop residue retention and crop rotation. It is widely practised in North and South America, in Australia and in semi-arid areas of the world. The environmental benefits of conservation tillage are often cited: improved soil structure and stability, better water-holding capacity, higher natural biodiversity and lower energy consumption (Tebrügge and Düring, 1999; Holland, 2004). In the context of climate change, the effect of reducing and slowing down the decomposition of plant matter, which promotes the storage of CO2 fixed in plants as carbon and returned to the soil as plant
debris, is also cited as a benefit (Fuentes et al., 2012; Kahlon et al., 2013). Conservation tillage is now common in areas where rainfall causes erosion or where the soil moisture preservation because of low rainfall is the objective (Holland, 2004).
Conservation agriculture has been less widely adopted in Europe than in other regions and reduced tillage (RT) is more common than no-tillage and cover crops (Lahmar, 2010). In Europe, almost two-thirds of the arable land is tilled using conventional tillage (CT) practices based on the plough. Out of the total area of arable land, the proportion on which RT is practised is greater for large economically important holdings ( Agri-environmental indicator – tillage practices, 2013/12/4). Cost savings in fuel, labour and machinery remain the most important economic features driving the adoption of conservation tillage in Europe. Conservation agriculture has been encouraged and subsidised in Norway and Germany in order to mitigate soil erosion (Lahmar, 2010).
It would appear that conservation tillage might not always be the most appropriate cultivation technique for all agroecosystems, its environmental benefits depending on the soil conditions (Holland, 2004; Lahmar, 2010). Excessive soil compaction has been reported in some situations, resulting in structural degradation after using long-term conservation tillage (Ferreras et al., 2000; Raper et al., 2000; Wiermann et al., 2000; Munkholm et al., 2003). However, in other cases, it seems that the compaction by traffic is lower in soils which have not been tilled for many years (Tebrügge and Düring, 1999; Lal, 1999; Simoes et al., 2009; Kahlon et al., 2013). In essence, studies on soil compaction under conventional and conservation tillage systems have produced contradictory results. Relatively few studies have compared the impact of vehicle traffic on soil mechanical properties in these two tillage systems. The overall objective of the current study is therefore to analyse the effects of beet harvesting on soil structure resulting from long-term experience with two kinds of soil tillage, CT and RT. CT is a deep primary cultivation method performed by a plough, whereas RT is carried out with a spring-tine cultivator. As spatial variability often overshadows specific management effects (Strudley, 2008), the soil characteristics resulting from the long-term experiment were analysed. The study was conducted on loamy soil in a temperate climate area in Belgium.
Two main approaches were chosen to characterise the soil properties: (i) soil strength, assessed mainly by measuring precompression stress (Pc), considered by several authors to be a robust indicator of soil compaction (Dexter, 1988; Lebert and Horn, 1991; Cavalieri and Arvidsson, 2008) and (ii) pore size distribution, measured by mercury intrusion porosimetry (MIP), which enables the stress effect of tillage or vehicular traffic on soil over a wide range of pores sizes to be assessed (Lipiec et al., 2012).
Material and methods
Parcels identification
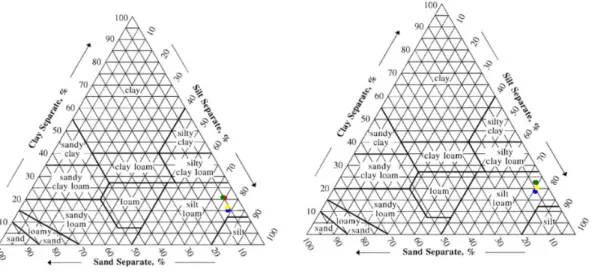
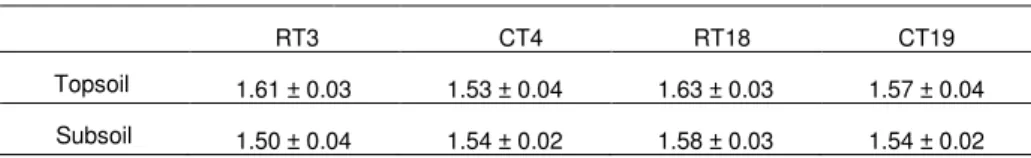
The experiment was conducted on an Orthic Luvisol developed from loess in an experimental field at Gentinnes (50°35’N, 4°35’E) in Belgium. The topsoil (5-25 cm) contains 17.7, 75.7, and 6.6% of clay, silt and sand, respectively. The subsoil (35-50 cm) contains 20.5, 74.2, and 5.3% of clay, silt and sand, respectively (Fig. 1). According to the USDA classification the soil texture is silt loam. Soil water retention curves (SWRC) were measured in laboratory in a suction range from to 1 kPa to 16223 kPa (pF 1 to 4.2) (Fig. 2).
The authors are solely responsible for the content of this meeting presentation. The presentation does not necessarily reflect the official position of the American Society of Agricultural and Biological Engineers (ASABE), and its printing and distribution does not constitute an endorsement of views which may be expressed. Meeting presentations are not subject to the formal peer review process by ASABE editorial committees; therefore, they are not to be presented as refereed publications. Citation of this work should state that it is from an ASABE meeting paper. EXAMPLE: Author’s Last Name, Initials. 2014. Title of Presentation. ASABE Paper No. ---. St. Joseph, Mich.: ASABE. For information about securing permission to reprint or reproduce a meeting presentation, please contact ASABE at [email protected] or 269-932-7004 (2950 Niles Road, St. Joseph, MI 49085-9659 USA).
A long-term experiment was designed to compare (i) conventional tillage (CT) with mouldboard ploughing to a depth of 27 cm depth and (ii) reduced tillage (RT) with a spring-tine cultivator to a depth of 10 cm. Four plots were used, two for CT (CT4 and CT19) and two for RT (RT3 and RT18) (Fig. 1). Depending on field slope, the elevation of plots RT3 and CT4 was about 145 m above sea level (asl) and that of RT18 and CT19 was about 137 m asl. Wheat (Triticum aestivum L.) was grown in rotation with sugar beet (Beta vulgaris L.). At the beginning of the experiments, in October 2012, the RT plots had not been ploughed for 9 years and sugar beet was implemented.
Figure 1. Soil textures. Topsoil (left), Subsoil (right). Blue: RT3, Yellow: CT4; Red: RT18; Green: CT19.
Figure 2. Soil water retention curves. Topsoil (left), Subsoil (right). The crosses correspond to the passage’s conditions of beet harvesting machines.
Experimental protocol
To assess the sensitivity of the different tillage systems to compaction, effects of traffic were analysed in October 2012. The passage of beet harvesting machines caused stresses at the soil-wheel interface of about 150 kPa repeated several times due to the presence of three axles. The harvest was carried out when the topsoil water content (WC) ranged from 23 to 28% (Figure 2). It was close to the optimum Proctor, which means that the sensitivity to compaction was high. Although unfavourable, these wet conditions often occur during the beet harvesting period in Belgium (October to December).
To assess the soil strength, dry bulk density (BD) and precompression stress (Pc) were measured from undisturbed soil samples (φ = 7 cm, h = 2 cm) with 10 repetitions on 10 m length, in the topsoil and the subsoil, in each parcel, before and after the passage of machines.
Pc was measured in laboratory conditions by confined uniaxial compression tests. An automatic multistep oedometer (VJTechnology, type Acons) under drained condition was used, with pressures of 7.87, 15.75, 31.25, 62.5, 125, 250, 500 and 1000 kPa applied for 10 min each (Horn and Fleige, 2009). The Pc value was determined according to the graphic determination according to Casagrande (1936). As Pc decreases with increasing WC, following procedure was employed to obtain normalized values independent of the WC. Pc was measured at the WC of the soil at the moment of the tests on half of the soil samples. The second part of the samples was saturated and new measurements of Pc were performed. Assuming a linear relationship of Pc versus the suction (Alonso et al., 1990), Pc could be computed at different values of water potentials. In this study, the chosen value was pF= 1.8 (suction = - 63 cm or -6.2 kPa) and the normalized value was noted (Pc)pF 1.8.
Cone index was measured by a fully automated penetrometer (30° angle cone with a base area of 1 cm2) mounted on a small vehicle as described by Roisin (2007). An area of 80 × 80 cm2 was investigated, the spacing between neighbouring points being 5 cm. At each node, a penetration was performed, and data were collected every centimetre from the surface down to a depth of 45 cm. A data treatment was performed to present the data on a cartographic format.
The pore size distribution (PSD) was measured by mercury intrusion porosimeter (MIP). The undisturbed soil aggregates were oven-dried at 105°C to assume that no suction occurred (D’Acqui, 1994; Richard et al., 2001). Step-wise pressure increments were applied thanks to an AutoPore IV 9500 (Micromeritics). The pores which can be intruded by mercury under an applied pressure are assumed to be cylindrical, the radius r is called the equivalent pore radius. For the device used in this research, the mercury intrusive pressure range was comprised between 9.2 kPa and 228 MPa and the measurable range of equivalent pore radius was given by rmin = 0.003 µm and rmax = 73 µm. The pore size distributions (PSDs) were presented in two forms: (i) the cumulative pore volume vs. pore radius resulting from the forcing of mercury into the pores of soil incrementally; (ii) the logarithmically differential pore volume curve vs. pore radius. This latter curve can be represented with a function f(r) which has a value proportional to the volume of pores with a radius centred on r. Assuming that the volume corresponding to r < 0.003 µm was negligible, the cumulative pore volume of 1 g of solid soil measured by MIP was thus computed as:
( )
r
dr
f
e
V
r r s∫
−
γ
=
max min with e the void ratio and γs the bulk density.There is no accepted definition that specifies the class limits of pores according to functionalities (Nimmo, 2004; Pagliai and Kutilek, 2008; Castellini and Ventrella, 2012). For example, Richard et al. (2001) identified three classes from MIP measurements: structural (40 µm < φ < 360 µm), lacunar (0.05 µm < φ < 40 µm) and clay (0.006 µm < φ < 0.05 µm) pores. Dexter (2004) suggested classifying pores larger than the value corresponding with the inflection point of the SWRC curve as structural pores and those that are smaller as textural pores. Koliji et al. (2008) distinguished between microporosity (relating to the pores within the aggregates – intra-aggregates) and macroporosity (relating to the pores between the aggregates – inter-aggregates). The same concept was described by Dexter et al. (2008) and Alaoui et al. (2011): the pore space between individual soil mineral particles is called matrix or textural porosity, whereas the pore space between the microaggregates, called structural porosity, is composed mainly of biopores (created mainly by roots and earthworms), micro-cracks, etc. The segregation of pore space into these two categories produces bi-modal PSDs.
In this paper, four classes were defined on basis of the equivalent pore radius measured by MIP: r < 0.2µm; 0.2 ≤ r < 9µm; 9 ≤ r < 73µm; r ≥ 73µm. The first class consisted of residual pores for chemical interactions at the molecular level and represented ‘microporosity’. The second class, here called ‘mesoporosity’, consisted of storage pores (i.e., pores that store water for plants and micro-organisms) and are mainly represented by intra-aggregates pores. The third and fourth classes are called ‘macroporosity’ and are represented by pores in which water flows under gravity. The third class contained pores accessible by MIP, whereas the fourth class, containing pores with radii greater than 73µm and therefore not accessible by MIP, was mainly inter-aggregate porosity and was computed by subtracting the volumes of first three classes from the total porosity of 1g of soil. In this latter case, the differential pore volume curve could not be calculated. Five replicates were performed for aggregate fractions with a mass of 2.5g sampled from both the ‘reference’ and ‘passage’ lines in the topsoil and subsoil.
The differences between the means of bulk density, precompression stress, components of porosity were assessed by t-test and analysis of variance (ANOVA), considering the treatment (tillage system and effect of
machines) and depth as fixed factors and following statistical software from Matlab®.
Results
1. Soil strength
Cone index
Small spaced cone index measurements give a representation of soil strength and variability. For example, Fig. 3 shows that under CT there was a loose layer corresponding to the turning of furrow slices by the plough up to a depth of 30 cm. In some zones the soil was more compacted, however, due to the passage of a sowing machine. Under CT, the higher values measured at a depth of about 30 cm were due to the transmission of plough forces to the base of the furrow via the tractor wheels. This created a plough pan that could act as a resistant layer. Under RT there was a loose layer of a few cm. Beneath this zone, soil resistance seemed to increase. The cone index imaging clearly reveals the difference in soil structure depending on the use of CT or RT, although no quantitative conclusion can be drawn regarding soil strength because of the sensitivity of the cone index to soil moisture (Guérif, 1994). After the passage of machines, a comparison of Fig.s 6 and 11 showed greater uniformity in the subsoil’s cone index values (Fig. 4).
Bulk density
The ANOVA test indicated that the treatments, the depth and their interaction had a significant effect on bulk density (BD) (P < 0.01) (Table 1). In the topsoil, BD reached respectively 1.48, 1.31, 1.61, and 1.30 Mg/m3 under RT3, CT4, RT18, and CT19. The lowest values were observed in conventional tillage CT4 and CT19. The highest value was observed in RT18 which was more sensitive to compaction because of its higher clay content. In the subsoil, the bulk density values were respectively equal to 1.47, 1.52, 1.53, and 1.53 Mg/m3. In CT, a jump of BD was thus observed from topsoil to subsoil. These data were in accordance with several previous studies (Bauder, 1981; Alletto and Coquet, 2009; Hartmann et al., 2012; Boizard et al., 2013).
Directly after the passage of machines, an increase of 8.8, 16.8, 1.2, and 20.8% was observed respectively in RT3, CT4, RT18, and CT19 (Table 2). The high increase in CT was expected since, in the initial state, the soil was loosened and characterized by low BD. In the subsoil, the increase was limited to 2.0, 1.3, 3.3, and 0.6% respectively in RT3, CT4, RT18, and CT19 and the effect of the harvesting machines on BD was not significant.
Table 1. Dry bulk density (before the passage of beet harvesting machines).
Dry bulk density (Mg/m3)
RT3 CT4 RT18 CT19
Topsoil 1.48 ± 0.04 1.31 ± 0.10 1.61 ± 0.05 1.30 ± 0.10
Subsoil 1.47 ± 0.14 1.52 ± 0.02 1.53 ± 0.03 1.53 ± 0.02
Table 2. Dry bulk density (after the passage of beet harvesting machines).
Dry bulk density (Mg/m3)
RT3 CT4 RT18 CT19
Topsoil 1.61 ± 0.03 1.53 ± 0.04 1.63 ± 0.03 1.57 ± 0.04
Figure 3. Cone index images before the passage of beet harvesting machines, CT4 (above) and RT3 (below).
Figure 4. Cone index images after the passage of beet harvesting machines, CT4 (above) and RT3 (below).
0 5 10 15 20 25 30 35 40 45 50 55 60 65 70 75 80 85 90 95 100 105 110 115 120 125 130 135 140 145 150 155 160 0 5 10 15 20 25 30 35 40 45 50 0 kg /c m ² 3 kg /c m ² 9 kg /c m ² 1 5 k g/ cm ² 2 1 k g/ cm ² 2 7 k g/ cm ² 3 3 k g/ cm ² 3 9 k g/ cm ² 4 5 k g/ cm ² 5 1 k g/ cm ² 5 7 k g/ cm ² 6 5 k g/ cm ² 7 5 k g/ cm ² 8 5 k g/ cm ² 9 5 k g/ cm ² 0 5 10 15 20 25 30 35 40 45 50 55 60 65 70 75 80 85 90 95 100 105 110 115 120 125 130 135 140 145 150 155 160 0 5 10 15 20 25 30 35 40 45 50 0 kg /c m ² 3 kg /c m ² 9 kg /c m ² 1 5 k g/ cm ² 2 1 k g/ cm ² 2 7 k g/ cm ² 3 3 k g/ cm ² 3 9 k g/ cm ² 4 5 k g/ cm ² 5 1 k g/ cm ² 5 7 k g/ cm ² 6 5 k g/ cm ² 7 5 k g/ cm ² 8 5 k g/ cm ² 9 5 k g/ cm ² 0 5 10 15 20 25 30 35 40 45 50 55 60 65 70 75 80 85 90 95 100 105 110 115 120 125 130 135 140 145 150 155 160 0 5 10 15 20 25 30 35 40 45 50 0 kg /c m ² 3 kg /c m ² 9 kg /c m ² 1 5 k g/ cm ² 2 1 k g/ cm ² 2 7 k g/ cm ² 3 3 k g/ cm ² 3 9 k g/ cm ² 4 5 k g/ cm ² 5 1 k g/ cm ² 5 7 k g/ cm ² 6 5 k g/ cm ² 7 5 k g/ cm ² 8 5 k g/ cm ² 9 5 k g/ cm ² 0 5 10 15 20 25 30 35 40 45 50 55 60 65 70 75 80 85 90 95 100 105 110 115 120 125 130 135 140 145 150 155 160 0 5 10 15 20 25 30 35 40 45 50 0 kg /c m ² 3 kg /c m ² 9 kg /c m ² 1 5 k g/ cm ² 2 1 k g/ cm ² 2 7 k g/ cm ² 3 3 k g/ cm ² 3 9 k g/ cm ² 4 5 k g/ cm ² 5 1 k g/ cm ² 5 7 k g/ cm ² 6 5 k g/ cm ² 7 5 k g/ cm ² 8 5 k g/ cm ² 9 5 k g/ cm ²
Precompression stress
The treatments, the depth and their interaction had also a significant effect on precompression stresses (Table 3) (P < 0.01). In the topsoil, (Pc)pF 1.8 reached 107, 73, 81, and 46 kPa under RT3, CT4, RT18, and CT19
respectively. The higher values observed in RT in comparison with CT were probably due to an increase in effective stresses (the stresses transmitted via the solid particles) occurring in RT, because of a higher number of contact points explained by a higher BD. In the subsoil, (Pc)pF1.8 always exceeded 100 kPa and was
significantly higher than in the topsoil, which possibly indicates an effect of age-hardening. A particularly high value existing in CT4 (198 kPa) could be attributed to age-hardening due to localized historic effects.
After the passage of machines, the precompression stress increased significantly in the topsoil layers (P < 0.01), where the increases were 48, 56, 78, and 173 % respectively in RT3, CT4, RT18, and CT19 (Table 4). In the subsoil, significant increases were noticed in RT18 (20%) and CT19 (27%). In the subsoil of RT3, the increase was not significant. In CT4, as mentioned before, the initial value was especially high.
Table 3. Precompression stress (normalized values at pF 1.8) (before the passage of beet harvesting machines).
Precompression stress (kPa).
RT3 CT4 RT18 CT19
Topsoil 107 ± 8 73 ± 9 81 ± 9 46 ± 6
Subsoil 137 ± 12 198 ± 15 130 ± 12 118 ± 9
Table 4. Precompression stress (normalized values at pF 1.8) (after the passage of beet harvesting machines).
Precompression stress (kPa).
RT3 CT4 RT18 CT19
Topsoil 158 ± 8 114 ± 11 144 ± 12 126 ± 9
Subsoil 141 ± 13 165 ± 15 157 ± 14 150 ± 12
2. Porosity structure
In the topsoil, the respective values of total porosity n obtained under RT3, CT4, RT18, and CT19 were 45, 51, 40, and 51%. As expected, the higher total porosity was obtained in CT4 and CT19 versus RT3 and RT18 and was concomitant with the existence of aggregates resulting from the fragmentation created by the plough. In the subsoil, the values obtained respectively under RT3, CT4, RT18, and CT19 were 45, 43, 41 and 43 %. After the passage of harvesting machines, in the topsoil, the total porosity n under RT3, CT4, RT18, and CT19 was respectively 40, 43, 39, and 41 %. It decreased thus in RT3 (11%), CT4 (16%), RT18 (3%), and CT19 (20%) versus the reference situation. The low decrease in RT18 was due to the fact that severe compaction was present in the reference situation.
Fig.s 5 and 6 show the cumulative porosity and the PSD measured by MIP for the topsoil and the subsoil, respectively under CT4 and RT3. Fig.s 7 and 8 give the porosity structure before and after the passage of machines, respectively in the topsoil and the subsoil.
Under CT, more than half of the total porosity was macroporosity with equivalent pore radii r > 9 µm, corresponding to pores in which water movement was important. In the MIP range, the PSD in the topsoil and subsoil was uni-modal, although some fairly pronounced secondary peaks appeared. The mode had an equivalent pore radius rmax between 2.1 and 2.8µm in the topsoil and 1.7 and 2.1µm in the subsoil. This
suggested that the intra-aggregate structure was affected by natural pedogenic processes, compaction by agricultural vehicles and implements. In the subsoil in CT4, a low mode rmax (1.7µm) and a low PSD peak value
associated with a high (Pc)pF1.8 value (198 kPa) indicated strong compaction, probably due to age-hardening
related to historic effects. With machine traffic, in the topsoil, the decrease in macroporosity (r ≥ 73µm) reached 48 and 53% for CT4 and CT19, respectively. The mesoporosity (0.2 ≤ r < 9µm) was affected to a lesser extent, with decreases of 5 and 4% for CT4 and CT19, respectively. The PSD was not affected by compaction. The larger inter-aggregate pores were therefore destroyed first, followed by the smaller ones, in agreement with other studies (Lapierre et al., 1990; Richard et al., 2001; Matthews et al. 2010). In the subsoil, a decrease in
macroporosity (r ≥ 73µm) was observed even if not significant.
Figure 5. Porosity structure in topsoil and subsoil, CT4. Left: cumulative pore volume, yellow: topsoil (mean and standard deviation); black: subsoil (mean and standard deviation); Right: PSD.
Under RT, soil properties did not vary much with depth, contrary to CT (Fig. 6). In the topsoil, macroporosity (r ≥ 73µm) was lower under RT than CT, as reported by many authors (e.g., Dal Ferro et al., 2014). The pore system has also less flow-active pores under RT than CT, as noted by Lipiec et al. (2006). The PSD was uni-modal and rmax increased from topsoil (rmax = 1.7 to 2µm) to subsoil (rmax = 3.3µm). Such a modification in
subsoil microstructure was probably due to the action of the soil mesofauna (mites, springtails, fly larvae, etc.). The increase in Pc with depth without significant BD modification suggested an increased number of contact points per unit volume resulting from the agglomeration of fine particles under the long-term action of mechanical loads, climatic agents, biological organisms and/or clay minerals acting as cementing agents, especially in RT18 (Guérif, 1994). This process could be responsible for negative effects on root growth and root-induced parameters, leading to more superficial root lateral development sometimes observed in RT (Munkholm et al., 2008; Dal Ferro et al., 2014). In the topsoil in RT18, rmax and PSDmax were the lowest among
the layers considered. This suggested strong compaction, confirmed by high BD. The physical quality of the finely textured topsoil in RT18 could be considered as poor, with the following consequences: risk of poor water infiltration, run-off from the surface, and poor aeration. Overall, long-term RT had an adverse impact on this plot with high clay content. With the machine traffic, in the topsoil, the decrease in macroporosity (r ≥ 73µm) reached 33 and 6% for RT3 and RT18, respectively. In the subsoil, a significant decrease of macroporosity (16%) was obtained for RT3. As in CT, the PSD was not affected by compaction.
Figure 6. Porosity structure in topsoil and subsoil, RT3. Left: cumulative pore volume, blue: topsoil (mean and standard deviation); black: subsoil (mean and standard deviation); Right: PSD.
Figure 7. Topsoil: porosity structure in RT3, CT4, RT18 and CT19 before (green) and after (blue) the passage of harvesting machines.
Figure 8. Subsoil: porosity structure in RT3, CT4, RT18 and CT19 before (green) and after (blue) the passage of harvesting machines.
Conclusion
The passage of beet harvesting machines induced stresses at the soil-wheel interface of about 150 kPa which were repeated several times due to the presence of three axles. The harvest was carried out when the SWC was close to the optimum Proctor. Although unfavourable, these wet conditions often occur during the beet harvesting period in Belgium (October to December).
The short-term passage of these machines induced topsoil compaction as indicated by the precompression stress increase and the porosity structure modification. Under RT, the initial porosity was lower than CT and still decreased with the machine traffic. The macroporosity (r ≥ 73µm) was initially destroyed and the mesoporosity (0.2 ≤ r < 9µm) was affected to a lesser extent, function of local heterogeneity such as clay content. In RT systems, the reduction in topsoil porosity could be problematic in that the soil could no longer be loosened by subsequent tillage.
In the subsoil, there were small increases in bulk density and precompression stress under CT and RT. Although not significant, they could lead to soil consolidation as a result of wheel traffic year after year. Overall, these observations raise the question of recovery of the initial soil properties that affect plant growth and the environment (namely, saturated hydraulic conductivity). According to Boizard et al. (2013), this process could last several years in high compaction situations.
The PSD was not affected by machine traffic, excepted where the topsoil was sensitive to compaction and did not show enough mechanical stability to support the stresses caused by machine traffic. In this case, the subsoil mesoporosity was reduced. This highlights the need of considering adapted management practices to account the soil spatial variability, mainly its texture.
In further studies, the impact of the modifications in soil strength and porosity structure resulting from both tillage systems should be assessed on the hydraulic functions of the soil and plant growth.
Acknowledgements
The authors gratefully acknowledge financial support provided by the Research Direction of the SPW (Wallonia, Belgium).
References
Agri-environmental indicator – tillage practices – Statistics Explained (2013/12/4) http://epp.eurostat.ec.europa.eu/statistics_explained/index.php/Agri-environmental_indicator_-_tillage_practices
Alaoui A., Lipiec J., Gerke H. 2011. A review of the changes in the soil pore system due to soil deformation: A hydrodynamic perspective. Soil Till. Res. 115-116, 1-15.
Alletto L., Coquet Y. 2009. Temporal and spatial variability of soil bulk density and near-saturated hydraulic conductivity under two contrasted tillage management systems. Geoderma 152, 85-94.
Alonso E.E., Gens A., Josa A. 1990. A constitutive model for partially saturated soils. Géotechnique 40, 3, 405-430. Bauder J., Randall G., Swann J. 1981. Effect of Four Continuous Tillage Systems on Mechanical Impedance of a Clay Loam Soil. Soil Science Society of America Journal, 45(4), 802-806.
Boizard H., Won Toon S., Leonard J., Lheureux S., Cousin I., Roger-Estrade J., Richard G. 2013. Using a morphological approach to evaluate the effect of traffic and weather conditions on the structure of a loamy soil in reduced tillage. Soil Till. Res. 127, 34-44.
Brussard L., van Faassen H.G., 1994. Effects of compaction on soil biota and soil biological processes. In Soil Compaction in Crop Production, Soane and van Ouwerkerke (eds), Elsevier, ISBN 0-444-88286-3, 215-235.
Casagrande A. 1936. The determination of preconsolidation load and its practical significance. In: Proceedings of the 1st International Conference on Soil Mechanics and Foundation Engineering, vol. 3, Cambridge, 60–64.
Castellini M., Ventrella D. 2012. Impact of conventional and minimum tillage on soil hydraulic conductivity in a typical cropping system in Southern Italy. Soil Till. Res. 124, 47–56.
Cavalieri K.M.V., Arvidsson J. 2008. Determination of precompression stress from uniaxial compression tests. Soil Till. Res. 98(1), 17-26.
D’Acqui L., Bruand A., Pagliai M. 1994. Study of soil porosimetry and image analysis on backscattered electron scanning images (BESI). Application to tilled ‘crusting soils’ in Zimbabwe. In: A.J. Ringrose-Voase and Humphreys (eds), Soil Micromorphology. Proc/ IX Int. Working on Soil Micromorphology, Townsville, Australia, July 1992. Developments in Soil Science 22, Elsevier, Amsterdam, 581-590.
Dal Ferro N., Sartori L., Simonetti G., Berti A., Morari F. 2014. Soil macro- and microstructure as affected by different tillage systems and their effects on maize root growth. Soil Till. Res. 140, 55-65.
Dexter A. 1988. Advances in characterization of soil structure. Soil Till. Res. 11, 199-238.
Dexter A. 2004. Soil physical quality. Part I. Theory, effects of soil texture, density, and organic matter, and effects on root growth. Geoderma 120, 201-214.
Dexter A., Czyz E., Richard G., Reszkowska A. 2008. A user-friendly water retention function that takes account of the textural and structural pore spaces in soil. Geoderma 143, 243-253.
Ferreras L.A., Costa J.L., Garcia F.O., Pecorari C. 2000. Effect of no-tillage on some soil physical properties of a structural degraded Petrocalcic Paleudoll of the southern ‘Pampa’ of Argentina. Soil Till. Res. 54, 31–39.
Fuentes M., Hidalgo C., Etchevers J., De León F., Guerrero A., Dendooven L., Verhulst N., Govaerts B. 2012. Conservation agriculture, increased organic carbon in the top-soil macro-aggregates and reduced soil CO2 emissions. Plant and Soil 355,
1-2, 183-197.
Guérif J. 1994. Effects of compaction on soil strength parameters. Soil Compaction in Crop Production. B.D. Soane and C. van Ouwerkerk (eds). Elsevier Science B.V.
Hakansson, I., Reeder, R.C. 1994. Subsoil Compaction by Vehicles with High Axle Load Extent, Persistence and Crop Response. Soil Till. Res. 29, 277-304.
Hartmann P., Zink A., Fleige H., Horn R. 2012. Effect of compaction, tillage, and climate change on soil water balance of Arable Luvisols in Northwest Germany. Soil Till. Res. 124, 211-218.
Holland J.M. 2004. The environmental consequences of adopting conservation tillage in Europe: reviewing the evidence. Agriculture, Ecosystems & Environment, 103, 1, 1–25
Horn R., Fleige H. 2009. Risk assessment of subsoil compaction for arable soils in Northwest Germany at farm scale. Soil Till. Res. 102, 201-208.
HornR., DomżżałH., Słowińska-JurkiewiczA., van Ouwerkerk C. 1995. Soil compaction processes and their effects on the structure of arable soils and the environment. Soil Till. Res. 35, 1-2, 23–36.
Hu R., Chen Y.-F., Liu H.-H., Zhou C.-B. 2013. A water retention curve and unsaturated hydraulic conductivity model for deformable soils: consideration of the change in pore-size distribution. Géotechnique 63, 1389-1405.
Kahlon M.S., Lal R., Varughese M.A. 2013. Twenty two years of tillage and mulching impacts on soil physical characteristics and carbon sequestration in Central Ohio. Soil Till. Res. 126, 151-158.
Koliji A., Vulliet L., Laloui L. 2008. New basis for the constitutive modelling of aggregated soils. Acta Geotechnica 3, 61-69. Lahmar R. 2010. Adoption of conservation agriculture in Europe: Lessons of the KASSA project. Land Use Policy, 27, 1, 4– 10.
Lal R., 1999. Long-term tillage and wheel traffic effects on soil quality for two central Ohio soils. J. Sustain. Agric. 14, 67– 84.
Lapierre C., Leroueil S., Locat J. 1990. Mercury intrusion and permeability of Louiseville clay. Can. Geotech. J. 27 (6), 297-311.
Lebert M., Horn R. 1991. A Method to Predict the Mechanical Strength of Agricultural Soils. Soil Till. Res. 19(2-3), 275-286. Lipiec J., Kus J., Słowińska-Jurkiewicz A., Nosalewicz A. 2006. Soil porosity and water infiltration as influenced by tillage methods. Soil Till. Res. 89 (2), 210–220.
Lipiec J., Hajnos M., Swieboda R. 2012. Estimating effects of compaction on pore size distribution of soil aggregates by mercury porosimetry. Geoderma 179-180, 20-27.
Matthews G., Laudone G., Gregory A., Bird N., de Matthews A., Whalley W. 2010. Measurement and simulation of the effect of comapction on the pore structure and saturated hydraulic conductivity of grassland and arable soil. Water Resources Research 46, doi: 10.1029/2009WR007720.
MunkholmL.,SchjønningP., RasmussenK., Tandrup K. 2003. Spatial and temporal effects of direct drilling on soil structure in the seedling environment. Soil Till. Res. 71, 163-173.
Munkholm L.J., Hansen E.M., Olesen J.E. 2008. The effect of tillage intensity on soil structure and winter wheat root/shoot growth. Soil Use Manage. 24, 392-400.
Nimmo, J.R. 2004. Porosity and pore size distribution. In Hillel D. (ed) Encyclopedia of Soils in the Environment. London, Elsevier, v. 3, 295-303.
Pagliai M., Kutilek M. 2008. Soil micromorphology and soil hydraulics. S. Kapur et al. (eds), New Trends in Soil Micromorphology, Springer-Verlag Berlin Heidelberg, 5-17.
Raper R.L., Reeves D.W., Burmester C.H., Schwab E.B. 2000. Tillage depth, tillage timing, and cover crop effects on cotton yield, soil strength, and tillage energy. Appl. Eng. Agric. 16, 379–385.
Roisin C. 2007. A multifractal approach for assessing the structural state of tilled soils. Soil Science Society of America Journal 71, 15-25.
Richard G., Cousin I., Sillon J.-F., Bruand A., Guérif J. (2001). Effect of compaction on the porosity of a silty soil: influence on unsaturated hydraulic properties. European Journal of Soil Science 52, 49-58.
Simoes R., Raper R., Arriaga F. , Balkcom K., Shaw J. 2009. Using conservation systems to alleviate soil compaction in a Southeastern United States Ultisol. Soil Till. Res. 104(1), 106-114.
Strudley M.W., Green T.R., Ascough J.C., 2008. Tillage effects on soil hydraulic properties in space and time: state of the science. Soil Till. Res. 99 (1), 4–48.
Tebrügge F., Düring R. 1999. Reducing tillage intensity – a review of results from a long-term study in Germany. Soil Till. Res. 53, 15-28.
Wiermann, C., Werner D., Horn R., Rostek, J., Werner, B. 2000. Stress/strain processes in a structured unsaturated silty loam Luvisol under different tillage treatments in Germany. Soil Till. Res., 53(2), 117-128.