To link to this article: DOI: 10.1016/j.clay.2011.03.009
URL: http://dx.doi.org/10.1016/j.clay.2011.03.009
This is an author-deposited version published in:
http://oatao.univ-toulouse.fr/
Eprints ID: 5631
To cite this version:
Bouna, L. and Rhouta, B. and Amjoud, M. and Maury, Francis and Lafont,
Marie-Christine and Jada, A. and Senocq, François and Daoudi, L.
Synthesis, characterization and photocatalytic activity of TiO2 supported
natural palygorskite microfibers. (2011) Applied Clay Science, vol. 52 (n°
3). pp. 301-311. ISSN 0169-1317
O
pen
A
rchive
T
oulouse
A
rchive
O
uverte (
OATAO
)
OATAO is an open access repository that collects the work of Toulouse researchers
and makes it freely available over the web where possible.
Any correspondence concerning this service should be sent to the repository
administrator:
staff-oatao@listes.diff.inp-toulouse.fr
Research Paper
Synthesis, characterization and photocatalytic activity of TiO
2
supported natural
palygorskite microfibers
L. Bouna
a,c,d, B. Rhouta
a,⁎
, M. Amjoud
a, F. Maury
c, M.-C. Lafont
c, A. Jada
d, F. Senocq
c, L. Daoudi
baLaboratoire de Matière Condensée et Nanostructures (LMCN), Faculté des Sciences et Techniques Guéliz, Université Cadi Ayyad, BP 549, Marrakech, Maroc bLaboratoire de Géosciences et Géoenvironnement, Faculté des Sciences et Techniques Guéliz, Université Cadi Ayyad, BP 549, Marrakech, Maroc
cCIRIMAT, Université de Toulouse, CNRS-UPS-INP, ENSIACET, 4 allée Emile Monso, BP 44362, 31030 Toulouse, cedex 4, France
dInstitut de Sciences des Matériaux de Mulhouse (IS2M), LRC 7228 – CNRS, 15 rue Jean Starcky, BP 2488, 68057 Mulhouse cedex, France
a b s t r a c t
Keywords: Palygorskite TiO2 Photocatalysis Inorganic–inorganic nanocomposites Orange G pollutantThis study deals with the synthesis of TiO2supported Moroccan palygorskite fibers and their use as photocatalyst for the removal of Orange G pollutant from wastewater. The TiO2-palygorskite nanocomposite synthesis was accomplished according to a colloidal route involving a cationic surfactant as template (hexadecyltrimethy-lammonium bromide) assuring hence organophilic environment for the formation of TiO2nanoparticles. The clay minerals samples were characterized before and after functionalization with TiO2. Anatase crystallizes above ca. 450 °C and remarkably remains stable up to 900 °C. In contrast, pure TiO2xerogel obtained from titanium tetraisopropoxide (TTIP) showed before calcination a nanocrystalline structure of anatase. By increasing the temperature, anatase readily transforms into rutile beyond 600 °C. The remarkable stability at high temperature of anatase particles immobilized onto palygorskite microfibers was due to the hindrance of particles growth by sintering. Homogeneous monodisperse distribution of anatase particles with an average size of 8 nm was found by TEM and XRD onto palygorskite fibers. This anatase particle size remains below the nucleus critical size (ca. 11 nm) required for anatase–rutile transition. The TiO2supported palygorskite sample annealed in air at 600 °C for 1 h exhibits the highest photocatalytic activity towards the degradation of Orange G compared to nanocomposite samples prepared under different conditions as well as pure TiO2powders obtained from the xerogel route or commercially available as Degussa P25.
1. Introduction
Heterogeneous photocatalysis has emerged as an alternative advanced oxidation process for water decontamination. Indeed, due to the generation of strong oxidant species (holes h+and radicals.OH) upon UV irradiation of semiconductor oxides, heterogeneous photo-catalysis is able to decompose and to mineralize bio-recalcitrant organic pollutants in the form of CO2and H2O (Carp et al., 2004;
Fujishima et al., 2000; Fujishima and Zhang, 2006; Herrmann, 1999; Paz, 2006; Robertson, 1996).
Practically, the commercial TiO2nanopowder Degussa P25, made up of anatase (80%) and rutile (20%), is the most active photocatalyst used in wastewater treatment (Herrmann, 1999; Nieto-Suárez et al., 2009). Nevertheless, TiO2powder nanoparticles easily agglomerate which reduces photonic efficiency for most degradation processes to less than 10% (Houari et al., 2005) and needs to implement costly microfiltration processes for recovering micron sized aggregated
particles from water decontaminated by TiO2slurry (Carp et al., 2004;
Herrmann, 1999; Houari et al., 2005; Liu et al., 2009). Therefore, researches recently have focused on improving photocatalysis activity by the development of TiO2supported photocatalysts.
Several routes have been explored to prepare TiO2 supported photocatalysts on a variety of supports such glass fibers (Robert et al., 1999), carbon (Herbig and Lobmann, 2004), beads (Jung et al., 2005), membranes (Kim et al., 2007) and glass micro-fiber fabrics ( Saranto-poulos et al., 2007, 2009). Generally, the efficiency of the overall photocatalytic process decreases as the catalyst is immobilized because the illuminated surface area is smaller by several orders of magnitude (Fernandez-Ibanez et al., 1999). Thus, porous materials or more generally materials exhibiting high specific surface areas like silica gels (Chuan et al., 2004), zeolites (Reddy et al., 2003), activated carbons (Herrmann et al., 1999; Nagaoka et al., 2002) and clay minerals (An et al., 2008; Aranda et al., 2008; Feng et al; 2003; Houari et al., 2005; Liu et al., 2009; Nieto-Suárez et al., 2009) were considered as alternative supports. Among the clay mineral family, the smectite group was the most common support used to perform TiO2supported photocatalyst. Indeed, owing to their lamellar structure, their high specific surface area and microporous volume, as well as their adsorption properties (Bouberka et al., 2008; Xu et al., 2008), these
⁎ Corresponding author. Tel.: +212 6 60 90 34 55; fax: +212 5 24 43 31 70. E-mail address:rhoutab@yahoo.fr(B. Rhouta).
clay minerals were involved in the development of TiO2interlayer pillared clays (Ti-PILC) and have been considered as attractive solutions (An et al., 2008; Feng et al., 2003; Houari et al., 2005; Khalfallah Boudali et al., 1994). However, the photocatalytic activity of these materials was lower with respect to that of anatase (Fujishima and Zhang, 2006). This is likely due to the amorphous or poorly crystalline structure of the TiO2 pillars due to highly acidic sol precursors (pH b 1.8) used in the preparation of Ti-PILC (Liu et al., 2009). Furthermore, the acidic conditions needed for the hydrolysis of Ti precursor, e.g. TiCl4 or titanium tetraisopropoxide (TTIP), are so severe that they induce the dissolution of clay minerals. Thus, researches were more recently focused on developing soft methods for functionalizing clay minerals with TiO2.
In this respect,An et al. (2008)have published the immobilization of commercial TiO2 Degussa P25 on the surface and interspatial regions of montmorillonite. Beforehand, the clay was transformed into hydrophobic sample by ion exchange reaction with a cation surfactant, the hexadecyltrimethylammonium bromide (CTAB). Like-wise,Aranda et al. (2008)have reported a colloidal route involving in situ soft controlled hydrolysis (using water addition and a few drops of HCl) of titanium alkoxide precursor onto surfaces of sepiolite, a fibrous clay mineral, beforehand converted into organophilic material by CTAB surfactant (Aranda et al., 2008). Upon calcination, the CTAB, acting as template of TiO2particle formation, was eliminated leading to the distribution of oxide particles onto sepiolite microfibers. It is worth noting that the formation of stable active TiO2anatase onto sepiolite fibers was observed only after doping with sulfur (Aranda et al., 2008). The success of the colloidal procedure for the nanocompo-site preparation, i.e. oxide particles attached to clay mineral, depends on the nature of clay minerals (Letaïef et al., 2006). Although palygorskite and sepiolite are both fibrous clay minerals, their structural features are different (Brigatti et al., 2006). Indeed, sepiolite is a microfibrous magnesian silicate with small crystal size, large specific surface area (≈335 m2/g for the sample from Yunclillos (Toledo, Spain) exploited by TOLSA S.A. (Aranda et al., 2008; Ruiz-Hitzky, 2001), three tetrahedral silica chains in ribbons and pure trioctahedral character. In contrast, palygorskite is a microfibrous magnesian silicate containing noticeable amounts of Al and/or Fe with large crystals size, low specific surface area (≈153 m2/g for the sample from Serradilla (Cáceres, Spain) exploited by TOLSA S.A. (Blanco et al., 1989)), and two tetrahedral silica chains in ribbons with a predominant dioctahedral character. These different features could cause disparities in their behaviors against functionalization with TiO2 and subsequently the photocatalytic activity of the nanocomposite.
The present work reports on the synthesis and characterization of active anatase TiO2photocatalyst supported onto palygorskite fibers. This nanocomposite material was prepared via a colloidal route and anatase particles were found remarkably stable up to 900 °C without intentional doping of titania. Different samples were prepared depending on the annealing treatment and a TiO2-palygorskite nanocomposite was found exhibiting photocatalytic activity higher than that of the commercially available Degussa P25 TiO2 powder towards the removal of the organic dye Orange G (OG) considered as model pollutant.
2. Experimental 2.1. Clay purification
Natural raw clay (labeled Pal) was sampled from Marrakech High-Atlas region. It was reported to be particularly rich into palygorskite (Benaboud et al., 1996; Daoudi, 2004; Daoudi et al., 2009). These samples were first crushed and sieved through a 20 μm sieve. They contain about 31 wt. % of carbonates. Thereafter, 20 g of clay powder was treated under stirring at room temperature with 200 cm3 of sodium acetate buffer solution having a pH of 4.5. This treatment has
the advantage to avoid the alteration of the clay mineral fraction (Shariatmadari, 1998). The samples were washed by successive centrifugations (4000 rpm for 10 min) to remove acid and acetate traces (tested by measurements of pH and conductivity of superna-tants). The carbonate amount was decreased to ca. 25 and 20% after 1 h and 3 days of treatment, respectively. Homoionic sodium mineral sample (labeled Na+-Pal) with an average particle diameter lower than 2 μm was isolated from raw clay according to a procedure described elsewhere (Rhouta et al., 2008).
2.2. Preparation of TiO2supported palygorskite nanocomposite All chemicals including titanium tetraisopropoxide (TTIP) and hexadecyltrimethylammonium bromide (CTAB) were purchased from Aldrich and used as received without further purification. The preparation of TiO2 supported palygorskite nanocomposite was achieved according to an adapted colloidal procedure previously de-scribed (Aranda et al., 2008). Briefly, organo-clay sample (CTA+-Pal) was first prepared at 50 °C for 48 h by ion exchange reaction of Na+ -Pal aqueous dispersion (3 g in 300 cm3) with 0.2 g of CTAB (3 cationic exchange capacity, CEC). Thereafter, 5 cm3 of TTIP was added to a dispersion of 1 g of CTA+-Pal in isopropanol (7 cm3). Finally, water was added drop wise under stirring until the spontaneous formation of a gel. The gel (labeled CTA+-Pal-Ti) was dried at 60 °C for 2 days and thereafter calcined at different temperatures (°C) and times (h). The samples were designated as CTA+-Pal-Ti-T-t, where T is the calcination temperature and t the time (e.g., CTA+-Pal-Ti-600-1 is a sample functionalized with TiO2annealed in air at 600 °C for 1 h).
In parallel, TiO2xerogel (labeled Ti-gel) was prepared according to the above conditions, i.e. hydrolyzing a mixture of 5 cm3of TTIP and isopropanol (50% v/v) by slow addition of increasing amounts of water. The xerogel sample was dried at 60 °C for 2 days and heated in air at different temperatures. The powder samples obtained were designated Ti-gel-T-t (e.g. Ti-gel-600-1 is a TiO2powder prepared by the xerogel route and calcined in air at 600 °C for 1 h).
2.3. Characterization techniques
The CEC of the purified palygorskite fraction (Na+-Pal) was evaluated by titration of the clay minerals with the cationic surfactant CTAB. The point of zero charge (PZC) was determined from the analysis of the curve depicting the streaming induced potential (SIP) variation versus the added amount of surfactant. The SIP measure-ments were carried out by using a Müteck Instrument (Particle Charge Detector, PCD) as described elsewhere (Jada et al., 2006).
The different samples were characterized before and after functionalization with TiO2by different techniques. The structural changes of TiO2was analyzed in situ versus the temperature by X-ray diffraction (XRD) through the two-theta range 2–60° using a Bruker D8 Advance diffractometer equipped with a Vantec Super Speed detector and a MRI radiation heating chamber (Bragg–Brentano configuration; Ni filtered Cu Kαradiation). The diffractograms were recorded every 50 °C from the room temperature to 950 °C. An isotherm was maintained at each level for 40 min to carry out the analysis then the temperature was increased using a ramp of 1° s− 1. XRD at room temperature was recorded in the same angular range using a Seifert XRD 3000TT diffractometer equipped with a graphite monochromator (Bragg-Brentano configuration; Cu Kα radiation). Differential thermal analysis (DTA) and thermo-gravimetric (TG) studies were performed using a Labsys apparatus (Setaram) with 60 mg of clay powder analyzed at temperatures ranging from 25 to 1000 °C with a heating rate of 10 °C min− 1. A Jeol JSM 6400 scanning electron microscope (SEM) equipped with an Oxford energy disper-sive spectrometer, EDS (Si–Li detector; MK program) and a JEOL JEM 2010 transmission electron microscopy (TEM) equipped with a
TRACOR EDS were used for characterizing clay particles and performing local elemental composition.
Chemical analyses of the palygorskite fibers before and after functionalization with TiO2 were obtained by X-ray photoelectron spectrometry (XPS) using a VG ESCALAB MK II instrument operating with an Al kαsource (1486.6 eV). The binding energy shifts due to electrical charging of specimens were corrected with respect to the C 1 s core level fixed at 285.0 eV. The chemical compositions of different samples were determined by induced coupled plasma (ICP) using Serie X 2 apparatus from Thermo Electron equipped with a Meinhard nebulizer and a detector ETP simulscan. For Ti analysis, the isotopes 47Ti and49
Ti were used with a collision cell technology. The specific surface areas were determined by the Brunauner–Emmett–Teller (BET) method from nitrogen adsorption isotherms at 77 K using an adsorption analyzer from Micromeritics (ASAP 2020 V 3.01 H). 2.4. Evaluation of photocatalytic activity
The photocatalytic activity of different samples was evaluated by measuring the decomposition rate of OG aqueous solutions containing a dispersion of the photocatalyst. This anionic dye compound (purchased from Aldrich) was selected as model pollutant because we previously demonstrated that its adsorption onto clay minerals was negligible due to electrostatic repulsion between negatively charged clay particles and dye molecules (Bouna et al., 2010). The degradation reaction was carried out in a batch quartz reactor (40 ⁎ 20⁎ 36 mm3) placed in a thermostated chamber (25 °C) under the UV light of a lamp (HPLN Philips 125 W) emitting at 365 nm. The reactor was irradiated with a photon flux of 1 mW.cm-2by adjusting the distance to the lamp so that it is the UV intensity of solar spectrum on the earth (Hofstadler et al., 1994). This lamp was chosen because the OG absorption is negligible at this wavelength and, as a result, the direct photolysis of the solution (without photocatalyst) was found negligible for more than 24 h. The photocatalyst powder of either TiO2-palygorskite nanocomposites or pure TiO2 powders prepared from TTIP or commercially available (Degussa P25) was added to 25 cm3of OG solution (10− 5M) in an amount equal to 1 g dm− 3. This catalyst mass was considered as optimum to avoid excess of catalyst and to ensure an efficient absorption of the photons (Herrmann et al., 1999). The dispersion was agitated with an inert Teflon magnetic stirrer. To determine the dye concentration, aliquots were taken from the mixture at regular time intervals and centrifuged at 12,500 rpm for 5 min. The OG concentration in the supernatant was determined by measuring the absorbance at 480 nm using a UV–VIS–NIR spectrophotometer (Perking Elmer lambda 19).
3. Results and discussion 3.1. Characterization of the samples
The different samples were characterized before and after modification with CTAB and functionalization with TiO2.
3.1.1. Pal and Na+-Pal
3.1.1.1. XRD analysis.Fig. 1A represents the XRD spectra of the raw Pal and the Na+
-exchanged b2 μm fraction (Na+-Pal). The raw clay is constituted of palygorskite and side minerals as quartz and carbonates both in the form of calcite Mg0.03Ca0.97CO3(JCPDS file: 01-089-1304) and ankerite Ca1.01Mg0.45Fe0.54(CO3)2(JCPDS file: 01-084-2066). The palygorskite XRD peaks are observed at the same angular positions than those reported by other authors (Artioli and Galli, 1994; Chisholm, 1990, 1992; Christ et al., 1969) and the basal reflection d (110) is found at 1.056 nm (2θ~8.36°). The intensity of the XRD reflections of calcite strongly decreases in Na+-Pal sample indicating that this phase disappears upon purification treatment. Nevertheless,
the proportion of ankerite remains stable even upon 3 days of acidic treatment. The diffractograms obtained from oriented flat plates of the purified Na+
-exchanged fine (b2 μm) fraction (Na+-Pal) after being either glycolated or heat treated at 500 °C (Fig. 1B) show that the reflection d(110) at 1.056 nm is not affected by ethylene glycol solvation or the heat treatment. This confirms that the palygorskite investigated herein is not associated to any swellable smectite in contrast to the palygorskite from phosphorite deposits of Gantour (Morocco) reported byChahi et al., 2002.
3.1.1.2. Chemical compositions, CEC and specific surface area measurements. The composition of Na+-Pal sample determined by ICP was (wt.%): SiO
2:
36.31; Al2O3: 4.95; Fe2O3: 2.33; MgO: 14.19; CaO: 26.41; Na2O: 0.46; TiO2: 0.23 with ignition loss of about 14.24%. The CEC of the Na+ -exchanged clay mineral fraction (Na+-Pal) has been assessed from titration curves of clay minerals with CTAB surfactant according to a previous work (Jada et al., 2006). The value determined from CTAB concentrations at the isoelectric point (IEP) is approximately 8 meq/ 100 g. The nitrogen adsorption-desorption isotherms of the clay mineral correspond to type II in the IUPAC classification with a small hysteresis loop (Fig. 2). The specific surface area determined according to the BET method is ca. 40.7 m2g− 1with a porous volume of ca. 0.2 cm3g− 1. 3.1.1.3. Thermal analysis. The TG-DTA analysis of Na+-Pal sample shows thermograms characteristic of palygorskite (Fig. 3). Indeed, an
10 20 30 40 50 60
10 20 30 40 50 60
A
Two theta (deg)
Pal sample Q X R D In te n s it y (a .u ) X R D In te n s it y (a .u ) P P PP A P P P A A A A C C C C C C C C A A Na+-Pal sample Q 2 4 6 8 10 12 14 (b) Na+-Pal glycolated for 6h (a) Na+-Pal d(200) = 0.644 nm d(110) = 1.056 nm (c) Na+-Pal annealed at 773 K, 2h Tw o theta (deg)
A
B
Fig. 1. XRD patterns of (A) raw Pal and Na+-exchanged b2 μm mineral fraction (Na+-Pal)
and (B) oriented flat plates of Na+-exchanged fine clay mineral fraction (Na+-Pal)
before and after ethylene glycol solvation and annealing at 500 °C for 2 h (P: Palygorskite; Q: Quartz; C: Calcite; A: Ankerite).
endothermic effect is observed occurring at 110 °C associated with weight loss of ≈5%. This is due to the removal of physisorbed water and part of zeolitic water filling tunnels (Önal and Sarıkaya, 2009 and Huang et al., 2007). Another endothermic peak is observed between 160 and 330 °C at a maximum of 248 °C with weight loss around 2%. This is ascribed to the elimination of the remaining zeolitic water (Önal and Sarıkaya, 2009) and/or to water coordinated to octahedral
edge cations (Huang et al., 2007). Between 330 and 590 °C, a broad endothermic effect is observed with a maximum at 480 °C associated with weight loss of ≈3%. This peak could be attributed to the loss of the residual coordinated water and/or of crystalline water by dehydroxylation of the inner octahedral cations (Huang et al., 2007). According to Huang et al., 2007, the broad profile of this peak could be explained by overlaps with secondary peaks due to the dehydroxylation corresponding to the different occupations of octahedral sites, e.g Fe3+, Al3+, Mg2+, or the vacancy. For tempera-tures ranging from 600 to 830 °C, a complex endothermic effect is observed made up of four sub-peaks with maxima at 755, 787, 796 and 814 °C, with mass loss of about 15%. These secondary peaks could be ascribed to a series of phenomena of the removal of carbonates (calcite and/or ankerite) and also probably to transformation reaction of ankerite to calcite (Dasgupta and Phil, 1965). An endothermic peak at 822 °C with mass loss about 4% is further observed which could be ascribed to the removal of the remaining crystalline water by dehydroxylation (Önal and Sarıkaya, 2009). The exothermic peak observed at approximately 855 °C without any weight loss corre-sponds to recrystallisation of palygorskite.
3.1.1.4. FTIR. The infrared spectrum of the Na+-homoionic clay mineral (Na+-Pal) (Fig. 4) is similar to that reported in literature for palygorskite (Blanco et al., 1989; Chahi et al., 2002; Suárez and García-Romero, 2006). Indeed, the absorption bands observed between 3000 and 3800 cm− 1correspond to the stretching of the hydroxyl groups (Al and / or Fe and/or Mg) OH. The peak centred at 3620 cm− 1, ascribed to OH stretching mode in Al-Al-OH, is particularly charac-teristic of palygorskite (Suárez and García-Romero, 2006;Blanco et al., 1989). The absorption bands centred at about 3430 and 3270 cm− 1 correspond to the vibration of physisorbed water (surface and zeolitic) which interacts with each other because of the hydrogen bridges (Blanco et al., 1989). The band at 1660 cm− 1with a shoulder at 1640 cm− 1 is ascribed to the bending modes of coordinated, absorbed and zeolitic water (Blanco et al., 1989; Önal and Sarıkaya, 2009; Suárez and García-Romero, 2006). In agreement with thermal analysis (Fig. 3) and XRD analysis (Fig. 1), the peak at 1440 cm− 1 confirms the remaining carbonate impurities (Rhouta et al., 2008). The small band at 1200 cm-1is a characteristic of palygorskite because it doesn't appear in any silicates except sepiolite. It is ascribed to Si– O–Si bond between alternative ribbons at the point of periodical inversion apical oxygen in tetrahedral within the structure of fibrous minerals (palygorskite and sepiolite). Absorption bands observed between 950 and 800 cm− 1 correspond to bending vibration of structural hydroxyl groups (Al and/or Fe and/or Mg)–OH. The intense peaks observed in ranges [985, 1100 cm− 1] and [400, 750 cm− 1] are
0.0 0.2 0.4 0.6 0.8 1.0 0 20 40 60 80 100 120 140 160 P / P0 N2 q u a n ti ty a d s o rb e d (c m 3.g -1)
CTA
+-Pal-Ti-600
S = 85.1 m
2.g
-1Na
+-Pal S = 40.7 m
2.g
-1Fig. 2. N2adsorption-desorption isotherms of Na+-Pal and CTA+-Pal-Ti-600-1 samples.
Temperature (°C) Exo d) Ti-gel b) CTA+-Pal a) Na+-Pal c) CTA+-Pal-Ti 200 400 600 800 1000 246 °C 385 °C 640 °C 480 °C 755 °C 855 °C 400 °C 286 °C 796 °C 258 °C Exo 110 °C H e a t fl o w (a . u .) Temperature (°C) 787 °C
(a)
(b)
(c)
(d)
0 200 400 600 800 1000 -35 -30 -25 -20 -15 -10 -5 0(b)
(d)
(c)
(a)
(b)
W e ig h t lo s s ( % ) Temperature (°C)A
B
Fig. 3. Differential thermal analysis (A) and thermo-gravimetric (B) of (a) Na+-Pal,
(b) CTA+-Pal, (c) CTA+-Pal-Ti and (d) Ti-gel. The DTA thermograms are shifted
ver-tically for clarity.
400 800 1200 1600 2000 2400 2800 3200 3600 4000 Wavenumber (cm-1) 1034 982 8 7 2 3548 472 CTA+-Pal Na+-Pal 3620 3430 3270 1660 1440 1 2 0 0 7 2 8 8 0 0 2924 2853 IR i n te n s it y ( a .u .)
Fig. 4. FTIR spectra of different samples before and after modification with CTA+and
ascribed to stretching and deformation modes respectively of Si–O and/or Al–O bonds.
3.1.2. CTA+-Pal
3.1.2.1. Thermal analysis. The Na+-exchanged clay mineral fraction (Na+
-Pal) has been modified by exchanging the charge compensating cations (Na+) in palygorskite with cationic surfactant species (CTA+) to obtain an organo-clay CTA-palygorskite sample (CTA+-Pal). The thermal analysis proves the formation of CTA modified palygorskite (Fig. 3). Indeed, the comparison of CTA+-Pal thermogram with that of the pristine sample (Na+-Pal) shows an additional exothermic peak at about 286 °C (Fig. 3A) associated with a weight loss of ca. 1.6% (Fig. 3B), which corresponds likely to the release of surfactant by pyrolysis. Moreover, the endothermic effect at 110 °C is assigned to desorption of the physisorbed water (Fig. 3A). Consistently, the corresponding weight loss (Fig. 3B) is lower for the surfactant modified CTA+-Pal sample owing to its organophilic character (1.3%) in comparison with that of the hydrophilic pristine Na+-Pal clay mineral (ca. 3%).
3.1.2.2. FTIR. The success of organophilic modification of palygorskite is further supported by FTIR spectroscopy analysis. Indeed, with respect to the pristine clay mineral (Na+-Pal),Fig. 4 shows the presence of additional absorption bands at 2924 cm− 1and 2853 cm− 1ascribed to asymmetric and symmetric stretching vibrations of C-H groups. These bands appear to be less intense which indicates that the amount of cationic surfactant retained by palygorskite is low due to its small CEC (8 meq/100 g). The corresponding deformation bands, appearing in the 1500–1200 cm− 1range, are likely overlapped in the large band centred at 1430 cm− 1of carbonate.
3.1.2.3. XPS. TheFig. 5shows typical XPS spectra of the different types of samples. The peak intensities of the elements characteristic of palygorskite, namely O 1s, Si 2s, Si 2p, Na 2s and Al 2s decrease upon the silicate modification with CTAB surfactant while that of C 1s increases (compare spectra a and b). The increase of carbon content from 28 to 38 at.% is consistent with the covering of the surface of palygorskite fibers with CTA (Table 1). The chemical modification of clay minerals with ammonium surfactants is well known to produce organo-clay (OC) minerals exhibiting high affinity towards organic species, hence making them interesting for adsorption of these compounds (Bouberka et al., 2008; Lagaly et al., 2006, Park et al., 2011). Thus, the CTA modified palygorskite (CTA+-Pal) offers an organophilic environment favorable to hydrolysis and
polycondensa-tion of TTIP (Aranda et al., 2008) yielding to the synthesis of a xerogel precursor sample (CTA+-Pal-Ti) as described in the experimental section.
3.1.3. CTA+-Pal-Ti
3.1.3.1. ICP and XPS. The ICP analysis has revealed an increase of Ti amount from about 0.14 wt. % in the pristine sample (Na+-Pal) to 25.5 wt. % in as-prepared CTA+-Pal-Ti precursor sample. XPS analysis of the sample CTA+
-Pal-Ti has confirmed the presence of titanium (Ti 2p core level due to polycondensed species of titanium) while the elements characteristic of the palygorskite disappeared except oxygen that is still present with approximately the same content (36 and 34 at. % for CTA+-Pal and CTA+-Pal-Ti respectively) (Table 1). The intensity of C 1s significantly increases for CTA+-Pal-Ti compared to CTA+-Pal due to the presence of isopropanol solvent, remaining isopropoxy groups and CTA surfactant in the CTA+-Pal-Ti sample: the carbon content increases from 38 to 58 at.% (Table 1).
3.1.3.2. Thermal analysis. The XPS results are further supported by the TG-DTA analysis. In fact, an exothermic peak at 258 °C, close to that observed at 286 °C for CTA+-Pal corresponding to the decomposition of organic matter, is observed for CTA+-Pal-Ti with a weight loss significantly higher (7.6%) than for CTA+-Pal (1.6%) (Fig. 3). This is due to the fact that for the CTA+-Pal sample a decomposition of CTAB surfactant occurs while for the CTA+-Pal-Ti sample there is in addition a decomposition of remaining isopropoxy species. Another exother-mic peak is observed for CTA+-Pal-Ti at ca. 400 °C which likely corresponds to the transition of amorphous hydroxo-oxo polycon-densed Ti phase to crystalline TiO2. These two exothermic peaks are also observed for the pure TiO2xerogel sample but they are slightly shifted to lower temperatures at 246 °C and 385 °C. As for CTA+-Pal-Ti sample they correspond to the removal of isopropanol solvent and the crystallization of as-prepared amorphous titania, respectively (Fig. 3). 3.1.4. TiO2-palygorskite nanocomposites
3.1.4.1. In situ XRD. The above results are consistent with in situ XRD analysis versus the temperature (Figs. 6 and 7). Indeed, as for the Na+-Pal sample (Fig. 1), the room temperature XRD pattern of CTA+ -Pal-Ti reveals the presence of palygorskite (evidenced by several corresponding reflections, especially the basal reflection d(110) at 1.056 nm (2θ~8.36°)), ankerite and traces of quartz (Fig. 6). Any peak of crystalline TiO2 phase is observed in this sample at room temperature. By increasing the temperature, the diffraction peaks of ankerite disappear and are no more observable above 700 °C (see for instance the main reflection at 2θ = 31°) (Figs. 6 and 7). This is in good agreement with thermal analysis (Fig. 3), which has shown an endothermic peak at ca. 750 °C associated to a weight loss of about 15% of ankerite remained in the pristine clay mineral (Na+-Pal).
The characteristic (110) reflection of palygorskite at low angles (ca. 8.36°) is still observable upon heat treatment at 300 °C (Fig. 6) while any peak of crystalline TiO2phase is observed in this sample at this temperature. Nevertheless, this reflection is no more observable above 350 °C due likely to its low intensity compared to those of other crystalline phases (Figs. 6 and 7). This does not mean that the
0 100 200 300 400 500 600 O 2 s C 1 s T i 2 p Mg KLL O 1s d) CTA+-Pal-Ti-600 X P S I n te n s it y ( a .u .)
Binding energy (eV)
S i 2 s S i 2 p N a 2 s a) Na+-Pal b) CTA+-Pal c) CTA+-Pal-Ti
Fig. 5. XPS spectra of different samples before and after modification with CTA+and
functionalization with TiO2.
Table 1
Surface composition determined by XPS of different samples before and after modification with CTA and functionalization with TiO2.
Sample Si 2s (at. %) O 1s (at. %) C 1s (at. %) Ti 2p3/2(at. %)
Na+-Pal 29 43 28 0
CTA+-Pal 26 36 38 0
CTA+-Pal-Ti 0 34 58 8
structure of palygorskite is destroyed at this temperature. Indeed, the diffractograms obtained from oriented flat plates of the Na+ -exchanged palygorskite (Na+
-Pal) have confirmed that the (110) reflection is still observable after annealing at 500 °C (Fig. 1b). Moreover, several other reflections of the palygorskite, especially the (411) peak at ca. 33°, remain observable up to 700 °C (Figs. 6 and 7). This gives evidence for a good thermal stability of the palygorskite up to at least 700 °C without significant structural folding (Huang et al., 2007). Furthermore, these diffractograms have revealed that TiO2 begins to crystallize above 450 °C in the form of anatase (JCPDS file 99-201-5379) as evidenced by the appearance of the (101) and (200) reflections at ca. 25 and 48°, respectively.
3.1.4.2. Crystallites sizes determination.Fig. 8depicts the influence of the annealing temperature of CTA+-Pal-Ti samples on the average crystallite sizes of anatase determined from the full width at half maxi-mum (FWHM) of the (101) and (200) peaks according to Scherrer's equation. Both curves show similar crystallite sizes of anatase in the two directions and the same dependence with the temperature. When anatase begins to be detected around 500 °C the crystallites size is
approximately 5 nm and it increases to reach a plateau at 8–9 nm in the temperature range 550–800 °C. It is noteworthy that no crystallite growth is observed in this broad temperature range. Beyond 800 °C, a noticeable increase of the average crystallite size is observed to reach 12 nm at 900 °C. By contrast with previous work (Aranda et al., 2008), the anatase crystallites formed on the palygorskite fibers remain remarkably stable up to 900 °C with a very small average crystallite size as evidenced by theFig. 7. A few amounts of rutile just began to be formed above 850 °C as evidenced by the weak peaks assigned with the JCPDS file 99-100-4705.
3.1.4.3. TEM. The remarkable stability of anatase crystallites on palygorskite fibers is further confirmed by TEM analyses. Fig. 9
shows the growth of monodisperse spherical anatase nanoparticles on the surface of palygorskite fibers formed after annealing in air at 600 °C of an as-prepared CTA+-Pal-Ti sample. The anatase particles form a uniform thin film covering entirely the fibers. Their average size is in the range 8–12 nm in good agreement with XRD data. EDX analyses pointed on a coated palygorskite fiber have shown large amounts of titanium compared to the bare palygorskite fibers. The elemental compositions (Si, Mg, Al, Fe) were in good agreement with that of the palygorskite confirming its good stability at 600 °C as demonstrated with XRD analysis (Figs. 6 and 7). Selected area electron diffraction carried out on palygorskite fibers coated with nanoparticles clearly has shown the ring pattern of anatase (Fig. 9c). High resolution electron microscopy has confirmed the quasi spherical shape and the nanometric size of the anatase crystallites as evidenced by crystallites exhibiting a reticular distance of ca. 0.3 nm corresponding to the {101} reflection of anatase (Fig. 9d).
Fig. 10shows TEM analyses of a TiO2-palygorskite nanocomposite sample after annealing in air at 900 °C (CTA+-Pal-Ti-900-1). Micro-structural differences are observed with respect to the sample annealed at 600 °C (CTA+-Pal-Ti-600-1). The TiO
2particles developed onto palygorskite fibers upon heat-treatment at 900 °C are signifi-cantly larger (20–50 nm) (Fig. 10a) than those observed upon annealing at 600 °C (≈8 nm) (Fig. 9). Furthermore there are domains without palygorskite fibers where oxide particles form aggregates. The average particle size in these aggregates is significantly larger (100–200 nm) than those attached to palygorskite fibers (Fig. 10c). EDX analysis of the particles in the aggregates reveals they are free TiO2nanoparticles while EDX analyses of the small one (Fig. 10a) confirm that the palygorskite fibers are covered with TiO2 as evidenced by the presence of Si, Al, Mg and Fe in addition to Ti. This also suggests the palygorskite fibers remain stable even after heat-treatment at 900 °C. 10 20 30 40 50 60
*
*
*
*
*
A: anatase,Q: quartz, An: ankerite,P: palygorskite (
*
),C: calciteCTA+-Pal-Ti-600 A A A CTA+-Pal-Ti-30 CTA+ -Pal-Ti-300 P(411) P(400) P(200) P(110) Q An A A C
*
*
*
Na+-Pal*
*
*
*
*
*
2 ThetaFig. 6. XRD patterns of CTA+-Pal-Ti precursor sample before and after heat treatments
at 300 and 600 °C showing the observation of (110) reflection of palygorskite in the as-elaborated sample as well as after its heat-treatment at 300 °C and the still observation of some harmonics reflections of palygorskite after heat treatment at 600 °C.
10 20 30 40 50 60 R P P P P P C C C * * * R R A A A A A Ankerite
Two Theta (deg) * Q N.I. XR D i n te n s ity (a .u .) 900°C 800°C 700°C 600°C 500°C 400°C 300°C 200°C 100°C 30 °C
Fig. 7. Complete XRD patterns at different temperatures in air of TiO2-palygorskite
nanocomposites (CTA+-Pal-Ti) showing the formation of anatase (A) and traces of
rutile (R) by increasing the temperature along with the disappearance of ankerite (P: palygorskite; Q: quartz; C: calcite; N.I: not identified; * alumina from the sample holder). 0 20 40 60 80 100 120 140 350 450 550 650 750 850 950 0 20 40 60 80 100 Annealing temperature (°C) C ry s ta li te s s ize ( Å ) C o n v e rs io n r a te (% )
Fig. 8. Influence of the annealing temperature of CTA+-Pal-Ti samples on the crystallites
size of anatase and on the photocatalytic conversion rate of OG in 1 h (triangles). The average crystallites sizes were determined from (101) and (200) XRD reflections of anatase (circles and squares, respectively).
Selected area electron diffraction performed on particles in aggregates exhibit a dot pattern corresponding to the [111] zone axis of rutile according to JCPDS file 01–1292 (Fig. 10d). This contrast with the ring pattern obtained from coated palygorskite fibers (Fig. 10b), that is similar to the one obtained for the sample annealed at 600 °C (Fig. 9c), and that is clearly assigned to anatase (JCPDS file 01–0562). On the other hand, it is worth noting to observe in the
Fig. 10b diffraction rings at 0.444 and 0.267 nm which are ascribed to (400) and (411) reflections respectively of palygorskite, which proves the structure of clay mineral fibers is not folded. As mentioned above, the grains of anatase do not grow excessively when they are attached to clay mineral fibers compared to free particles. This prevents their transformation into rutile phase as observed for free particles that form aggregates.
3.1.4.4. XPS. The XPS analysis carried out on TiO2 supported palygorskite nanocomposite annealed at 600 °C has revealed that the C 1 s intensity decreases due to the decomposition of organic components as isopropanol solvent, surfactant (CTAB) and remaining isopropoxy species (Fig. 5d) in agreement with thermal analysis (Fig. 3). The carbon content considerably decreases from 58 at. % for CTA+-Pal-Ti to 28 at. % for CTA+-Pal-Ti-600-1 which is the same value found for the pristine clay mineral fraction Na+-Pal (Table 1). This removal of organic matter from TiO2functionalized clay mineral is consistent with the white color of the CTA+-Pal-Ti-600-1 sample in
contrast to those treated at lower temperatures (b400 °C) which appeared black due to the formation of carbon upon surfactant calcination. As proposed by Aranda et al. (2008), the surfactant molecule (CTAB) acts as template for anchoring TiO2 to the clay mineral. Therefore, heat-treatment conditions should be appropri-ately chosen to assure the minimization of carbon contamination in the material in order to enhance the photocatalytic activity. On the other hand, upon annealing of the functionalized clay mineral, the relative amounts of titanium and oxygen increase from 8 and 34 at. % to 19 and 53 at. %, respectively (Table 1). Like in the pristine clay mineral (Na+-Pal), the N
2adsorption–desorption isotherm obtained for the TiO2-palygorskite calcined at 600 °C is of type II but with a hysteresis of types H3/H4 according to the IUPAC classification (Fig. 2). The surface area increases by a factor of 2 to reach the value of 85.1 m2g− 1.
3.1.5. Pure TiO2xerogel and oxide powders
3.1.5.1. In situ XRD. Pure titania xerogel (Ti-gel) prepared under the conditions described in the experimental section has been analyzed in situ by XRD versus the temperature up to 900 °C (Fig. 11). Unlike as-prepared titanium functionalized CTA modified palygorskite sample (CTA+-Pal-Ti) that did not exhibit crystalline TiO
2 phase before calcination (Figs. 6 and 7), the XRD pattern at room temperature of TiO2xerogel gives evidence for crystalline anatase with broad peaks at
Fig. 9. TEM micrographs of Na+-Pal (a) and CTA+-Pal-Ti-600-1 (b) samples. Selected area electron diffraction pattern indexed with anatase (c) of a CTA+-Pal-Ti-600-1 sample and
reticular distance equals 0.351, 0.237, 0.189 and 0.168 nm. As the temperature increases, the crystallinity of anatase is improved as supported by the higher intensity and lower FWHM of the XRD peaks. The anatase/rutile transition is observed around 600 °C, in good agreement with thermal analysis (Fig. 3), and the total transformation into rutile is effective beyond 650 °C.
3.1.5.2. Crystallites sizes determination.Fig. 12 represents the varia-tions of crystallites sizes of pure TiO2xerogel determined from the FWHM of (101) anatase and (110) rutile XRD reflections. In contrast
to as modified palygorskite CTA+-Pal-Ti sample (Fig. 8), the average crystallite size of anatase continuously increases from 5 nm for as-prepared TiO2 xerogel sample to 30 nm after annealing at 650 °C. Beyond this temperature, the rutile phase appears with crystallites size of ca. 40 nm which rapidly grow with the annealing temperature to reach 130 nm at 900 °C. These results prove the remarkable effect of the palygorskite fibers in stabilizing TiO2anatase phase at high temperatures and this could be due to particle size effects. Indeed, thermodynamic calculations predicted that rutile is the most stable phase at all temperatures and pressures up to 6 × 10⁶kPa (Carp et al.,
2004). However the small differences of the Gibbs free energy (4– 20 kcal mol− 1) between both phases suggest that metastable anatase
10 20 30 40 50 60
Two theta (deg)
XR D i n te n s ity (a .u .) A: anatase R: rutile A A A A R R R R R R R R R 900 800 700 600 500 400 300 200 100 30°C
Fig. 11. In situ XRD in air of a pure TiO2xerogel sample as a function of the annealing
temperature in the range 30–900 °C showing the transformation of anatase (A) to rutile (R) at ca. 600 °C.
Fig. 12. Variation of the average crystallites size of anatase (circles) and rutile (squares) from a pure TiO2xerogel sample and of the photocatalytic conversion rate of OG
(triangles) as a function of annealing temperature. Crystallite sizes were determined from (101) and (110) for anatase and rutile, respectively.
0.347
0.444
0.267
0.235
0.182
0.216
100 nm
(a)
(b)
(c)
(d)
Fig. 10. TEM micrographs of CTA+-Pal-Ti-900-1 sample showing anatase nanoparticles (20–50 nm in diameter) on a palygorskite fiber (a) and corresponding selected area electron
diffraction pattern indexed with anatase (b). The rings pointed with an arrow correspond to palygorskite. Free oxide crystallites 100–200 nm in diameter (c) and corresponding selected area electron diffraction pattern indexed with rutile (d).
can be stabilized at normal pressure and temperature as frequently observed. This is the case when particle size decreases to sufficiently low values due to predominant surface effects, e.g. surface free energy and surface stress depend on particle size (Zhang and Banfield, 1998). In this context, it has been suggested that anatase is more thermodynamically stable at sizes smaller than 11 nm while rutile is the most stable at sizes greater than 35 nm (Zhang and Banfield, 2000). From a physical point of view, the transition temperature and the rate of transformation depend on the rate of sintering of the primary anatase particles to reach the critical size (Banfield et al., 1993; Kumar et al., 1994; Wang and Ying, 1999).
TEM images ofFig. 9give evidence for a high nucleation rate of TiO2on the surface of palygorskite fibers. As a result, anatase particles are monodisperse with a mean size smaller than the critical size of ca. 11 nm. The anatase crystallites have been formed around 500 °C due to the removal of organic species which limits their size and leads to a nodular morphology and stable grain boundaries. As the critical nucleus size of rutile was reported to be at least three times larger than that of anatase (Kumar, 1995), the homogenous dispersion of TiO2anatase particles on the palygorskite fibers with an average size smaller than 11 nm likely delays the sintering and growth of the particles even at temperature as high as 900 °C. Thus, the particle sizes remain smaller than the nucleus critical size required for anatase– rutile transition as evidenced by XRD (Fig. 8) and TEM analyses (Fig. 9). The anatase particles in the TiO2xerogel already exist at room temperature (Fig. 11) leading to a higher density, which facilitates sintering and growth by increasing the temperature. The critical size for anatase/rutile transition is readily reached at ca. 550 °C as shown by XRD data (Fig. 12).
3.2. Photocatalytic activity
3.2.1. Palygorskite based materials derivates
The photocatalytic decomposition kinetics of the different samples before and after functionalization has been tested against the degra-dation of OG in aqueous solution (Fig. 13). The pristine palygorskite Na+-Pal sample has no noticeable effect to reduce the OG concen-tration. This means there is no photocatalytic activity as expected since there is no component known to exhibit such properties in this compound, and this means also that adsorption of this model pol-lutant is negligible on this sample in good agreement with our recent work (Bouna et al., 2010). This confirms OG dye compound satisfies the requirement for this photocatalytic test. Similarly as-prepared
Ti-supported CTA+-Pal-Ti sample is almost inactive since only about 15% of OG is removed in 150 min. This low decrease of the dye concentration in the aqueous solution is due to adsorption since no TiO2 anatase has been formed at this stage as deduced from XRD analysis (Figs. 6 and 7). Moreover, the CTA+-Pal-Ti sample has an organophilic character and consequently a greater affinity toward adsorption of organic compounds (Bouberka et al., 2008; Lagaly et al., 2006; Park et al., 2011). The functionalized clay mineral samples have been annealed in air at different temperatures for 1 h to promote the formation of crystalline TiO2nanoparticles.
The sample treated at 400 °C has a slightly better behavior than the untreated one but there is no evidence for photocatalytic activity since the OG degradation is very slow (Fig. 13). Anatase is not yet formed at 400 °C (Fig. 7) and there is a significant carbon contamination from the surfactant pyrolysis, which gives a dark grey color to the material. The nanocomposite materials annealed at 500 °C and even better at 600 °C exhibit important photocatalytic activity since the OG initial amount disappear in ca. 90 min. The treatment at 700 °C induces a lower efficiency than at 500–600 °C and this is worse for the sample annealed at 900 °C for which only 50% of the initial dye amount was degraded in 150 min. This behavior can be correlated to the forma-tion of active anatase nanoparticles as observed by XRD above 450 °C and to the crystallization of the less active rutile phase at high temperatures.
Table 2shows the conversion rate of OG after a photocatalytic test for 1 h except otherwise specified. The treatment in air at 500 °C for 5 h improves only slightly the photocatalytic activity (88% of OG removed) compared to that performed for 1 h (85% of OG removed). The best efficiency is observed for the sample treated at 600 °C for 1 h (89% of OG removed) then the activity decreases by increasing the annealing temperature but they are still active at 900 °C (25% of OG removed). This behavior is likely due to the good thermal stability of anatase when the temperature and the annealing time increases and to the structural changes. The best photocatalytic activity is observed for samples calcined in the temperature range 500–600 °C for which the average crystallite size of anatase is 8 nm (Fig. 9). The decrease of photocatalytic activity above this temperature range could be due to the increase of anatase crystallite size and, at 900 °C, to the onset of rutile formation.
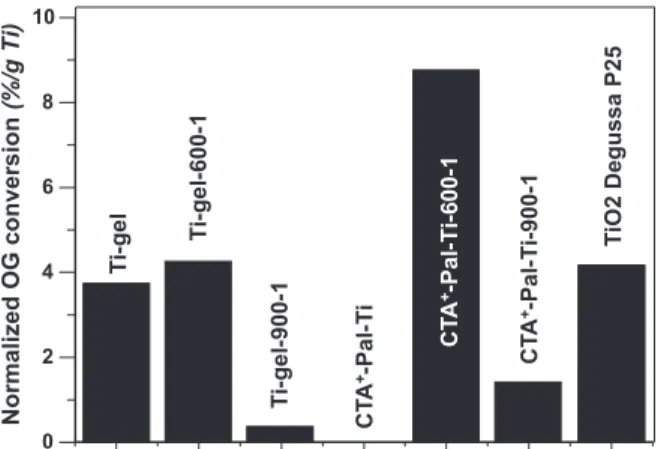
3.2.2. Photocatalytic activity of TiO2-palygorskite nanocomposite compared to pure TiO2powders
The photocatalytic activity of TiO2supported palygorskite nano-composites (CTA+-Pal-Ti-600-1 sample) has been compared to pure TiO2powders: (i) commercial Degussa P25 and (ii) TiO2obtained by the xerogel route.Fig. 14depicts the OG proportion normalized by the mass of titanium really present in each sample that has been converted during photocatalytic tests in 30 min. These results clearly show that the TiO2supported palygorskite nanocomposite prepared by heating in air at 600 °C is the most efficient. This supported photocatalyst exhibits an activity twice higher than those of the pure TiO2powders (Degussa P25 and Ti-gel-600-1). The small size and the better dispersion of TiO2nanoparticles immobilized on the palygorskite fibers prevent agglomeration, which maintains a high specific surface area and accounts for this good efficiency. Before calcination at 600 °C, TiO2xerogel sample (Ti-gel) is more active than
0 30 60 90 120 150 0.0 0.2 0.4 0.6 0.8 1.0 700 °C 500 °C 600 °C 900 °C 400 °C CTA+-Pal-Ti Na+-Pal Time (min) O G c o n c e n tr a ti o n s r a ti o (C /C 0 )
Fig. 13. Change in OG concentration (where C0and C, are the OG concentrations,
respectively, at the initial time t = 0, and after an elapsed time t of the photocatalytic reaction) versus irradiation time of Na+-exchanged palygorskite (Na+-Pal), organo
palygorskite functionalized precursor (CTA+-Pal-Ti) and different TiO
2-palygorskite
nanocomposites obtained upon annealing for 1 h at different temperatures in the range 400–900 °C.
Table 2
Orange G proportion removed from aqueous solutions during a photocatalytic test in 1 h for different samples before and after functionalization and heat treatment in air.
Sample Na+ -Pal CTA+ -Pal-Ti 400 C-1 h 500 C-1 h 500 C-5 h 600 C-1 h 700 C-1 h 900 C-1 h % of removal of OG 1.24 4.37 7.46 84.07 88.05 89.07 78.76 24.96
untreated Ti-supported palygorskite (CTA+-Pal-Ti). As evidenced by XRD versus the temperature this is due to the presence of crystalline anatase in the TiO2xerogel prepared at room temperature (Fig. 11) while annealing above 500 °C is required for crystallization of anatase in CTA+-Pal-Ti sample (Fig. 7). The heat treatment at 600 °C of the TiO2xerogel slightly improves the photocatalytic activity due to the improvement of the anatase crystallization which exhibits average crystallite size of ca. 20 nm (Fig. 12). Beyond this temperature, the photocatalytic activity drastically drops as the anatase crystallite size increases causing the formation of the less active rutile phase (Fig. 12). For instance, the xerogel precursor calcined at 900 °C exhibits photocatalytic efficiency significantly lower than that of TiO2 supported palygorskite obtained at the same temperature. This behavior is ascribed to the formation of rutile which is almost the single phase starting from TiO2xerogel (Fig. 11) while only traces are found in CTA+-Pal-Ti-900-1 sample for which anatase is still the dominant phase (Fig. 7).
4. Conclusions
The preparation of inorganic–inorganic nanocomposites, TiO2 supported onto natural fibers of Moroccan palygorskite, by a sol-gel method using a cationic surfactant as template was achieved. XRD versus temperature has demonstrated that TiO2 crystallizes above 450 °C in the form of anatase, which remarkably remains stable up to 900 °C. The stabilization of this TiO2phase is due to the nanometric size of the particles immobilized onto palygorskite fibers, which prevents sintering and growth beyond the nucleus critical size (ca.11 nm) required for the anatase–rutile transition. This is supported by XRD and TEM analyses, which have shown homoge-neous and monodisperse distribution of nodular anatase nanoparti-cles (average size 8 nm) onto palygorskite fibers for sample annealed in air at 600 °C for 1 h.
This sample exhibits the highest photocatalytic activity against the removal of OG selected as model pollutant in aqueous solution, even compared to pure TiO2powders as commercial Degussa P25 and TiO2 powder originating from xerogel route. All characterizations allow concluding that for this best photocatalyst sample (CTA+ -Pal-Ti-600-1) the structural folding of palygorskite is not significant, the carbon contamination is minimized and the anatase nanoparticles are thermally stable, smaller than 10 nm, well dispersed and immobilized on the surface of palygorskite fibers. Besides, this supported pho-tocatalyst easily flocculate so that it is readily removable from treated solutions. This work contributes to the valorization of natural clays and to the preservation of water by efficient treatment of waste waters.
Acknowledgements
The financial supports from the “Convention de cooperation CNRST-Maroc/CNRS-France” (chemistry project No 04/08), the “Programme de Coopération Scientifique Interuniversitaire de l'Agence Universitaire de la Francophonie” (No 63 13PS826) and the “Programme d'Action Intégrée Volubilis” (No MA-08-185) are gratefully acknowledged. Authors thank Drs. E. Ruiz-Hitzky and P. Aranda (Instituto de Ciencia de Materiales de Madrid, CSIC, Spain) for fruitful discussions on clay minerals and Pr Mohamed Saïd Mehahed for his help in revising the English language of the paper.
References
An, T., Chen, J., Li, G., Ding, X., Sheng, G., Fu, J., Mai, B., O'Shea, K.-E., 2008. Characterization and photocatalytic activity of TiO2 immobilized hydrophobic
montmorillonite photocatalysts: degradation of decabromodiphenyl ether (BDE 209). Catal. Today 139, 69–76.
Aranda, P., Kun, R., Martin-Luengo, M.A., Letaïef, S., Dékány, I., Ruiz-Hitzky, E., 2008. Titania-sepiolite nanocomposites prepared by a surfactant templating colloidal route. Chem. Mater. 20, 84–91.
Artioli, G., Galli, E., 1994. The crystal structures of orthorhombic and monoclinic palygorskite. Mater. Sci. Forum 166–169, 647–652.
Banfield, J.F., Bischoff, B.L., Anderson, M.A., 1993. TiO2accessory minerals: coarsening,
and transformation kinetics in pure and doped synthetic nanocrystalline materials. Chem. Geol. 110, 211–231.
Benaboud, A., Lopez Galindo, A., Fenoll Hach-Ali, P., Chellai, E.H., Daoudi, L., 1996. The presence, genesis and significance of palygorskite in some Moroccan Tertiary sequences. In: Ortega, M., López-Galindo, A., Palomo, I. (Eds.), Advances in Clay Minerals, Spanish–Italian Meeting on Clay Minerals, Granada, pp. 87–89. Blanco, C., Gonzalez, F., Pesquera, C., Benito, I., Mendioroz, S., Pakhares, J.A., 1989.
Differences between one palygorskite and another magnesic by infrared spectros-copy. Spectrosc. Lett. 22 (6), 659–673.
Bouberka, Z., Khenifi, A., Sekrane, F., Bettahar, N., Derriche, Z., 2008. Removal of 2,4-DCP from wastewater by CTAB/bentonite using one-step and two-step methods: a comparative study. Chem. Eng. J. 136, 295–305.
Bouna, L., Rhouta, B., Amjoud, M., Jada, A., Maury, F., Daoudi, L., Senocq, F., 2010. Correlation between eletrokinetic mobility and ionic dyes adsorption of Moroccan Stevensite. Appl. Clay Sci. 48, 527–530.
Brigatti, M.F., Galan, E., Theng, B.K.G., 2006. Structures and mineralogy of clay minerals. In: Bergaya, F., Theng, B.K.G., Lagaly, G. (Eds.), Handbook of clay science. Developments in Clay Science, 1. Elsevier, pp. 19–86.
Carp, O., Huisman, C.L., Reller, A., 2004. Photoinduced reactivity of titanium dioxide. Prog. Solid State Chem. 32, 33–177.
Chahi, A., Petit, S., Decarreau, A., 2002. Infrared evidence of dioctahedral–trioctahedral site occupancy in palygorskite. Clays Clay Miner. 50, 306–313.
Chisholm, J.E., 1990. An X-ray powder-diffraction study of palygorskite. Can. Mineral. 28, 329–339.
Chisholm, J.E., 1992. Powder diffraction patterns and structural models for palygorskite. Can. Mineral. 30, 61–73.
Christ, C.L., Hathaway, J.C., Hostetler, P.B., Shepard, A.O., 1969. Palygorskite: new X-ray data. Am. Mineral. 54, 198–205.
Chuan, X.-Y., Hirano, M., Inagaki, M., 2004. Preparation and photocatalytic performance of anatase-mounted natural porous silica, pumice, by hydrolysis under hydrother-mal conditions. Appl. Catal. B. 51, 255–260.
Daoudi, L., 2004. Palygorskite in the uppermost Cretaceous–Eocene Rocks from Marrakech High Atlas, Morocco. J. Afr. Earth Sci. 39, 353–358.
Daoudi, L., Knidiri, A., Rhouta, B., 2009. Structure, properties and genesis of Moroccan palygorskite. Orient. J. Chem. 25, 855–862.
Dasgupta, D.R., Phil, D., 1965. The transformation of ankerite during thermal treatment. Min. Mag. 35, 634–639.
Feng, J., Hu, X., Yue, P.-L., Zhu, H.-Y., Lu, G.-Q., 2003. A novel laponite clay-based Fe nanocomposite and its photo-catalytic activity in photo-assisted degradation of Orange II. Chem. Eng. Sci. 58, 679–685.
Fernandez-Ibanez, P., Malato, S., Enea, O., 1999. Photochemical reactor for solar decontamination of water. Catal. Today 54, 329–339.
Fujishima, A., Zhang, X., 2006. Titanium dioxide photocatalysis: present situation and future approaches. C.R. Chim. 9, 750–760.
Fujishima, A., Rao, T.-N., Tryk, D.-A., 2000. Titanium dioxide photocatalysis. J. Photochem. Photobiol. C 1, 1–21.
Herbig, B., Lobmann, P., 2004. TiO2photocatalysts deposited on fiber substrates by
liquid phase deposition. J. Photochem. Photobiol. A 163, 359–365.
Herrmann, J.-M., 1999. Heterogeneous photocatalysis: fundamentals and appli-cations to the removal of various types of aqueous pollutants. Catal. Today 53, 115–129.
Herrmann, J.M., Matos, J., Disdier, J., Guillard, C., Laine, J., Malato, S., Blanco, J., 1999. Solar photocatalytic degradation of 4-chlorophenol using the synergistic effect between titania and activated carbonin aqueous suspension. Catal. Today 54, 255–265. Hofstadler, K., Rupert, B., Novalic, S., Heisler, G., 1994. New reactor design for photocatalytic wastewater treatment with TiO2immobilized on fused-silica glass
fibers: photomineralization of 4-chlorophenol. Environ. Sci. Technol. 28, 670–674.
C T A +-P a l-T i T i-g e l C T A +-P a l-T i-6 0 0 -1 T i-g e l-6 0 0 -1 C T A +-P a l-T i-9 0 0 -1 T i-g el -900-1 T iO 2 D e g u s s a P 2 5 0 2 4 6 8 10 N o rm a li ze d O G c o n v e rs io n (% /g T i)
Fig. 14. Comparison of Orange G proportion normalized by mass of titanium converted by photocatalysis using different catalysts in 30 min.
Houari, M., Saidi, M., Tabet, D., Pichat, P., Khalaf, H., 2005. The removal of 4-chlorophenol and dichloroacetic acid in water using Ti-, Zr- and Ti/Zr-pilarred bentonites as photocatalyst. Am. J. Applied. Sci. 2, 1136–1140.
Huang, Y.-J., Li, Z., Li, S.-Z., Shi, Z.-L., Yin, L., Hsia, Y.-F., 2007. Mössbauer investigations of palygorskite from Xuyi, China. Nucl. Instrum. Methods Phys. Res. Sect. B 260, 657–662.
Jada, A., Debih, H., Khodja, M., 2006. Montmorillonite surface properties modifications by asphaltenes adsorption. J. Pet. Sci. Eng. 52, 305–316.
Jung, S.-C., Kim, B.-H., Kim, S.-J., Imaishi, N., Cho, Y.-I., 2005. Characterization of TiO2
photocatalyst films deposited by CVD method and its photocatalytic activity. Chem. Vap. Deposition 11, 137–141.
Khalfallah Boudali, L., Ghorbel, A., Tichit, D., Chiche, B., Dutartre, R., Figueras, F., 1994. Synthesis and characterization of titanium-pillared montmorillonites. Microporous Mater. 2, 525–535.
Kim, C.-S., Kwon, I.-M., Moon, B.K., Jeong, J.H., Choi, B.-C., Kim, J.H., Choi, H., Yi, S.S., Yoo, D.-H., Hong, K.-S., Park, J.-H., Lee, H.S., 2007. Synthesis and particle size effect on the phase transformation of nanocrystalline TiO2. Mater. Sci. Eng. C 27, 1343–1346.
Kumar, K.-N.P., 1995. Growth of rutile crystallites during the initial stage of anatase-to-rutile transformation in pure titania and in titania–alumina nanocomposites. Scr. Metall. Mater. 32, 873–877.
Kumar, K.-N.P., Kumar, J., Keizer, K., 1994. Effect of peptization on densification and phase-transformation behavior of sol-gel-derived nanostructured titania. J. Am. Ceram. Soc. 77, 1396–1400.
Lagaly, G., Ogawa, M., Dékány, I., 2006. Clay mineral interactions. In: Bergaya, F., Theng, B.K.G., Lagaly, G. (Eds.), Handbook of Clay Science. Developments in Clay Science, 1. Elsevier, pp. 309–377.
Letaïef, S., Martin-Luengo, M.-A., Aranda, P., Ruiz-Hitzky, E., 2006. A colloidal route for delamination of layered solids: novel porous-clay nanocomposites. Adv. Funct. Mater. 16, 401–409.
Liu, J., Dong, M., Zuo, S., Yu, Y., 2009. Solvothermal preparation of TiO2/montmorillonite
and photocatalytic activity. Appl. Clay Sci. 43, 156–159.
Nagaoka, S., Hamasaki, Y., Ishihara, S.-I., Nagata, M., Iio, K., Nagasawa, C., Ihara, H., 2002. Preparation of carbón/TiO2microsphere composites from cellulose / TiO2
microsphere composites and their evaluation. J. Mol. Catal. A: Chem 177, 255–263.
Nieto-Suárez, M., Palmisano, G., Ferrer, M.L., Concepción Gutiérrez, M., Yurdakal, S., Augugliaro, V., Pagliaro, M., del Monte, F., 2009. Self-assembled titania-silica-sepiolite based nanocomposites for water decontamination. J. Mater. Chem. 19, 2070–2075. Önal, M., Sarıkaya, Y., 2009. Some physicochemical properties of a clay containing
smectite and palygorskite. Appl. Clay Sci. 44, 161–165.
Park, Y., Ayoko, G., Frost, R.L., 2011. Application of organoclays for the adsorption of recalcitrant organic molecules from aqueous media. J. Colloid Interface Sci. 354, 292–305.
Paz, Y., 2006. Preferential photodegradation— why and how? C.R. Chim. 9, 774–787. Reddy, E.P., Davydov, L., Smirniotis, P., 2003. TiO2-loaded zeolites and MCM-41 in the
sonophotocatalytic decomposition of aqueous organic pollutants: the role of the support. Appl. Catal. B. 42, 1–11.
Rhouta, B., Kaddami, H., Elbarqy, J., Amjoud, M., Daoudi, L., Maury, F., Senocq, F., Maazouz, A., Gerard, J.-F., 2008. Elucidating the crystal-chemistry of Jbel Rhassoul stevensite (Morocco) by advanced analytical techniques. Clay Miner. 43, 393–404. Robert, D., Piscopo, A., Heintz, O., Weber, J.V., 1999. Photocatalytic detoxification with TiO2supported on glass fibre by using artificial and natural light. Catal. Today 54,
291–296.
Robertson, P.K.-J., 1996. Semiconductor photocatalysis: an environmentally acceptable alternative production technique and effluent treatment process. J. Cleaner Prod. 4, 203–212.
Ruiz-Hitzky, E., 2001. Molecular access to intracrystalline tunnels of sepiolite. J. Mater. Chem. 11, 86–91.
Sarantopoulos, C., Gleizes, A.N., Maury, F., 2007. Chemical vapor infiltration of photocatalytically active TiO2thin films on glass microfibers. Surf. Coat. Technol.
201, 9354–9358.
Sarantopoulos, C., Puzenat, E., Guillard, C., Herrmann, J.-M., Gleizes, A.N., Maury, F., 2009. Microfibrous TiO2 supported photocatalysts prepared by metal-organic
chemical vapor infiltration for indoor air and waste water purification. Appl. Catal. B. 91, 225–233.
Shariatmadari, H., 1998. Interactions of phosphates and selected organic molecules with palygorskite and sepiolite. PhD thesis, University of Saskatchewan, Canada. 213 pages.
Suárez, M., García-Romero, E., 2006. FTIR spectroscopic study of palygorskite: influence of the composition of the octahedral sheet. Appl. Clay Sci. 31, 154–163. Wang, C.C., Ying, J.Y., 1999. Sol–Gel synthesis and hydrothermal processing of anatase
and rutile titania nanocrystals. Chem. Mater. 11, 3113–3120.
Xu, D., Tan, X.L., Chen, C.L., Wang, X.K., 2008. Adsorption of Pb(II) from aqueous solution to MX-80 bentonite: effect of pH, ionic strength, foreign ions and temperature. Appl. Clay Sci. 41, 37–46.
Zhang, H.Z., Banfield, J.F., 1998. Thermodynamic analysis of phase stability of nanocrys-talline titania. J. Mater. Chem. 8, 2073–2706.
Zhang, H.Z., Banfield, J.F., 2000. Understanding polymorphic phase transformation behavior during growth of nanocrystalline aggregates: insights from TiO2. J. Phys.