Nutrient recovery from bio-digestion waste:
From field experimentation
to model-based optimization
Thèse en cotutelle
Doctorat en génie des eaux
Céline Vaneeckhaute
Université Laval
Québec, Canada
Philosophiae Doctor (Ph.D.)
et
Ghent University
Ghent, Belgium
Doctor
© Céline Vaneeckhaute, 2015
Résumé
La prise de conscience croissante de l’épuisement des ressources naturelles, la demande croissante de nutriments et d’énergie pour la production alimentaire et les normes de plus en plus strictes de décharge des nutriments et de fertilisation, ont donné lieu à une attention accrue pour la récupération des nutriments à partir des déchets municipaux et agricoles. Cette thèse de doctorat vise à stimuler la transition vers une bio-économie en fournissant des (moyens à développer des) stratégies durables pour la récupération des nutriments à partir des déchets organiques après la production de bio-énergie par la digestion anaérobie. Une attention particulière est accordée à la valorisation des produits récupérés comme substituts renouvelables aux engrais chimiques et/ou comme engrais organo-minéraux durables dans l'agriculture. Trois phases de recherche complémentaires ont été exécutées: 1) l'inventaire des technologies et la classification des produits, 2) l'évaluation de la valeur des produits, 3) la modélisation et l’optimisation des procédés.
Dans la première phase, une revue systématique des technologies et une classification des produits ont été réalisées. Dans la seconde phase, la caractérisation des produits et des analyses de bilan de masse dans des stations de récupération des ressources de l’eau et des déchets (StaRRED) à grande échelle ont été exécutées. Une évaluation économique et écologique de différents scénarios de bio-fertilisation a été menée et les scénarios les plus durables ont été sélectionnés pour une évaluation agronomique réalisée ultérieurement sur le terrain et à l'échelle de la serre. Dans la troisième phase, une librairie générique de modèles pour la récupération des nutriments a été élaborée visant à modéliser la quantité et la qualité d'engrais. Une meilleure compréhension de la performance et des interactions des processus unitaires a été obtenue par des analyses de sensibilité globale. Les modèles ont été utilisés avec succès comme un outil pour la configuration et l'optimisation des chaînes de traitement. Sur la base de toutes les connaissances acquises, une feuille de route générique pour la mise en place des stratégies de récupération des nutriments en fonction des marchés et des législations des engrais, et de la caractérisation des déchets a été développée.
En tant que telle, la présente thèse développe les concepts de fermeture maximale des cycles des nutriments dans une approche du berceau-au-berceau. Le travail apporte des preuves importantes de l'impact positif des produits récupérés sur l'économie, l'agronomie et l'écologie de la production végétale intensive. En outre, cette thèse offre des informations et des outils fondamentaux pour faciliter la mise en œuvre et l'optimisation des stratégies durables de récupération des nutriments. Ces résultats ouvrent de nouvelles possibilités pour une croissance économique durable axée sur les ressources biologiques et créent ainsi une situation gagnant-gagnant pour l'environnement, la société et l'économie en Belgique, au Canada, et au-delà.
Summary
The increasing awareness of natural resource depletion, the increasing demand of nutrients and energy for food production, and the more and more stringent nutrient discharge and fertilization levels, have resulted in an increased attention for nutrient recovery from municipal and agricultural wastes. This PhD dissertation aims at stimulating the transition to a bio-based economy by providing (tools to develop) sustainable strategies for nutrient recovery from organic wastes following bio-energy production through anaerobic digestion (= bio-digestion waste). Particular attention is paid to the valorization of the recovered products as renewable substitutes for chemical fertilizers and/or as sustainable organo-mineral fertilizers in agriculture. Three complementary research phases were conducted: 1) technology inventory and product classification, 2) product value evaluation, 3) process modelling and optimization.
In the first phase, a systematic technology review and product classification was performed. In phase 2, product characterizations and mass balance analyses at full-scale waste(water) resource recovery facilities (WRRFs) were executed. An economic and ecological evaluation of different bio-based fertilization scenarios was conducted and the most sustainable scenarios were selected for subsequent agronomic evaluation at field and greenhouse scale. In phase 3, a generic nutrient recovery model library was developed aiming at fertilizer quantity and quality as model outputs. Increased insights in unit process performance and interactions were obtained through global sensitivity analyses. The models were successfully used as a tool for treatment train configuration and optimization. Based on all acquired knowledge, a generic roadmap for setting up nutrient recovery strategies as function of fertilizer markets, legislations, and waste characterization was established.
As such, the present dissertation further develops the concepts of maximally closing nutrient cycles in a cradle-to-cradle approach. The work reveals important evidence of the positive impact of recovered products on the economy, agronomy, and ecology of intensive plant production. Moreover, it provides the fundamental information and tools to facilitate the implementation and optimization of sustainable nutrient recovery strategies. All of this may open up new opportunities for sustainable and more bio-based economic growth and thus create a win-win situation for the environment, the society, and the economy in Belgium, Canada, and beyond.
Samenvatting
Het toenemende bewustzijn omtrent de uitputting van natuurlijke hulpbronnen, de groeiende vraag naar nutriënten en energie voor de voedselproductie en de steeds strengere lozings- en bemestingsnormen voor nutriënten, hebben geresulteerd in een verhoogde aandacht voor nutriëntrecuperatie uit gemeentelijk en landbouwafval. Dit proefschrift beoogt de overgang naar een bio-gebaseerde economie te stimuleren door het verstrekken van (instrumenten voor de ontwikkeling van) duurzame strategieën voor nutriëntrecuperatie uit organisch afval na bio-energie productie via anaerobe vergisting. Bijzondere aandacht wordt besteed aan de valorisatie van de gerecupereerde producten als hernieuwbare kunstmestvervangers en/of als duurzame organo-minerale meststoffen in de landbouw. Drie complementaire onderzoeksfasen werden uitgevoerd: 1) technologie-inventarisatie en product-classificatie, 2) evaluatie van de productwaarde, 3) modellering en procesoptimalisatie.
In de eerste fase werd een systematisch technologisch overzicht gemaakt en werd een product-classificatie opgesteld. In fase 2 werden de producten gekarakteriseerd en werden massabalansen in afval(water)grondstofrecuperatie-installaties (AGRI’s) op volle schaal berekend. Een economische en ecologische evaluatie van verschillende bio-gebaseerde bemestingsscenario’s werd verricht en de meest duurzame scenario's werden geselecteerd voor daarop volgende agronomische evaluatie op het veld en in de serre. In fase 3 werd een generieke modellenbank voor nutriëntrecuperatie ontwikkeld, gericht op het modelleren van meststof-kwantiteit en -kwaliteit. Beter inzicht in de prestaties van de eenheidsprocessen en interacties werd verkregen via globale gevoeligheidsanalyses. De modellen werden met succes gebruikt als instrument voor configuratie en optimalisatie van de behandelingstrein. Op basis van alle verworven kennis werd een generiek stappenplan ontwikkeld voor het opstellen van nutriëntrecuperatie strategieën als functie van meststofmarkten, wetgevingen en de karakterisering van de afvalstroom.
Als zodanig ontwikkelt dit proefschrift verder de concepten van het maximaal sluiten van nutriëntenkringlopen in een cradle-to-cradle benadering. Het werk onthult significant bewijs van de positieve impact van gerecupereerde producten op de economie, agronomie en ecologie van de intensieve gewasproductie. Bovendien biedt het de fundamentele informatie en instrumenten om de implementatie en optimalisatie van duurzame strategieën voor nutriëntrecuperatie te bevorderen. Dit alles kan leiden tot nieuwe kansen voor een duurzame en meer bio-gebaseerde economische groei en kan dus een win-win situatie creëren voor het milieu, de maatschappij en de economie in België, Canada en daarbuiten.
Mots-clés / Keywords / Trefwoorden
Mots-clés: agriculture durable, berceau au berceau, bio-économie, digestion anaérobie, engrais renouvelables, gestion durable des ressources, librairie des modèles de récupération des nutriments, recyclage des nutriments, stratégies agricoles alternatives, traitement du digestat, valorization des déchets organiques.
Keywords: alternative farming strategies, anaerobic digestion, bio-based economy, cradle to cradle, digestate treatment, nutrient recovery model library, nutrient recycling, renewable fertilizers, sustainable agriculture, sustainable resource management, organic waste valorization.
Trefwoorden: alternatieve landbouwstrategieën, anaerobe vergisting, bio-economie, cradle to cradle, digestaatbehandeling, duurzaam beheer van grondstoffen, duurzame landbouw, hernieuwbare meststoffen, modellenbank voor nutriëntrecuperatie, recyclage van nutriënten, valorisatie van organisch afval.
Table of contents
Résumé III Summary V Samenvatting VII Mots-clés / Keywords / Trefwoorden IX Table of contents XI List of tables XIII List of figures XIX List of abbreviations XXV List of symbols XXIX Dedications XXXI Acknowledgements XXXIII Foreword XXXIX
CHAPTER 1: General introduction 1
CHAPTER 2:
Nutrient recovery from bio-digestion waste: Systematic technology review and product
classification 19
CHAPTER 3:
Fate of macronutrients in water treatment of digestate using vibrating reversed osmosis 57 CHAPTER 4:
Ecological and economic benefits of the application of bio-based (organo-)mineral fertilizers in
modern agriculture 77
CHAPTER 5:
Assessing nutrient use efficiency and environmental pressure of macronutrients in bio-based
fertilizers: A review of two-year field trial results 103
CHAPTER 6:
Phosphorus use efficiency in bio-based fertilizers: A bio-availability and fractionation study 149 CHAPTER 7:
Comparative evaluation of pre-treatment methods to enhance phosphorus release from
digestate 175
CHAPTER 8:
Modelling and optimization of nutrient recovery systems: Advances and limitations 195 CHAPTER 9:
Development, implementation, and validation of a generic nutrient recovery model (NRM)
library 213
CHAPTER 10:
Global sensitivity analysis of nutrient recovery models (NRM): Factor prioritization, treatment
train configuration and optimization 257
CHAPTER 11:
CHAPTER 12:
Life cycle assessment of digestate processing and nutrient recovery strategies: Summary and
perspectives 323
CHAPTER 13:
General conclusions and recommendations 329
REFERENCES 345
APPENDIX 379
List of tables
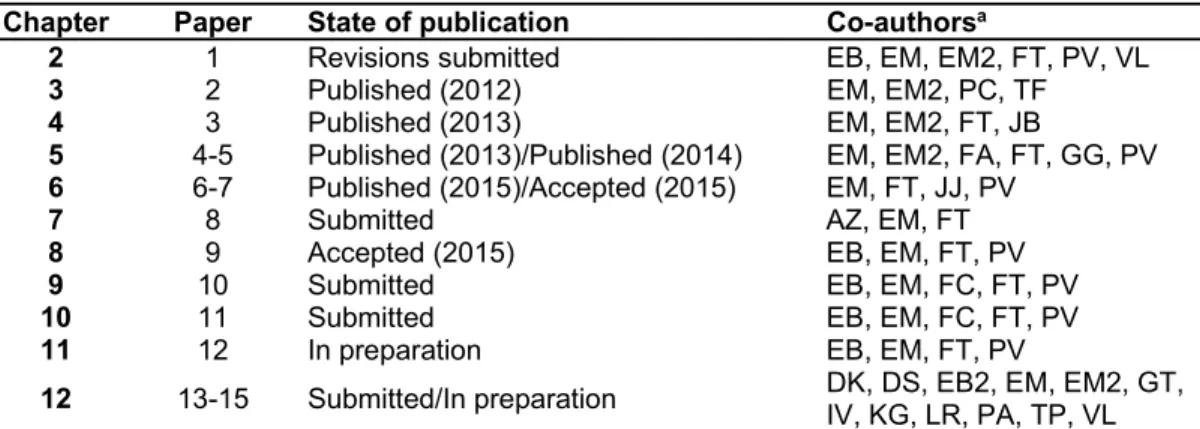
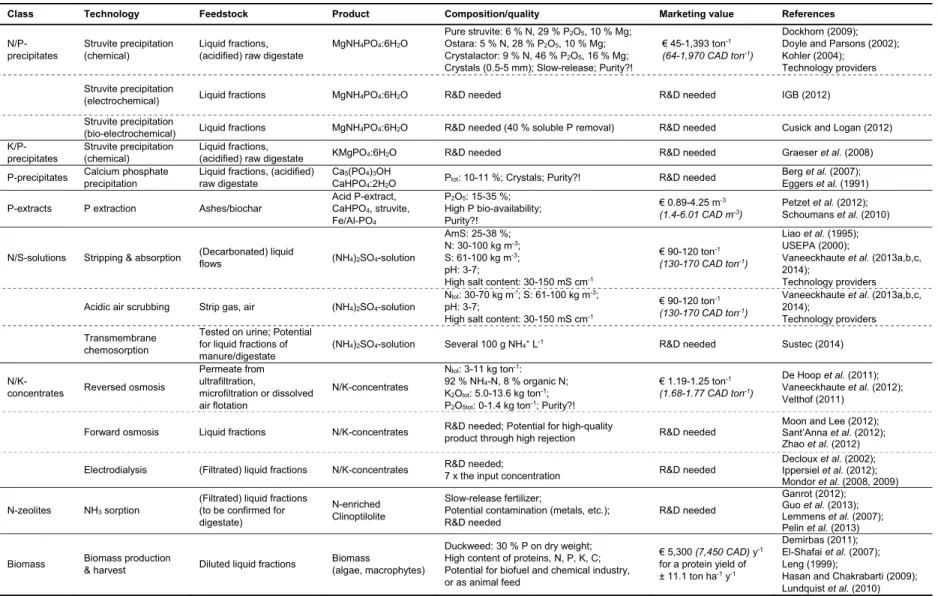
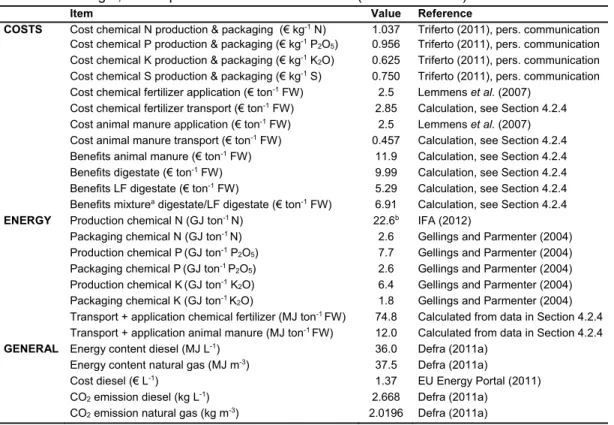
Table 1.1 Overview of peer-reviewed papers per chapter, state of publication, and co-authors. Note: other publications (national papers, scientific reports, proceedings, etc.) are given at the end of this dissertation. ... 12 Table 2.1 Composition (10th percentile, median, 90th percentile; No. of observations: 213) of unprocessed digestate (VLACO, 2012). w% = % on fresh weight... 23 Table 2.2 Technology overview: technology, mechanism, feed, % recovery, main technical bottlenecks, economic and ecological evaluation, stage of development, and references. ↑ = relatively high; ↓ = relatively low; CAPEX = capital expenditures; OPEX = operational expenditures; PE = person equivalent; RO = reversed osmosis; R&D = research and development. Note: in order to reduce table complexity, costs are only expressed in € (€ 1 ≈ 1.415 CAD; November 2014). ... 40 Table 2.3 Desirable physical characteristics of solid fertilizers: parameter, process affected, impact, and typical values; compiled from Barnes and Fortune (2006), Dambolav et al. (1999), Fittmar (2009), Haby et al. (2003), McCauley et al. (2009), and Sahoy (2013). ... 44 Table 2.4 Classification of recovered end products: class, technology, feedstock, product, composition/quality, current marketing value, and references. ... 46 Table 3.1 Concentrations (g kg-1 FW) of N, P, K, Na, Ca, Mg, dry weight (DW, %), density (g L -1), electrical conductivity (EC, mS cm-1), salt content (g kg-1 FW), total hardness (D°H), and chemical oxygen demand (COD, mg L-1) in the characterized process flows (mean ± standard deviation; n = 4). Numbers 1-11 correspond with the sample locations in Figure 3.1. FW = fresh weight; LF = liquid fraction; TF = thick fraction. ... 67 Table 3.2 Economic value (€ ton-1 FW; CAD ton-1 FW ) of chemical fertilizers/soil conditioners (Brenntag NV, 2011). FW = fresh weight. € 1 ≈ 1.415 CAD (November 2014). ... 74 Table 4.1 Nitrogen (N) and potassium (K2O) dose (kg ha-1 y-1) per product used in the 21 scenarios (Sc) for reuse of digestate derivatives as renewable fertilizers in agriculture. Crop = maize; Soil = non-sandy. Sc 0: common practice; Sc 1-21: reuse of digestate derivatives as renewable fertilizers. Total P2O5 dose in all scenarios = 80 kg ha-1 y-1. CF = chemical fertilizer; LF = liquid fraction. ... 85 Table 4.2 Data used for the economic and ecological analysis of the 21 cultivation scenarios. FW = fresh weight; LF = liquid fraction. € 1 ≈ 1.415 CAD (November 2014). ... 87 Table 4.3 Physicochemical characterization of pig slurry, digestate, thick (TF) and liquid (LF) fraction of digestate after separation, TF of digestate after separation and drying, and a mixture of digestate (volume fraction, φ = 0.5) and LF digestate (φ = 0.5) (mean ± standard deviation; No of sampling sites = 3 for digestate derivatives, 1 for pig slurry; No. of sampling moments in time = 3 for digestate derivatives, 2 for pig slurry; No of replications per sample = 2). DW = dry weight; EC = electrical conductivity; FW = fresh weight; OC = organic carbon. ... 89 Table 4.4 Physicochemical characterization of concentrates produced by one vibrating membrane (RO) filtration step of the liquid fraction of digestate and concentrates following two subsequent membrane filtration steps (mean ± standard deviation; No. of sampling sites = 3; No. of sampling moments in time = 3; No. of replications per sample = 2). DW = dry weight; EC = electrical conductivity; FW = fresh weight; OC = organic carbon; RO = reversed osmosis. ... 90 Table 4.5 Physicochemical characterization of acidic and alkaline air scrubber water (mean ± standard deviation; No. of sampling sites = 2; No. of sampling moments in time = 3; No. of replications per sample = 2). EC = electrical conductivity; FW = fresh weight. ... 91 Table 4.6 Economic analysis (€ ha-1 y-1) of the 21 cultivation scenarios. Sc 0: common practice; Sc 1-21: reuse of digestate derivatives as renewable fertilizers. AM = animal manure; CF = chemical fertilizer; DD = digestate derivatives. € 1 ≈ 1.415 CAD (November 2014). ... 92 Table 4.7 Ecological analysis (energy use, GJ ha-1 y-1) of the 21 cultivation scenarios. Sc 0: common practice; Sc 1-21: reuse of digestate derivatives as renewable fertilizers. AM = animal manure; CF = chemical fertilizer; DD = digestate derivatives. ... 93
Table 5.1 Soil characteristics before fertilization (April 21 2011): parameter, soil layer, analysis, target zone, limit, and evaluation. Extractable amounts were determined using ammonium lactate/acetic acid (pH 3.75) as an extraction agent. DW = dry weight; OC = organic carbon. 108 Table 5.2 Eight different fertilization scenarios (Sc) expressed as effective nitrogen (N; kg ha-1 y -1), additional application of chemical potash (K2O; kg ha-1 y-1), and equivalent dosage of phosphate (P2O5; kg ha-1 y-1). Values represent the intended dosage (based on preliminary product characterizations). Values between brackets represent the actual dosage (based on product characterizations at the moment of fertilizer application). ... 110 Table 5.3 Physicochemical product characterization per year (mean ± standard deviation; n = 2). DW = dry weight; EC = electrical conductivity; FW = fresh weight; N/A = not applicable; OC = organic carbon. ... 112 Table 5.4 Weather conditions in West Flanders (Belgium) in 2011 and 2012, and degree of abnormality by means of the statistical characteristic (SC) based on the reference period 1833-2010 (RMI, 2014). ... 113 Table 5.5 Biogas potential of the harvested energy maize for the eight different fertilization scenarios (mean ± standard deviation; n = 4). DW = dry weight; FW = fresh weight. ... 123 Table 5.6 Plant nutrient uptake (N, P2O5, K2O, S, Ca, Mg, Na; kg ha-1) in time for the eight different fertilization scenarios (mean ± standard deviation; n = 4). p-values and small letters refer to statistical analyses using one-way ANOVA and post-hoc pair-wise comparisons. * = significant difference at the 5 % level. ... 126 Table 5.7 Nutrient balances (N, P2O5, K2O; kg ha-1 y-1) for Scenarios 1, 2, and 3 simulated with the NDICEA software tool based on the two-year field trial results. Crop type: energy maize. Initial soil characteristics: Table 5.1. N-3: simulation over 3 years (= one repetition of the year cycle; see Section 5.2.5); N-30: simulation over 30 years (= ten repetitions of the three-year cycle). ... 128 Table 5.8 Calculated nitrogen balance (kg ha-1), apparent recovery (%), and nitrogen use efficiency (NUE, %) in 2011 and 2012 for the eight different fertilization scenarios (Sc). Soil layer: 0-30 cm. Average values are marked in bold. ... 129 Table 5.9 Extractable soil nutrient amounts through ammonium lactate/acetic acid (pH 3.75) extraction (P2O5, K2O, Ca, Mg, Na; kg or ton ha-1) in time for the eight different fertilization scenarios (mean ± standard deviation; n = 4). Soil layer: 0-30 cm. p-values and small letters refer to statistical analyses using one-way ANOVA and post-hoc pair-wise comparisons. * = significant difference at the 5 % level. ... 132 Table 5.10 Phosphorus balance (kg P2O5 ha-1), apparent recovery (%), and phosphorus use efficiency (PUE, %) in 2011 and 2012 for the eight different fertilization scenarios (Sc). Soil layer: 0-30 cm. Average values are marked in bold. Available amounts were determined using ammonium lactate/acetic acid (pH 3.75) as an extraction agent. ... 133 Table 5.11 Potassium balance (kg K2O ha-1), apparent recovery (%), and potassium use efficiency (KUE, %) in 2011 and 2012 for the eight different fertilization scenarios (Sc). Soil layer: 0-30 cm. Average values are marked in bold. Available amounts were determined using ammonium lactate/acetic acid (pH 3.75) as an extraction agent. ... 136 Table 5.12 Sulfur balance (kg S ha-1), apparent recovery (%), and sulfur use efficiency (SUE, %) in 2011 and 2012 for the eight different fertilization scenarios (Sc). Soil layer: 0-30 cm. Average values are marked in bold. Available amounts were determined using ammonium lactate/acetic acid (pH 3.75) as an extraction agent. ... 137 Table 5.13 Calcium balance (ton ha-1, kg ha-1), apparent recovery (%), and calcium use efficiency (CaUE, %) in 2011 and 2012 for the eight different fertilization scenarios (Sc). Soil layer: 0-30 cm. Average values are marked in bold. Available amounts were determined using ammonium lactate/acetic acid (pH 3.75) as an extraction agent. ... 139 Table 5.14 Magnesium balance (kg ha-1), apparent recovery (%), and magnesium use efficiency (MgUE, %) in 2011 and 2012 for the eight different fertilization scenarios (Sc). Soil layer: 0-30 cm. Average values are marked in bold. Available amounts were determined using ammonium lactate/acetic acid (pH 3.75) as an extraction agent. ... 140
Table 6.1 Product physicochemical characterization (mean ± standard deviation; n = 2). DW = dry weight; EC = electrical conductivity; OC = organic carbon; TSP = triple superphosphate. 157 Table 6.2 Product (ton DW ha-1) and macronutrient (total N, effective N, total P, K2O, Ca, Mg, and OC; kg ha-1) dosage to soil by bio-based fertilizer application (standardized to 80 kg P2O5 ha-1). Differences in N, K, Ca, and Mg application were corrected by adding the appropriate amount of a 1 M NH4NO3, K2SO4, CaSO4:2H2O, and/or MgSO4:7H2O solution. DW = dry weight; OC = organic carbon; TSP = triple superphosphate. ... 158 Table 6.3 Phosphorus (P) fractionation: total P, P soluble in water, neutral ammonium citrate (NAC), and mineral acid (MA) (g kg-1 DW; mean ± standard deviation; n = 2). DW = dry weight; TSP = triple superphosphate. ... 160 Table 6.4 Biomass yield (g FW/DW container-1 or kg-1 soil), dry weight content (%), and phosphorus uptake (mg P kg-1 soil) at the harvest (mean ± standard deviation; n = 4), as well as average phosphorus use efficiencies (PUE) based on the plant reaction for the different treatments on P-rich sand and Rheinsand. p-values and small letters refer to statistical analyses using one-way ANOVA and post-hoc pair-wise comparisons (α = 0.05). DW = dry weight; FW = fresh weight; TSP = triple superphosphate. ... 162 Table 6.5 Average phosphorus use efficiency (PUE; %) over time based on soil analyses (PAE, Pw, PAl, Prhizon) on sand and on Rheinsand (if detectable) for the different bio-based fertilizers relative to the reference triple superphosphate (TSP; PUE = 100 %). PUE(control) = 0 %. .... 165 Table 7.1 Physicochemical characteristics of the digestate used for the various pre-treatments (mean ± standard deviation; n = 2). DW = dry weight; EC = electrical conductivity; OC = organic carbon. ... 180 Table 7.2 Acid dose (mol L-1 digestate), estimated acid cost (€ m-3 digestate), and additional ortho-P released from digestate under the various pre-treatments (g m-3 digestate) relative to the P released without pre-treatment (487 g m-3). Acid prices: HCl: € 0.0014 mol-1, citric acid: € 0.13 mol-1, formic acid: € 0.02 mol-1 (Brenntag NV, 2012). € 1 ≈ 1.415 CAD (November 2014). ... 188 Table 8.1 Recommended model outputs for each unit process. AD = anaerobic digestion; Prec = precipitation/crystallization; Strip = stripping; Scrub = scrubbing... 209 Table 8.2 Factors that potentially influence the model outputs per unit process and reference for corresponding equations. AD = anaerobic digestion; Prec = precipitation/crystallization; Strip = stripping; Scrub = scrubbing. ... 209 Table 9.1 Key units and ancillary units included in the nutrient recovery model (NRM) library. ... 220 Table 9.2 Dissolved physicochemical components selected for each key unit in the nutrient recovery model (NRM) library. AD = anaerobic digestion; Prec = precipitation/crystallization; Strip = stripping; Scrub = scrubbing. Component names are given by their valence state. ... 224 Table 9.3 Extensions made to the generic PHREEQC (P; Phreeqc.dat) and/or MINTEQ (M; minteq.v4.dat) database files, and the reference for thermodynamic data. DOM = dissolved organic matter. ... 225 Table 9.4 Number of selected species and reactions for each key unit in the nutrient recovery model (NRM) library resulting from speciation calculations using PHREEQC (and Visual MINTEQ as control) modelling software. AD = anaerobic digestion; Prec = precipitation/ crystallization; Strip = stripping; Scrub = scrubbing. ... 228 Table 9.5 Simulation times (s) and improvement (%) using the reduced PHREEQC database as compared to the full Phreeqc.dat (P) / minteq.v4.dat (M) databases for simulation of the chemical speciation scripts developed for each key unit in the nutrient recovery model (NRM) library. AD = anaerobic digestion; Prec = precipitation/crystallization; Strip = stripping; Scrub = scrubbing. ... 238
Table 9.6 Reactor design, default specifications and features for each unit in the nutrient recovery model (NRM) library. AD = anaerobic digestion; AmS = ammonium sulfate; Chem = chemical dosing; CSTR = continuously stirred tank reactor; Heat = heater; TSS = total suspended solids; P = precipitates; Prec = precipitation/crystallization; Scrub = scrubber; Settle = settler; Store = storage tank; Strip = stripper; WRRF = water resource recovery facility; X = biological particulate solids. ... 237 Table 9.7 Verification PHREEQC-Tornado interface: example NRM-Scrub. Left: gas phase speciation (atm). Right: ammonium sulfate fertilizer speciation (mol m-3) after gas-liquid exchange. log(p) = logarithm of the partial pressure (p) in the gas phase. ... 244 Table 9.8 NRM-AD validation based on experimental results from Holmen Paper, Madrid, Spain at steady state and comparison with the Lizarralde et al. (2010) model for anaerobic S removal. ND = not determined. ... 245 Table 9.9 NRM-Prec validation based on experimental batch tests at lab-scale at steady state (after 12h). ... 247 Table 9.10 NRM-Strip/NRM-Scrub validation based on experimental literature results (Collivignarelli et al., 1998) at different operating conditions at steady state (after 6h). ... 251 Table 9.11 Validation treatment train (NRM-Chem, NRM-Strip, NRM-Scrub) based on technical inquiry provided by company X. ... 252 Table 10.1 Design parameters for each key unit process in the nutrient recovery model (NRM) library. AD = anaerobic digestion; Prec = precipitation/crystallization; Strip = stripper; Scrub = scrubber. ... 263 Table 10.2 Performance indicators (+ symbol and unit) used as objective functions in global sensitivity analysis for each key unit in the nutrient recovery model (NRM) library. AD = anaerobic digestion; Prec = precipitation/crystallization; Strip = stripper; Scrub = scrubber. ... 264 Table 10.3 Scenarios for sensitivity analysis: varying factors (= uniform distribution) and fixed factors (= default value) considered for each key unit in the nutrient recovery model (NRM) library. AD = anaerobic digestion; L-G = liquid-gas; L-S = liquid-solid; Prec = precipitation/ crystallization; Scrub = scrubber; SRB = sulfate reducing bacteria; Strip = stripper. ... 265 Table 10.4 Symbol, description, variation range, default value, and unit for each model factor used in the global sensitivity analysis scenarios for the NRM-AD (anaerobic digestion) key unit. Range A: all applications; Range B: manure (Cesur and Albertson, 2005); Range C: sludge (Astals et al., 2013). L-S = liquid-solid; L-G = liquid-gas. ... 267 Table 10.5 Symbol, description, variation range, default value, and unit for each model factor used in the global sensitivity analysis scenarios for the NRM-Prec (precipitation/crystallization) key unit. Range A: all applications; Range B: digestate from manure (Cesur and Albertson, 2005); Range C: (co-)digestate (Vlaco, 2012). L-S = liquid-solid; L-G = liquid-gas. ... 269 Table 10.6 Symbol, description, variation range, default value, and unit for each model factor used in the global sensitivity analysis scenarios for the NRM-Strip (stripper) key unit. Range A: all applications; Range B: digestate from manure (Cesur and Albertson, 2005); Range C: (co-)digestate (Vlaco, 2012). L-S = liquid-solid; L-G = liquid-gas. ... 270 Table 10.7 Symbol, description, variation range, default value, and unit for each model factor used in the global sensitivity analysis scenarios for the NRM-Scrub (acidic air scrubber) key unit. L-S = liquid-solid; L-G = liquid-gas. ... 271 Table 10.8 Class, cut-off treshold (CFT), description, and level of importance used for factor ranking. SRC = standardized regression coefficient; tSRC = t-statistic of the SRC; n-p = degrees of freedom; n = number of samples; p = number of factors. ... 273 Table 10.9 Lower and upper limit and initial value used for each factor in the treatment train optimization experiment. For factor descriptions, see Tables 10.4-10.7. For model descriptions, see Section 10.2.1. AD = anaerobic digestion; Prec = precipitation/crystallization; Strip = stripper; Scrub = scrubber. f_ns_P = fraction of non-settleable precipitates; f_ns_X = fraction of non-settleable biological particulate solids. ... 274 Table 10.10 Parameters used to calculate energy and cost functions in the virtual optimization experiment. $ = USD; 1 USD = 1.14 CAD = € 0.80 (November 2014). ... 276
Table 10.11 Global sensitivity analyses for the NRM-AD unit: ten prioritized factors with standardized regression coefficient (SRC) per performance indicator for each scenario. Scenario A: all applications; Scenario B: manure (Cesur and Albertson, 2005); Scenario C: sludge (Astals et al., 2013). Dark grey = very high importance (CFT1); grey = high importance (CFT2); light grey = moderate importance (CFT3). CFT = cut-off threshold. * indicates R2adj value below 0.7. Description of factor symbols can be found in Table 10.4. ... 277 Table 10.12 Global sensitivity analyses for the NRM-Prec unit: ten prioritized factors and standardized regression coefficient (SRC) per performance indicator for each scenario. Scenario A: all applications; Scenario B: digestate from manure (Cesur and Albertson, 2005); Scenario C: (co-)digestate (Vlaco, 2012). Dark grey = very high importance (CFT1); grey = high importance (CFT2); light grey = moderate importance (CFT3). CFT = cut-off threshold. * indicates R2adj value below 0.7. Description of factor symbols can be found in Table 10.5. .... 283 Table 10.13 Global sensitivity analyses for the NRM-Strip unit: ten prioritized factors and standardized regression coefficient (SRC) per performance indicator for each scenario. Scenario A: all applications; Scenario B: digestate from manure (Cesur and Albertson, 2005); Scenario C: (co-)digestate (Vlaco, 2012). Dark grey = very high importance (CFT1); grey = high importance (CFT2); light grey = moderate importance (CFT3). CFT = cut-off threshold. * indicates R2adj value below 0.7. Description of factor symbols can be found in Table 10.6. .. 286 Table 10.14 Global sensitivity analyses for the NRM-Scrub unit: ten prioritized factors and standardized regression coefficient (SRC) per performance indicator. Dark grey = very high importance (CFT1); grey = high importance (CFT2); light grey = moderate importance (CFT3); salmon = low importance. CFT = cut-off threshold. * indicates R2adj value below 0.7. Description of factor symbols can be found in Table 10.7. ... 288 Table 10.15 Generic recommendations in terms of 1) input characterization at resource recovery facilities, 2) operational factors that should be prioritized for process optimization and control, and 3) kinetic model parameters that most urgently require calibration, for each key unit in the nutrient recovery model (NRM) library based on cut-off treshold 1 (CFT1 = very high importance). AD = anaerobic digestion; Prec = precipitation/crystallization; Strip = stripper; Scrub = scrubber. ... 289 Table 10.16 Prioritized factors for the net operational cost of the nutrient recovery treatment train (Fig. 11.7), including operational factors and kinetics. Grey = high importance (CFT2); light grey = moderate importance (CFT3); salmon = low importance (CFT 4). CFT = cut-off threshold. ... 292 Table 10.17 Value of the optimized factors in the treatment train optimization experiment and value of the resulting performance indicators. Red = impact on costs. Green = impact on revenues. COD = chemical oxygen demand; f_ns_P = fraction of non-settleable precipitates; f_ns_X = fraction of non-settleable biological particulate solids. ... 295 Table 10.18 Costs and revenues (1,000 $ y-1) for the optimized nutrient recovery treatment train. $ = USD; 1 USD = 1.14 CAD = € 0.80 (November 2014). AD = anaerobic digester; CHP = conventional heat and power system; CAPEX = capital expenditures; OPEX = operational expenditures. ... 298
List of figures
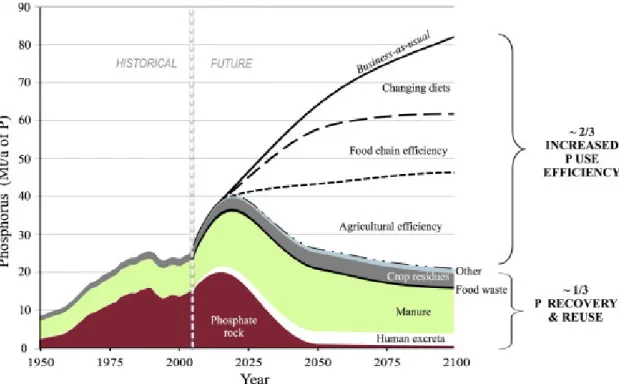
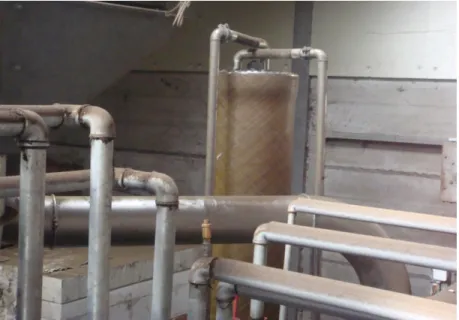
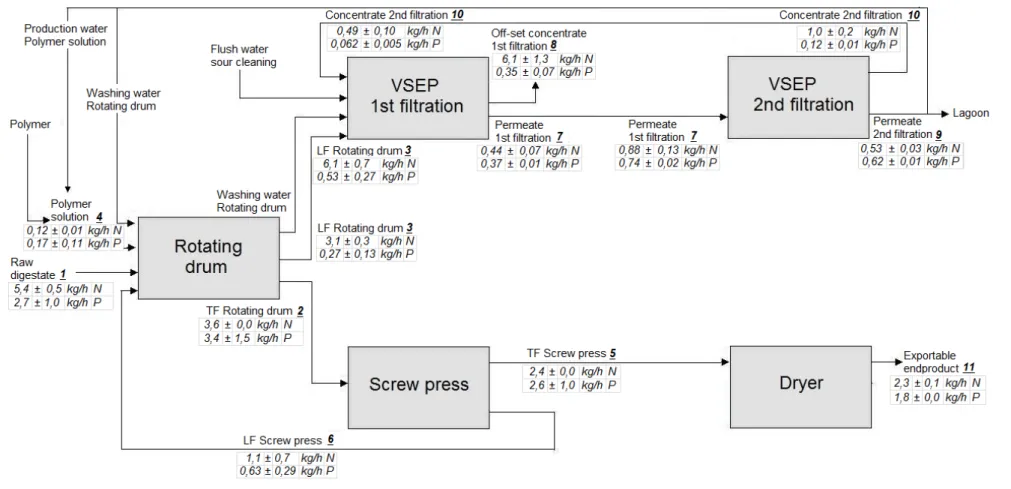
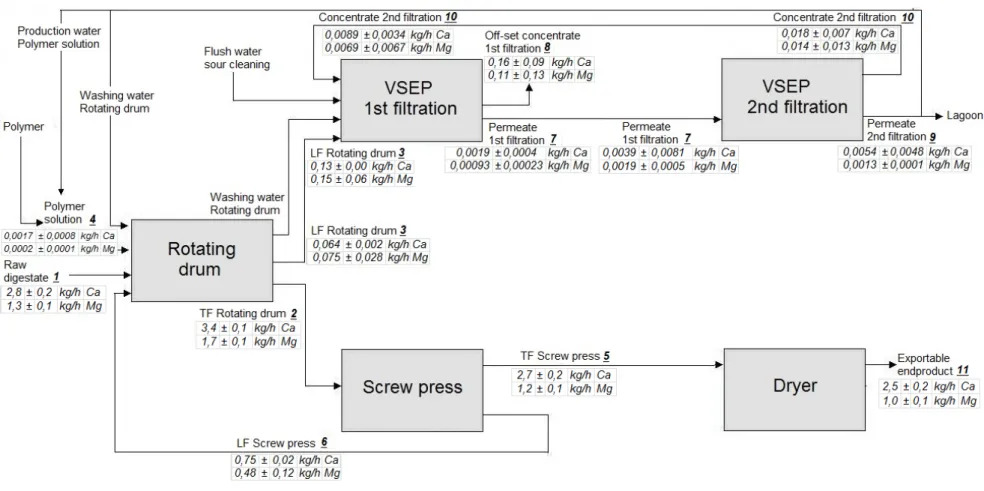
Figure 1.1 A sustainable scenario for meeting long-term future phosphorus demand (million ton y-1) through increased phosphorus use efficiency and recovery (Cordell and White, 2011). . 3 Figure 1.2 Cross-sectorial approach to sustainable resource management. Red arrows: current non-sustainable approach. Green arrows: targeted sustainable approach. Note that energy and nutrient recovery are often integrated in the water recovery facility. ... 8 Figure 1.3 Cross-sectorial transition from nutrient removal to recovery. Red arrows: non-sustainable nutrient flows that should be minimized.Green arrows: targeted non-sustainable closed nutrient cycle. ... 8 Figure 1.4 ‘The Nutrient Nexus’: nutrient cycles represent a key nexus point between global economic, social, and environmental challenges; improving full-chain Nutrient Use Efficiency becomes the shared key to delivering multiple benefits (Sutton et al., 2013). ... 9 Figure 1.5 Schema indicating the originality of the PhD dissertation. Boxes refer to current available research studies. Arrows indicate the focus of this PhD. ... 10 Figure 1.6 Overview of the PhD research strategy and interrelationships. Phase I: technology inventory and product classification; Phase II: product value evaluation; Phase III: process modelling and optimization. Blocks correspond to the objectives defined in Section 1.2.1. ... 12 Figure 2.1 Three-step framework for nutrient recovery as concentrated fertilizer products. ... 25 Figure 2.2 Schematic overview of digestate processing technologies. Shaded boxes: nutrient recovery technology (NRT). ... 26 Figure 3.1 Schematic representation of the digestate treatment process. Numbers 1-11 mark the sample locations. The volumetric flow rates of streams 3, 7, and 10 change during the process. LF = liquid fraction; TF = thick fraction; VSEP = vibratory shear enhanced processing. ... 63 Figure 3.2 Pilot installation of the vibratory shear enhanced processing (VSEP) technology at Goemaere Eneco Energy, Diksmuide, Belgium. Picture: Vaneeckhaute C. ... 62 Figure 3.3 Lagoon for final effluent treatment at Goemaere Eneco Energy, Diksmuide, Belgium. Pictures: Vaneeckhaute C. ... 64 Figure 3.4 Mass balance for nitrogen (N) and phosphorus (P) in kg h-1. The volumetric flow rates of streams 3, 7, and 10 change during the process. LF = liquid fraction; TF = thick fraction; VSEP = vibratory shear enhanced processing. ... 68 Figure 3.5 Mass balance for K and Na in kg h-1. The volumetric flow rates of streams 3, 7, and 10 change during the process. LF = liquid fraction; TF = thick fraction; VSEP = vibratory shear enhanced processing. ... 69 Figure 3.6 Mass balance for Ca and Mg in kg h-1.The volumetric flow rates of streams 3, 7, and 10 change during the process. LF = liquid fraction; TF = thick fraction; VSEP = vibratory shear enhanced processing. ... 70 Figure 4.1 Visualization of the cradle-to-cradle concept: biomass waste (manure, organic biological waste, energy crops) is turned into secondary resources (renewable energy and green or renewable fertilizers). ... 81 Figure 4.2 Greenhouse gas (GHG) emissions from energy use expressed in terms of CO 2-equivalents (kg ha-1 y-1) for the 21 cultivation scenarios. Sc 0: common practice; Sc 1-21: reuse of digestate derivatives as renewable fertilizers. Red dashed lines indicate groups of comparable scenarios (see Table 4.1). ... 94 Figure 4.3 Economic analysis (€ ha-1) of the 21 cultivation scenarios supposing no revenues from manure, digestate, and liquid fraction of digestate acceptance. Sc 0: common practice; Sc 1-21: reuse of digestate derivatives as renewable fertilizers. € 1 ≈ 1.415 CAD (November 2014). Red dashed lines indicate groups of comparable scenarios (see Table 4.1). ... 100 Figure 5.1 Division of the field into 32 subplots. The first number indicates the repetition (1-4). The last number indicates the fertilization scenario (1-8). ... 108
Figure 5.2 Fertilizer application by means of pc-controlled injection (Bocotrans, Tielt, Belgium). Picture: Vaneeckhaute C. ... 114 Figure 5.3 Determination of fresh weight biomass yield at the field. Balance: Kubota KA-10-60A, Robbe Bascules NV, Torhout, Belgium. Picture: Vaneeckhaute C. ... 115 Figure 5.4 Biogas batch test at Innolab, Kortrijk, Belgium. A: sludge flasks; B: gas catch columns. Pictures: Willems B. ... 120 Figure 5.5 Fresh weight (FW) biomass yield (ton ha-1) as a function of time for the eight different fertilization scenarios (mean, error bars: +/- 1 standard deviation; n = 4). p-values and small letters refer to statistical analyses using one-way ANOVA and post-hoc pair-wise comparisons. * = significant difference at the 5 % level. ... 121 Figure 5.6 Dry weight (DW) content (%) as a function of time for the eight different fertilization scenarios (mean, error bars: +/- 1 standard deviation; n = 4). p-values and small letters refer to statistical analyses using one-way ANOVA and post-hoc pair-wise comparisons. * = significant difference at the 5 % level. ND = not determined. ... 122 Figure 5.7 Soil NO3-N residue (kg ha-1) as a function of time for the eight different fertilization scenarios in the 0-90 cm soil layer (mean, error bars: +/- 1 standard deviation; n = 4). Red non-dashed line indicates the Flemish environmental standard of 90 kg NO3-N ha-1 between October 1 and November 15. p-values and small letters refer to statistical analyses using one-way ANOVA and post-hoc pair-wise comparisons. * = significant difference at the 5 % level. ... 124 Figure 5.8 Nitrogen use efficiency (NUE, %) as a function of time for the eight different fertilization scenarios (mean, error bars: +/- 1 standard deviation; n = 4). p-values and small letters refer to statistical analyses using one-way ANOVA and post-hoc pair-wise comparisons. * = significant difference at the 5 % level. ... 125 Figure 5.9 Model simulations for Scenario 1 and 3 using the NDICEA software tool over 3 years (A; one repetition of the three-year cycle; see Section 5.2.5) and 30 years (B; ten repetitions of the three-year cycle). 1: evolution of mineral N in topsoil and subsoil (kg ha-1); 2: cumulative leaching and denitrification in subsoil (kg ha-1); 3: cumulative N availability/uptake (kg ha-1); 4: cumulative denitrification in topsoil (kg ha-1). ... 127 Figure 5.10 Phosphorus use efficiency (PUE, %) as a function of time for the eight different fertilization scenarios (mean, error bars: +/- 1 standard deviation; n = 4). p-values and small letters refer to statistical analyses using one-way ANOVA and post-hoc pair-wise comparisons. * = significant difference at the 5 % level. ... 130 Figure 5.11 Potassium use efficiency (KUE, %) as a function of time for the eight different fertilization scenarios (mean, error bars: +/- 1 standard deviation; n = 4). p-values and small letters refer to statistical analyses using one-way ANOVA and post-hoc pair-wise comparisons. * = significant difference at the 5 % level. ... 134 Figure 5.12 pH(H2O) (A) and pH(KCl) (B) as a function of time for the eight different fertilization scenarios (mean, error bars: +/- 1 standard deviation; n = 4). p-values and small letters refer to statistical analyses using one-way ANOVA and post-hoc pair-wise comparisons. * = significant difference at the 5 % level. ... 141 Figure 5.13 Net economic benefits (€ ha-1; A) and costs (€ ha-1; B) for the crop farmer for the eight different fertilization scenarios. Costs: situation where no revenues are obtained for (excessive) animal manure, digestate, and LF digestate acceptance. € 1 ≈ 1.415 CAD (November 2014). ... 143 Figure 5.14 Energy use (GJ ha-1; A) and associated greenhouse gas (GHG) emission expressed as CO2-equivalents (kg ha-1; B) for the eight different fertilization scenarios. ... 143 Figure 6.1 P-cycle in the soil-plant system with indication of bio-availability indices. PAl = P extractable with ammonium lactate; Prhizon = P extractable with rhizon soil moisture samplers; P-PAE = plant available elements (= P extractable with CaCl2); Pw = P extractable with water. ... 154
Figure 6.2 Overview of the experimental set-up: phosphorus (P) fractionation and pot (= greenhouse) experiment. PAE = plant available elements (= P extractable with CaCl2); PAl = P extractable with ammonium lactate; Prhizon = P extractable with rhizon soil moisture samplers; PUE = phosphorus use efficiency; Pw = P extractable with water; TSP = triple superphosphate. ... 155 Figure 6.3 Plant length (cm) as a function of time (d) for the different treatments on sand (A) and on Rheinsand (B) (mean, error bars: +/- 1 standard deviation; n = 4). p-values refer to statistical analyses using one-way ANOVA. When a significant difference was observed (p < 0.05), post-hoc pair-wise comparisons were added using small letters... 161 Figure 6.4 P-PAE (A; mg P kg-1 soil), Pw (B; mg P2O5 L-1 soil), PAl on sand (C; mg P2O5 100 g-1 soil), and PAl on Rheinsand (D; mg P2O5 100 g-1 soil) as a function of time (wk) after sowing for the different treatments (mean, error bars: +/- 1 standard deviation; n = 4). p-values and small letters refer to statistical analyses using one-way ANOVA and post-hoc pair-wise comparisons (α = 0.05). ... 163 Figure 6.5 pH and P2O5 concentration (mg L-1) in the soil solution (Prhizon) as a function of time (wk) after sowing on sand (A, C) and on Rheinsand (B, D) (mean, error bars: +/- 1 standard deviation; n = 4). p-values and small letters refer to statistical analyses using one-way ANOVA and post-hoc pair-wise comparisons (α = 0.05). Detection limit: 0.05 mg L-1. ... 165 Figure 6.6 Average phosphorus use efficiency (PUE; %) as a function of time (wk) after sowing for the different treatments relative to the reference triple superphosphate (TSP; PUE = 100 %), based on P-PAE (A), Pw (B), PAl sand (C), PAl Rheinsand (D), Prhizon sand (E), and Prhizon Rheinsand (F). PUE(control) = 0 %. ... 166 Figure 7.1 Overview of the experimental set-up for pre-treatment (acidification + mechanical treatment) of digestate to improve the P release efficiency in the liquid fraction after solid-liquid separation. ... 180 Figure 7.2 Amount of acid (citric acid, formic acid, HCl) used (mol acid L-1 digestate) to reach the required pH (4, 5, or 6) for the pre-treatment. Initial pH (5 g digestate + 30 mL milli-Q water) = 8.3. ... 183 Figure 7.3 Concentration of orthophosphate released from digestate (mg P L-1 digestate; mean standard deviation; n = 3) after pre-treatment at pH 4, 5, and 6 as function of the chemical (citric acid, formic acid, HCl) and mechanical treatment used: A = microwave heating, B = conventional heating, C = orbital shaking, and D = ultrasonic bath. Control = no acidification. Note: initial ortho-P concentration without pre-treatment = 48±7 mg L-1. ... 184 Figure 7.4 Maximum concentration of orthophosphate (mg P L-1 digestate; mean standard deviation; n = 3) released from digestate as function of the chemical and mechanical pre-treatments used. All results are the maximum concentrations at pH 4, except for citric acid: maximum concentration at pH 5 for microwave and conventional heating. Note: initial ortho-P concentration without pre-treatment = 48±7 mg L-1. ... 185 Figure 7.5 Maximum orthophosphate release efficiency (%) from digestate by the pre-treatments at the respective pH (mean standard deviation; n = 3). All results are calculated based on the maximum P release at pH 4, except for citric acid: maximum P release at pH 5 for microwave and conventional heating. Efficiency = ((maximum ortho-P release with pre-treatment) – (ortho-P release without pre-treatment, i.e. 48±7 mg L-1)) / (total initial P). ... 187 Figure 8.1 Treatment train for recovery of energy, organic fertilizer, ammonium sulfate fertilizer, and N/P/K slow-release fertilizer from a waste stream. CHP = combined heat and power generation. ... 189 Figure 9.1 Scope of the nutrient recovery model (NRM) library as compared to the activated sludge model (ASM) library. ... 217 Figure 9.2 Six-step model development scheme. Step I: definition of modelling objectives; Step II: theoretical model development. MSL = model specification language. ... 218
Figure 9.3 Development of combined physicochemical-biological three-phase (liquid-solid-gas) process models. COD = chemical oxygen demand; G = gas; P = precipitate; Q_gas = gas flow rate; Q_liq = liquid flow rate; Q_prec = precipitate extraction rate (for NRM-Prec); S = soluble; X = biological particulate COD. ... 220 Figure 9.4 Use of PHREEQC for nutrient recovery model (NRM) building: methodology for selection of relevant species and reactions per key unit and development of a reduced PHREEQC chemical speciation model. ... 223 Figure 9.5 Tight coupling of reduced PHREEQC to Modelica code and model execution in Tornado. ... 239 Figure 9.6 Overview of the PHREEQC-Tornado interface coupling chemical speciation calculations at every time step to slow physicochemical and biochemical dynamic transformations. AE = algebraic equations; ODE = ordinary differential equations; X(0) = initial state of the system; X(t) = state of the system at time t. ... 240 Figure 9.7 Experimental set-up: lab-scale experiment for P recovery from digestate. ... 242 Figure 9.8 P recovery efficiency (%) as function of input Mg and Ca concentration (mol m-3) for streams with high (A: digestate 1) and low (B: digestate 2) Fe and Al input concentrations. Red stars indicate the digestate compositions of the case studies. ... 248 Figure 9.9 P recovery efficiency (%) as function of input Mg (range: 0-500 mol m-3) for digestate 1 after CaCO3 removal (= optimization 1) and exclusion of Fe/Al addition in processes upstream (= optimization 2). ... 250 Figure 9.10 Simulated NH3 recovery efficiency (%) as function of carbonate alkalinity (S_C_4_in, mol m-3) using the NRM-Strip model. The red star indicates the digestate composition under study. ... 252 Figure 10.1 Conceptual overview: use of the nutrient recovery model (NRM) library for treatment train configuration and optimization. GSA = global sensitivity analysis. ... 261 Figure 10.2 Strategy used for global sensitivity analysis. Grey boxes indicate the research objectives. NRM = nutrient recovery model; R2 = determination coefficient; VIF = variance inflation factor. ... 262 Figure 10.3 Standardized regression coefficient (SRC) for CH4 production resulting from global sensitivity analyses at fixed input CH4 concentration (0.0001 mol m-3) and temperature (35 °C) for Scenario B (A; R2 = 0.83, R2adj = 0.83) and C (B; R2 = 0.83, R2adj = 0.82). Scenario B: manure (Cesur and Albertson, 2005); Scenario C: sludge (Astals et al., 2013). Dark grey = very high importance (CFT1); grey = high importance (CFT2). CFT = cut-off threshold. ... 279 Figure 10.4 Detail Monte Carlo simulation results: biogas H2S partial pressure (atm) as function of precipitated FeS (mol m-3) for Scenario C (sludge; Astals et al., 2013). Red non-dashed line indicates the limit for corrosion risks (0.0035 atm; Deublein and Steinhauser, 2011). ... 280 Figure 10.5 Detail Monte Carlo simulation results: P precipitation (kmol d-1) as function of temperature (°C) for Scenario C (Co-digestate; Vlaco, 2012). ... 284 Figure 10.6 Detail Monte Carlo simulation results: NH3 removal efficiency (%) as function of input chloride concentration (S_Cl; mol m-3) for Scenario B (Cesur and Albertson, 2005). ... 287 Figure 10.7 Proposed treatment train configuration targeting struvite and ammonium sulfate fertilizer. Red = consumable (= cost). Green = recovered resource (= revenue). AD = anaerobic digestion; Dose = chemical dosing; Heat = heat exchanger; Prec = precipitation/crystallization; p = partial pressure in the biogas; Q_liq = liquid flow rate; Scrub = scrubber; Strip = stripper. ... 290 Figure 10.8 Monte Carlo simulation results for the pig manure treatment train (Fig. 10.7): revenues ($ d-1) from CH4 production (considering 22 % losses) as function of digester heating costs ($ d-1), considering that the actual digester heat requirement (including losses) is about 1.9 times higher than the theoretical heat required for manure heating (CDM, 2009; Tchobanoglous et al., 2003; USEPA, 1981; Vaneeckhaute, 2009). Reference temperature = 20 °C. $ = USD; 1 USD = 1.14 CAD = € 0.80 (November 2014). ... 293
Figure 11.1 Bio-based fertilization recommendations as function of local/regional fertilizer legislations. AmS = ammonium sulfate; LF = liquid fraction. ... 314 Figure 11.2 Conceptual algorithm for configuration and optimization of nutrient recovery treatment trains. Dashed lines indicate recycle flows. AmS = ammonium sulfate; TSS = total suspended solids. ... 317
List of abbreviations
Ac Acetate
AD Anaerobic digestion
ADM1 Anaerobic digestion model No. 1
AE Algebraic equation
AM Animal manure
AmS Ammonium sulfate
API Application programming interface ASM Activated sludge model
AS Activated sludge
AT Australia BCR Bubble column reactor BE Belgium Bu Butyrate CA Canada
CAPDET Computer assisted procedure for the design and evaluation of wastewater treatment systems
CAPEX Capital expenditures
CaUE Calcium use efficiency
CF Chemical fertilizer
CFT Cut-off threshold
CH Switzerland
CHP Combined heat and power generation COD Chemical oxygen demand
CRH Critical relative humidity CSD Crystal size distribution
CSR Controlled- and slow-release CSTR Continuously stirred tank reactor CUI Command-line user interface
DAE Differential algebraic equation
DD Digestate derivatives
DE Germany
DOC Dissolved organic carbon
DOM Dissolved organic matter
DTB Draft tube baffled type crystallizer
DW Dry weight
EBPR Enhanced biological phosphorus removal
EC Electrical conductivity
ED Electrodialysis
EU European Union
FAO Food and Agricultural Organisation of the United Nations FBR Fluidized bed reactor
FI Finland
FO Forward osmosis
FW Fresh weight
G Gas phase component
GHG Greenhouse gas
GISCOD General integrated solid waste co-digestion modelling tool GN_Direct DIviding RECTangles algorithm for global optimization
GSA Global sensitivity analysis
GUI Graphical user interface
HRT Hydraulic residence time
HSD Honestly significant difference
ICBM Introductory Soil Carbon Balance Model
ICP-OES Inductively coupled plasma optical emission spectrometry IRR Internal rate of return
IWA International Water Association JP Japan
LCA Life cycle assessment LCFA Long chain fatty acid
LF Liquid fraction
LHS Latin hypercube sampling
K Kelvin KUE Potassium use efficiency
MA Mineral acid
MANNER‐NPK MANure Nitrogen Evaluation Routine modelling tool
MAP Magnesium ammonium phosphate = N-struvite
MC Monte Carlo
MDDEFP Ministère du Développement Durable, de l’Environnement, de la Faune et des Parcs
MF Microfiltration
MgUE Magnesium use efficiency
MKP Magnesium potassium phosphate = K-struvite
MSL Model specification language
MW Molecular weight
NAC Neutral ammonium citrate
ND Not determined
NDICEA Nitrogen dynamics in crop rotations in ecological agriculture
NINV Net investment
NIST National Institute of Standards and Technology
NL The Netherlands
NPV Net present value
NRT Nutrient recovery technology
NRM Nutrient recovery model
NRM-AD Nutrient recovery model: Anaerobic digester NRM-Chem Nutrient recovery model: Chemical dosing unit NRM-Heat Nutrient recovery model: Heating unit
NRM-Prec Nutrient recovery model: Precipitation/crystallization unit NRM-Scrub Nutrient recovery model: Scrubbing unit
NRM-Settle Nutrient recovery model: Settling unit NRM-Store Nutrient recovery model: Storage tank NRM-Strip Nutrient recovery model: Stripping unit NRM-UO Nutrient recovery model user objective NUE Nitrogen use efficiency
N/A Not applicable
ND Not determined
No. Number
OC Organic carbon
ODE Ordinary differential equation
OPEX Operational expenditures
p Partial pressure
P Precipitated component
PAE Plant available elements
PAEV Plan agro-environnemental de valorisation P-PAE Phosphorus extractable with CaCl2 PAl Ammonium lactate extractable phosphorus
PAO Phosphorus accumulating organism
PE Person equivalent
PHA Poly-hydroxy-alkanoate PHREEQC PH REdox EQuilibrium (in C language) PP Poly-phosphate
Prhizon Phosphorus extractable with rhizon soil moisture samplers Pro Propionate
PSD Particle size distribution PUE Phosphorus use efficiency Pw Water extractable phosphorus
RK4ASC Runge Kutta 4 Adaptive Step size Control integration algorithm
S Soluble component
SAR Sodium adsorption ratio
Sc Scenario
SI Saturation index
SMS Soil moisture sampler SOC Soil organic carbon
SRB Sulfate reducing bacteria
SRC Standardized regression coefficient SRT Solids retention time
SS Suspended solids
SUE Sulfurous use efficiency TDS Total dissolved solids
TF Thick fraction
TMCS Transmembrane chemosorption
TS Total solids
TSP Triple superphosphate
TSS Total suspended solids UF Ultrafiltration USA United States of America Va Valerate
VFA Volatile fatty acid
VIF Variance inflation factor
VODE Variable-coefficient ordinary differential equation solver VSEP Vibratory shear enhanced processing
VSS Volatile suspended solids WAS Waste activated sludge WRRF Water resource recovery facility
WSA Water-sparged aerocyclone
WWTP Wastewater treatment plant
List of symbols
Symbol Description Unit
Specific surface of the gas bubbles per reactor volume L
Collision efficiency factor -
Specific area of surface per gram of seed material before the
seed crystals start to grow in the crystallizing solution L M
C_i Carbon content of component i M M
°C Degree Celcius -
Average gas bubble diameter
Liquid phase diffusion coefficient L T
Gas phase diffusion coefficient L T
Particle diameter
D°H German degrees of hardness -
Turbulence constant -
fproduct,substrate Yield (catabolism only) of product on substrate M M
f_ns_P Fraction of non-settleable precipitates -
f_ns_X Fraction of non-settleable solids -
Root mean square velocity gradient T
, Temperature dependent Henry coefficient of component M L atm
Discount rate -
, Hydrogen inhibition for substrate degradation -
, Hydrogen sulfide inhibition for substrate degradation - , Inhibition of biomass growth due to lack of inorganic nitrogen -
, pH inhibition of acetogens and acidogens -
, pH inhibition of component -
Aggregation constant -
Acid dissociation constant -
Floc break-up constant T L
, Temperature dependent nucleation rate coefficient M L T , First order decay rate for biomass death of component T , Complex particulate first order disintegration rate of
component T
, Temperature dependent dissolution rate coefficient M L T , Individual gaseous mass transfer coefficient of component L T , Overall gaseous mass transfer coefficient of component L T , Temperature dependent growth rate coefficient M L T
, First order hydrolysis rate of component T
Ion pairing equilibrium constant -
, Individual liquid mass transfer coefficient of component L T , Overall liquid mass transfer coefficient of component T / , Overall liquid-gas mass transfer coefficient of component L T
, Specific Monod maximum uptake rate of component T
Solubility product M L
Monod half saturation constant of component M L Temperature dependent liquid-solid transfer coefficient M L T
Symbol Description Unit
K_i Potassium content of component i M M
Length (dimension) -
Total mass / moles of fertilizer Mass of seed material in the reactor
Molecular weight M M
Mass / Moles (dimension) -
Liquid-solid transfer reaction order -
Total number of periods
NA Avogadro constant (6.022E23 mol-1) M
Reaction order for nucleation -
Reaction order for dissolution -
Reaction order for growth -
Number of particles -
N_i Nitrogen content of component i M M
, Partial pressure of component in the gas phase atm
P_i Phosphorus content of component i M M
Qgas Gas flow rate L T
Qin/Qout In- and outgoing flow rates L T
Qliq Liquid flow rate L T
Qprec Precipitate extraction rate (for NRM-Prec) L T
Qrecycle Recycle flow rate (for NRM-Scrub) L T
r Regression coefficient -
Universal gas law constant (0.082) L atm mol-1 K-1
Net cash flow at time $
Saturation ratio -
/ In- and outgoing activities of component M L
S_i Sulfur content of component i M M
Time
Temperature K
Time (dimension) -
Average rise velocity of gas bubbles L T
+ + - = sum of the number of positive and negative species
= stoichiometric liquid-solid transfer coefficient -
Total fertilizer volume L
Head space volume / gas volume L
, Stoichiometric coefficient for component on process M M
Liquid volume L
Ysubstrate Biomass substrate yield M M
Density of the flow M L
Net rate of floc (agglomerate) appearance L T
Specific kinetic rate for process M L T
Mean residence time of gas bubble in the reactor T
Dedicated to the future in the sincere hope for
a more sustainable resource management
Dédié à l'avenir dans l'espoir sincère pour
une gestion plus durable des ressources
Toegewijd aan de toekomst in de oprechte hoop voor
een meer duurzaam beheer van grondstoffen
Acknowledgements
Inspired and passionated by the cradle-to-cradle (‘Remaking the way we make things’) thought, I started in May 2011 enthusiastically an intensive and exciting journey, of which you now hold the results in hands. More than these pages, it is the ride towards it that has enriched me a lot and that makes it an unforgettable experience. The last four years a lot of people have somehow walked with me on my thesis path, for which I herewith would like to thank them wholeheartedly.
Supervisors, and more than supervisors, Erik Meers, Filip Tack, Peter Vanrolleghem, and Evangelina Belia. Thanks for giving me the privilege to work with you and deploy my skills. Erik, after your enthusiastic support during my MSc thesis, you have given me the opportunity to further let me taste of the exciting world of digestate and manure. I believe that words are inapt to say how much I am greatful to you for that. You always came up with challenging ideas and your driving force during each meeting resulted in a boost in the right direction. I enjoyed the confidence that you gave me to create my own path and the freedom that you gave me in expressing my opinions and thoughts, and enriching my knowledge. What probably thrilled me the most, is your enduring belief in my abilities. At least, you always gave me that feeling, and it worked stimulating. You managed to place me with the right people at the right time. This has not only been invaluable for this PhD research, but also for my future work and life. I hope that we can keep up our good collaboration and relationship in future projects. You know that I catched the ‘taste’ of digestate, and I will not let it go.
Prof. Tack, without you it may not even have been possible to start a PhD. Thanks first of all for giving me the opportunity to work as an assistant at Ecochem. Actually, I could not even imagine the first two years of my PhD in Ghent without part-time teaching practical skills to students. I really enjoyed this occasion and the freedom that you gave me in deploying my skills as a teacher. Moreover, you entrusted me with the unique opportunity to work on curriculum development in environmental science in Central Asia. Although the trips were quite tiring and not always that secure ;-), it was a very enriching experience in many ways. Obviously, I would like to thank you as well for the unlimited access to the lab. Without the many physicochemical analyses techniques that were made at my disposition, the experimental part of this work would not be as profound as it is today. Just like Erik, you always gave me a strong feeling of trust and faith in my abilities. This has helped me building up self-confidence, independency, and stability, three skills that I believe have given a great additional value to this work. I really appreciate that you kept the door open for me during my time in Canada, and even thereafter. Thanks as well for helping me with the bunch of administrative paperwork at the end of this joint PhD.
From Belgium to Canada. Indeed, fate blew me accross the sea.
Peter, thanks for giving me the ones-in-a-life-time opportunity to continue my PhD in another part of the world. More than this work, this transition has impacted my whole life and future.
What I really appreciate is that you also value the non-work related things in life. Our meetings were very profound, but there was time to laugh, google, and chat about daily stuff. On top of that, I believe our meetings and discussions were always very constructive, which has greatly helped improving this work. Also your honesty and openness are things that I greatly valued while working with you, although this was sometimes confronting and confusing to me, as you know . Your enthousiasm was encouraging, and stimulated me to develop skills in the, to me, quite new, but not less interesting, area of modelling. In a short period of time, you helped me enriching my network and connected me with the right people. I also really appreciate that you have always revised my papers, presentations, etc. into detail. We both being ‘perfectionists’ has certainly delivered a great additional value to the modelling part of this work.
Lina, without Primodal I would probably never have started modelling. Thanks to you and John Copp for giving me this opportunity. It was always fun when you were around. More than that, I really felt a strong support and belief in ‘Women in Science’ from your side. Your nudge in the back now and then has greatly helped me in difficult times, probably more than you know of. If I did not see the wood for the trees, you were there to make the whole more manageable. You realize that life is not only about work, although I know you work really hard. I admire what you’re doing and you inspire me. I hope there’ll be a way to collaborate on future consultancy tasks.
Behind amazing supervisors, there’s always a bunch of amazing colleagues.
Joachim Neri, not only one colleague in a million, but also one friend in a million. Actually, I believe you’re to good for this world. Even when you were overflowing of work, you were always there as a listening ear or comforting shoulder. You were the person in Ghent that always supported me in my crazy ideas and helped me find an answer to practical questions. Thanks so much for teaching me the many, maaaaany lab tricks. Our swimming sessions at lunch time were real fun and gave me just that bit of extra energy to come up with even more crazy ideas in the afternoon. Don’t need to talk about our cava sessions on Friday evening ;-) I can’t wait to get to Belgium to finally start the cultivation of our brine shrimps.
Martin Meirlaen, handyman in need , but more important: an amazing, sincere, and beloved person, overloaded of energy and positive life spirits. We really had a lot of fun, not only in teaching the international students, but also outside the work floor. If material was required, then you were ready in each case. Plant basins, water bottles, perforated trays, etc. One word was enough and it was already brought to the Coupure (or the Koepuur). Besides technical issues, you were ready to listen, help, and cheer me up no matter with what kind of problem that I was struggling. Thanks to you there was always a good excuse for not going home immediately after work, and if there wasn’t, we created one ;-) I am very grateful that I had the privilege to get to know you, and that I was somehow part of your life for a couple of years, just as you were part of mine. Actually, you still are.
I’m ensured that a PhD is more than factual science. The science between people is at least as important. You sharing your life experiences with me, has certainly influenced my life and this work in many ways. Thanks for your daily goodness and cheerfullness, and for the many, many, lively chats and encouragements.
Of course, I want to thank all other colleagues at Ecochem as well. In the time that I was around, lots of people crossed my path, but I am particularly greatful to Evi, Ria, Katty, Stijn, Frederik, Jeroen, An, David, Pradeep, and Srikanth, for their support, many pleasant chats, and a good drink now and a while.
Although my modelling tasks as such constituted a more ‘silent’ job than lab and field work, I do met great friends at modelEAU as well. I especially want to thank my office mates Queralt, Mansour, and Coralie for the close relationship, many supporting talks, and ‘special’ 5 à 7’s ;-) We’ll definitely keep in touch. Also a special word of thank to Frédéric and Cyril for revision of the French abstracts. Further, Thibaud, Sovanna, Sylvie, Lisha, Giulia, Atefeh, Janelcy, and Thomas, thank you for the internal support, relaxing coffee breaks, and fun outdoor activities now and then.
And hoho, not to forget, my thesis students, Pieter, Joery, Marjolein, Joachim, Aga, Massimo, and Veronica. After your lovely acknowledgments in your Master theses, now it’s my turn to acknowledge you guys! The relationship and close collaboration with each of you was very particular. I especially want to thank Marjolein Vanoppen and Joery Janda for their fantastic assistance in the lab. The data that you provided were very useful to my PhD. Thanks for the good job!
When it was time to work, I worked. But when it was time to party, I partied. Thanks to all my friend gangs for reminding me that there is more in life than a PhD.
First, ‘de vrienden van milieu’, and in particular ‘de girls’, Linde, Natascha, and Katrijn. The time that I was in Ghent you really helped me clearing my head, whether it was during our lunch breaks, late-night Cloosterkes, Maastricht trips, or other. Also thanks to all other former class mates and everlasting friends, mainly Katrijn, Glynn, Baetske, Matthijs, Anton, Leendert, Bert, Stefaan, Pieter, and Alexander. Can’t wait for our next weekend trip, mates!
‘De Vrienden van Deinze’, in particular Lieselot, Kim, Lien, Sarah, Evelien, Bientje, Lynn, Maura, Tom, nonkel Bailey, Dhaene, Manu, Piet, Lisa, Marie, Anouk, and Camille, and of course my lovely cousins, Gilles and Nikki, nonkel Djurk, TantEls, tante Christine, nonkel Flup and my sweet méméetjes. Even though most of you have no feeling for science (sorry to say ;-), you will always have a particular place in my heart. I belief that people develop important life spirits and passions during their yought and from the people they grew up with. My roots are with you, my friends. Deinze rules!