COMPUTER SIMULATIONS OF SPRAY RETENTION BY A
3D BARLEY PLANT:
EFFECT OF FORMULATION SURFACE TENSION
M. MASSINON1, N. DE COCK1, S. OULED TALEB SALAH1,2 and F. LEBEAU11 Liege University, Gembloux Agro-Bio Tech, Biosystems Engineering Department 2 Liege University, Gembloux Agro-Bio Tech, AgricultureIsLife Platform
Corresponding author E-mail: m.massinon@ulg.ac.be SUMMARY
A spray retention model was used in this study to explore theoretically the effect of a range of mixture surface tension on the spray retention and the variability of deposits. The spray retention model was based on an algorithm that tested whether droplets from a virtual nozzle intercepted a 3D plant model. If so, the algorithm determined the contribution of the droplet to the overall retention depending on the droplet impact behaviour on the leaf; adhesion, rebound or splashing. The impact outcome probabilities, function of droplet impact energy, were measured using high-speed imaging on an excised indoor grown barley leaf (BBCH12) both for pure water (surface tension of 0.072 N/m) and a non-ionic superspreader (static surface tension of 0.021 N/m) depending on the surface orientation. The modification of spray mixture properties in the simulations was performed by gradually changing the spray the droplet impact probabilities between pure water and a solution with non-ionic surfactant exhibiting super spreading properties. The plant architecture was measured using a struc-tured light scanner. The final retention was expressed as the volume of liquid retained by the whole plant relative to the projected leaf surface area in the main spray direction. One hun-dred simulations were performed at different volumes per hectare and flat-fan nozzles for each formulation surface tension. The coefficient of variation was used as indicator of varia-bility of deposits.
The model was able to discriminate between mixture surface tension. The spray retention increased as the mixture surface tension decreased. The variability of deposits also decreased as the surface tension decreased. The proposed modelling approach provides a suited tool for sensitivity analysis: nozzle kind, pressure, volume per hectare applied, spray mixture physi-cochemical properties, plant species, growth stage could be screened to determine the best spraying characteristics maximizing the retention. The model will be further extended with the real droplet trajectories in moving airstreams.
Key words: droplet impact, spray retention, variability, virtual models, plant architecture, surface tension.
INTRODUCTION
The overall spray efficacy results from the contribution of four steps; deposition, retention, uptake and translocation (Zabkiewicz, 2007). Retention, which is the amount of liquid actually retained per unit of leaf surface area, is expected to have efficiencies ranging between 10 and 100% due to the variations in volumes per hectare applied, droplet sizes, droplet velocities, droplet directions as well as variations in leaf wetting properties and orientation. This high variability of reten-tion between plants (Miller et al., 2010) may cause adverse agronomic effects, such as the emergence of herbicide resistance in weed populations (Henriet and Maréchal, 2009), when the required pesticide dose is insufficient. Faced to the great complexity of a spray application due to the number of factors involved (Massinon and Lebeau, 2013; Taylor, 2011; Wirth et al., 1991), comprehensive
2
using a simulation approach (Nairn et al., 2013) to understand, predict and opti-mize the spray application of plant protection products.
Some advances have been done in this way by Forster et al. (2005) and Nairn et al. (2013) using an universal spray adhesion model based on a huge experimental stud-ies of droplet impaction using microdrop generator on various leaf surfaces and orientations. This approach was able to explain 72% of the deviance between ob-served and predicted adhesion values on many plants/formulations/droplet proper-ties combinations. Droplet interception models based on theoretical plant architec-ture, as the Lindenmayer system, were also developed to relate different spray techniques to various vegetative structures (Dorr et al. 2007), but used basic de-scription of droplet behaviour at impact. Process-driven models that include exper-imental correlations between physicochemical parameters and the droplet impact behaviour on leaf surface were also developed for generalization purpose (Dorr et al., 2014), since any new leaf surface/spray formulation/application technique combination could be studied. Finally, the behaviour of the whole range of spray droplets could be studied on an artificial or natural superhydrophobic surface using high speed imaging (Massinon et al., 2014; Massinon and Lebeau, 2012b). This ap-proach provides the actual spray droplet behaviour at impact, including the coex-istence of different droplet impact outcomes for similar impact energy that may arise from the spatial variability of leaf surfaces.
Computational simulations were conducted to provide an estimate of spray reten-tion by a 3D barley plant, used as a plant architecture benchmark in this study taking advantage of the recent development of 3D scanning systems (Paulus et al., 2014). The aim was to explore theoretically the effect of a range of mixture sur-face tension, between pure water and a solution with non-ionic surfactant exhibit-ing super spreadexhibit-ing properties, on the spray retention and its variability for foliar application of pesticides.
MATERIALS AND METHODS Model description
The model used in this paper is described in Massinon et al. (2015) and is summa-rised hereafter. The model is based on three experimental inputs: the 3D plant architecture, the droplet size distribution and the droplet behaviour at impact. A DAVID Structured Light Scanner SLS-2 (DAVID Vision Systems GmbH, Koblenz, Ger-many) was used to reconstruct a 3D plant model. An indoor grown barley plant at two leaf growth stage has been chosen to provide the 3D plant architecture. A virtual nozzle was built based on droplet size distributions of six flat-fan hydraulic nozzles were used to explore various common spray qualities. The noz-zles/pressures combinations chosen here are expected to be used as boundaries between very fine (VF), fine (F), medium (M), coarse (C), very coarse (VC), extra coarse (XC) and ultra coarse (UC) classes in the future ISO standard (ISO 25358) for classification of droplet size spectra. The droplet size distributions were measured by high-speed shadow imagery 500 mm downwards the outlet of the nozzle (De Cock et al., 2014) with water according the ISO draft standard. Table 1 shows the spray characteristics used in the simulations.
Table 1. Droplet size distribution characteristics for the six nozzles used in the simulations (measured with pure water)
Nozzles and pressures 11001
@4.5 bars @3.0 bars 11003 @2.5 bars 11006 @2.0 bars 8008 @1.5 bars 6510 @1.5 bars 6515
Class boundary VF/F F/M M/C C/VC VC/XC XC/UC
Dv10 [µm] 88 119 138 165 201 221
Dv50 [µm] 154 239 304 375 479 532
Dv90 [µm] 232 414 532 612 786 927
Droplet directions were given randomly to each droplet from representative data. Spray droplet impact behaviours were measured using the methodology presented in Massinon and Lebeau (2012). Droplet impact probability maps (Figure 1) were built from the observation of spray impact on an excised barley leaf at different orientations (Boukhalfa et al., 2014; Massinon et al., 2014) for the two extreme formulation scenarios in terms of surface tension. These graphs show the volume percentages of every droplet impact outcome within different energy classes, de-fined using the water Weber number, and assimilated as the probabilities. The dimensionless water Weber number is computed as follow:
𝑊𝑒𝑊=𝜌𝑉²𝐷𝜌 [1]
where 𝜌 is the liquid density, 𝑉 is the droplet velocity before impact, 𝐷 is the drop-let diameter and 𝜎 is the water surface tension in MKS system of units. The Weber numbers were computed with the water surface tension to enable comparison between formulation surface tension. It is well established that the DST is better correlated with retention (Anderson and Hall, 1989; Dorr et al., 2015), for which the appropriate time scale for its measurement scales with droplet contact time on the target surface (Richard et al., 2002) must be chosen. The contact time can be very small and the actual DST remains therefore difficult to measure.
WeW
Figure 1. Spray droplet impact probabilities depending on the droplet impact energy (upper energy class boundary expressed using the water Weber number) on a horizontal excised barley leaf at two leaf growth stage. Pure water (Left), non-ionic surfactant at 0.1%v/V in pure water (right). The droplet impact types (adhesion, rebound and splashing) are depicted
4
Table 2 shows the energy upper class boundaries in terms of water Weber numbers used in Figure 1 and 2.
Table 2. Correspondence between energy class labels and upper class boundaries (WeW) Energy class Upper class boundary (WeW)
1 2.00E-02 2 6.00E-02 3 1.80E-01 4 5.40E-01 5 1.62E+00 6 4.86E+00 7 1.46E+01 8 4.37E+01 9 1.31E+02 10 3.94E+02 11 inf
From the impact probabilities of Figure 1, logistic regressions were applied for the three impact outcomes to obtain parametrised curves for the two extreme wetting scenarios according the following model (sigmoid function):
𝑦(𝑥) = 𝐴
1 + exp (𝑎 − 𝑥𝑏 ) [2]
where A is the curve’s maximum value, a is the x-value of the sigmoid midpoint and b is the steepness of the curve. The eleven energy classes were numbered from 1 to 11 (Table 2). Logistic regressions were performed using these discontinued values for the x-axis. The logistic regression was applied for the adhesion and the splashing impact behaviours. For rebound, the probability distribution was calcu-lated for the range of energy classes by subtracting their probability for adhesion and splashing from 1. The values of the parameters for the different logistic regres-sions were set as follow: for adhesion, A=1, b=0.5 and a varied from 1 to 7 in order to explore theoretically the range of spray mixture impact behaviour in terms of surface tension (Figure 2). For splashing, A=1, b=0.2 and a=9 anytime. This range of spray impact probabilities was used in the interception algorithm to provide the impact outcome of each droplet of the virtual nozzle. Then the contribution of each droplet to the final retention (µL/cm²) was computed using the interception and retention models.
When a droplet is splashing on an hairy leaf surface or a leaf with other micro-roughness structures (waxes), a part of the droplet may be trapped into the surface roughness depending on the liquid surface tension and the droplet impact pressure (Boukhalfa et al., 2014; Taylor, 2011), such pinning impacts occur when the droplet lies in the Wenzel wetting regime (Wenzel, 1936), and are referred to as partial splashing in this paper. This behaviour was included in the algorithm by multiplying the volume of the droplet by the proportion of droplet in volume remaining on the surface after a splashing in Wenzel wetting regime. This proportion, K, varies from 0 and 100%.
Vol u me pe rcent ag e a=1 a=2 a=3 a=4 a=6 a=7 WeW
Figure 2. Various droplet impact outcome probabilities depending on the water Weber num-ber: Adhesion (square), rebound (triangle) and splashing (circle). Parameter a is the adhesion sigmoid midpoint. The total adhesion proportion increases as parameter ‘a’ increases. These impact probabilities are used to determine the droplet impact outcome in the virtual spray model.
6 RESULTS AND DISCUSSION
One hundred simulations were performed with 100 different droplet size samples for each modality tested by the spray retention model.
Effect adhesion proportion on retention
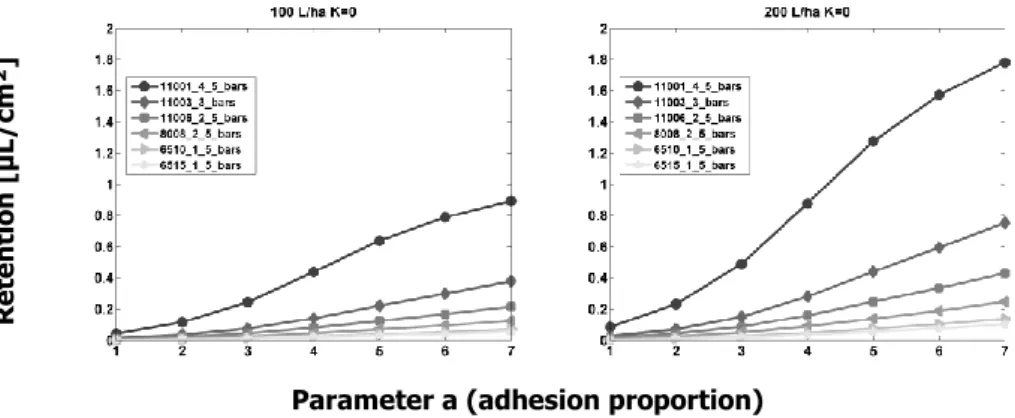
Figure 3 shows the simulated mean spray retention, expressed in µL of retained liquid per unit of projected surface area of the 3D plant over the ground, for the six nozzles for 100 and 200 L/ha depending on the proportion of adhesion (gradual increase of the sigmoid midpoint, parameter ‘a’ see Figure 2). The pinning propor-tion K was set to 0 here, meaning that no liquid remains on the plant after a splashing (Cassie-Baxter wetting regime).
R ete ntion [µL/c m ²]
Parameter a (adhesion proportion)
Figure 3. Simulated mean spray retention (µL/cm²) depending on the proportion of adhesion determined by the parameter a of the logistic regression. 100L/ha (left) and 200 L/ha (right). The retention was always smaller than the applied volume (100 L/ha = 1µL/cm²) whatever the spray quality tested because of losses at impact and the not inter-cepted droplets. Retention increased as the adhesion proportion increased whatev-er the spray quality. For the finwhatev-er spray quality (10001 nozzle) retention tended towards the applied volume when the proportion of adhesion increased. The coars-er nozzles are less influenced by the adhesion proportion because the majority of the droplets lie in greater energy classes where splashing is dominant. The same trends were observed at 200 L/ha.
Effect of pinning proportion on retention
Figure 4 shows the effect of the pinning proportion (K) on the mean spray retention for the six spray qualities at 100 L/ha. Finer spray (11001 nozzle) was not influ-enced by the pinning proportion because of they contain no splashing droplets. The influence of the pinning proportion increased as the mean droplet size (DV50, Ta-ble 1) increased, tending towards the value of this pinning proportion when drop-lets were mainly found in higher energy classes. The increase of retention thanks to
increase of adhesion proportion was gradually reduced with increasing spray coarseness. R ete ntion [µL/c m ²]
Parameter a (adhesion proportion)
Figure 4. Effect of pinning proportion (K) on the mean spray retention by the 3D plant model depending on the adhesion proportion and the spray quality. K ranged from 0 to 0.4.
Effect of plant size on retention
Figure 5 shows the effect of the modification of the plant size on the spray reten-tion (Figure 5, left) and the associated variability (Figure 5, right) depending on the adhesion proportion for a 11001 nozzle at 100 L/ha with a pinning proportion set to zero. The plant size was modified with various scale factors ranging from 0.05 to 2 and corresponding to a 0.051-81.222 cm² range of plant leaf surface area. The X, Y and Z vertex coordinates of the 3D plant model were multiplied by the same scale
8
As expected, mean retention was found not depending on the plant size because retention is expressed in µL of retained liquid per unit or projected leaf surface area. Retention increased with the increase of the proportion of adhesion. The spray variability was evaluated using the coefficient of variation (CV) computed from the 100 replicated simulations. A high coefficient of variation may result in a poor treatment efficacy since some plants may receive insufficient amount of ac-tive substance to achieve its effect. CV decreased as the plant size increased be-cause retention resulted from a greater number of intercepted droplets. CV also decreased as the adhesion proportion (parameter a, Figure 2) increased because the proportion of rebound decreased.
Scaling factor
Figure 5. Effect of plant size on the predicted retention (left) and the coefficient of variation (right) for 7 adhesion proportions (parameter a), from 1 to 7.
CONCLUSION
A 3D virtual spraying model to predict spray droplet interception and retention by single plant architecture has been used to study theoretically the effect of the mixture surface tension by modifying the spray droplet impact probabilities. The model was based on the measurement of the 3D plant architecture of a barley plant, on the use of a virtual nozzle for providing representative droplet size distri-butions and on spray droplet impact outcomes characterized with high-speed imag-ing and image analysis on the barley leaf surface. The model was able to discrimi-nate between mixture wettabilities, which were affected by surface tension modi-fications. The spray retention increased as the mixture surface tension decreased. The variability of deposits also decreased as the surface tension decreased. The proposed modelling approach provides a suited tool for sensitivity analysis: nozzle kind, pressure, volume per hectare applied, spray mixture physicochemical properties, plant species, growth stage could be screened to determine the best spraying characteristics maximizing the retention. The model will be further ex-tended with the real droplet trajectories in moving airstreams. Further studies may seek to find optimum spray droplet trajectories that maximize retention acting on pesticide application method on a given target.
LITERATURE
ANDERSON, N., HALL, D., (1989). The role of dynamic surface tension in the retention of surfactant sprays on pea plants. Adjuvant and Agrochemicals 2: 51-62.
BOUKHALFA, H.H., MASSINON, M., BELHAMRA, M., LEBEAU, F., (2014). Contribution of spray droplet pinning fragmentation to canopy retention. Crop Protection 56: 91-97.
DORR, G., WANG, S., MAYO, L., MCCUE, S., FORSTER, W.A., HANAN, J., HE, X., (2015). Impaction of spray droplets on leaves: influence of formulation and leaf character on shatter, bounce and adhesion. Experiments in Fluids 56: 1-17.
HENRIET, F., MARÉCHAL, P.-Y., (2009). Black-grass resistance to herbicides: three years of monitoring in Belgium. Communications in Agricultural and Applied Biological Sciences 74: 471-478.
MASSINON, M., BOUKHALFA, H., LEBEAU, F., (2014). The effect of surface orientation on spray retention. Precision Agriculture 15: 241–254.
MASSINON, M., DUMONT, B., DE COCK, N., OULED TALEB SALAH, S., LEBEAU, F., (2015). Study of retention variability on an early growth stage herbaceous plant using a 3D virtual spraying model. Crop Protection, under consideration.
MASSINON, M., LEBEAU, F., (2012). Experimental method for the assessment of agricultural spray retention based on high-speed imaging of drop impact on a synthetic superhydrophobic surface. Biosystems Engineering 112: 56-64.
MASSINON, M., LEBEAU, F., (2013). Review of physicochemical processes involved in agrochemical spray retention. Biotechnology, Agronomy, Society and Environment 17: 494-504.
MILLER, P.C.H., BUTLER ELLIS, M.C., BATEMAN, R., LANE, A.G., O'SULLIVAN, C.M.O., TUCK, C.R., ROBINSON, T.H., (2010). Deposit distributions on targets with different geometries and treated with a range of spray characteristics. Aspect of Applied Biology 99: 241-248. RICHARD, D., CLANET, C., QUERE, D., (2002). Surface phenomena: Contact time of a bouncing
drop. Nature 417: 811-811.
TAYLOR, P., (2011). The wetting of leaf surfaces. Current Opinion in Colloid & Interface
Science 16: 326-334.
WENZEL, R., (1936). Resistance of solid surface to wetting by water. Industrial & Engineering
Chemistry 28: 988-994.
WIRTH, W., STORP, S., JACOBSEN, W., (1991). Mechanisms controlling leaf retention of agricultural spray solutions. Pesticide Science 33: 411-420.
ZABKIEWICZ, J.A., (2007). Spray formulation efficacy - holistic and futuristic perspectives.