HAL Id: hal-00955440
https://hal.archives-ouvertes.fr/hal-00955440
Submitted on 4 Mar 2014
HAL is a multi-disciplinary open access archive for the deposit and dissemination of sci-entific research documents, whether they are pub-lished or not. The documents may come from teaching and research institutions in France or abroad, or from public or private research centers.
L’archive ouverte pluridisciplinaire HAL, est destinée au dépôt et à la diffusion de documents scientifiques de niveau recherche, publiés ou non, émanant des établissements d’enseignement et de recherche français ou étrangers, des laboratoires publics ou privés.
A Concept for Inferring ’Frontier Research’ in Research
Project Proposals
Dirk Holste, Ivana Roche, Marianne Hörlesberger, Dominique Besagni,
Thomas Scherngell, Claire François, Pascal Cuxac, Edgar L Schiebel
To cite this version:
Dirk Holste, Ivana Roche, Marianne Hörlesberger, Dominique Besagni, Thomas Scherngell, et al.. A Concept for Inferring ’Frontier Research’ in Research Project Proposals. 13th International Conference on Scientometrics and Informetrics, Jul 2011, Durban, South Africa. �hal-00955440�
A concept for Inferring ‘Frontier Research’ in Research Project
Proposals
Dirk Holste1*, Ivana Roche2, Marianne Hörlesberger1, Dominique Besagni2, Thomas Scherngell1, Claire Francois2, Pascal Cuxac2, and Edgar Schiebel1
1
Austrian Institute of Technology, Donau-City Strasse 1, 1220 Vienna (Austria)
2
INIST-CNRS, 2 Allée du Parc de Brabois, CS 10310, 54519 Vandoeuvre-les-Nancy (France)
Abstract
This paper discusses a concept for inferring attributes of ‘frontier research’ in peer-reviewed research project proposals under the European Research Council (ERC) scheme. The concept serves two purposes: 1) to conceptualize and define, automatically extract, and comparatively assess attributes of frontier research in proposals; and 2) to build and compare outcomes of a statistical model with the review decision in order to obtain further insight and reflect upon the influence of frontier research in the peer-review process. To this end, indicators (including scientific ‘novelty’, ‘risk’, or interdisciplinarity’) across scientific disciplines and in accord with the strategic definition of frontier research by the Council are elaborated, exploiting textual proposal information and other bibliometric data of applicants. Subsequently, a concept is discussed to measure ex-post the influence of indicators on the decision probability (or, alternatively, the odds) of a proposal to be accepted. The final analysis of the classification and decision probabilities compares and contrasts review decisions in order to, e.g., statistically explain congruence between frontier research and review decision or reveal differential representation of attributes. Ultimately, the concept is aiming at a methodology that monitors the effectiveness and efficiency of peer-review processes.
Background and Objectives
Scientific disciplines use peer review as an essential mechanism for resource allocation and quality control (Bornmann, 2010). It serves either to determine what research deserves to be published (ex-post review) or what proposed research deserves to be funded through national or regionally operating agencies (ex-ante review). Reviewers face the challenge to find out what is the “best” scientific research according to a journal’s/agency’s strategy. Typically, journal and grant schemes are sufficiently different that there are no “best practices”.
Peer-review systems are rooted in critical rationalism, widely accepted and actively supported by the scientific community. Currently they are considered the most effective functioning quality control instrument at hand. Still they are not free form criticism on a number of issues, including poor reliability (congruent opinions); fairness (biased opinions of non-scientific merit); predictive validity (decisions in accord with merit to the scientific community); or inefficiency (e.g., delay, resources spent, opportunity cost). Several issues are ‘systemic’ in that biases and quality filtering are not necessarily incommensurable. E.g. making scientific progress is fundamentally a conservative act building incrementally upon previous work and requiring evidence resp. balance of risk/reward before publishing (funding) radical papers (ideas); or social system dynamics of subjective human interaction giving rise to lower reliability but offset by higher predictive validity (Bornmann, 2010; Powell, 2010). Because of its central role for not only the scientific community but also publishers/editors and funding agencies, monitoring peer review processes is essential to shed light on to what extent set goals are actually accomplished by review decisions. The need for monitoring effects and the implicit reorientation of peer review processes is subject to current research activities (Hojat et al. 2003, Sweizer & Collen 1994, Bornmann & Daniel 2008, Marsh et al. 2008).
Where the scope and specialization of science has become too complex and sophisticated to be coped with by any one reviever, scientometric methods offer a ‘helping hand’ to either support the decision-making process or evaluate its outcome. In fact, scientometric evaluation has been witnessing a significant attention in the rising need to get a grip on science output and efficiency (Besselaar & Leydesdorff 2009; Norden 2010).
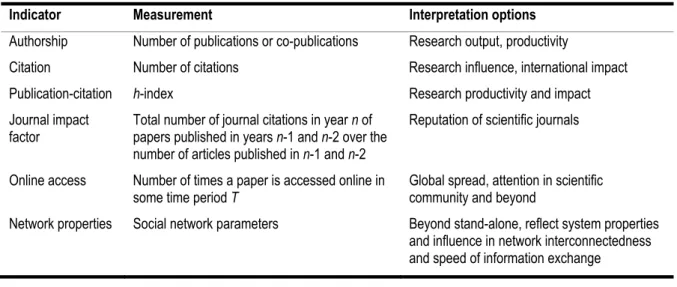
On the one hand, these methods carry strengths in that they are precisely defined and reliable, objective, efficient, and need no intervention; on the other hand, their weakness comes mainly in terms of limits of interpretation, applicability, confounding factors, and predictive validity – all of which are more or less debatable. Table 1 lists selected examples of scientometric indicators that are performance-centred and use easy-to-measure (in principle) volume data. Other indicators incorporate data extracted from networks of co-authorships, citations or bibliometric coupling; curriculum vitae, e.g., age, gender, institution (teaching, research); referee scores; or socioeconomic relevance (previously attracted, requested funds).
Table 1. Selected classical scientometric indicators for measuring scientific performance.
Indicator Measurement Interpretation options
Authorship Number of publications or co-publications Research output, productivity
Citation Number of citations Research influence, international impact Publication-citation h-index Research productivity and impact Journal impact
factor
Total number of journal citations in year n of papers published in years n-1 and n-2 over the number of articles published in n-1 and n-2
Reputation of scientific journals
Online access Number of times a paper is accessed online in some time period T
Global spread, attention in scientific community and beyond
Network properties Social network parameters Beyond stand-alone, reflect system properties and influence in network interconnectedness and speed of information exchange
Naturally a numerical model cannot be expected to substitute for expert peer review/process and the merit of the scientific community, each of which being hard to quantify. More faithfully models of this kind may serve to verify decisions, deliver support data efficiently, or hint at biases of the review process (Juznic et al. 2010).
The nature and objectives in journal reviews (co-authorship, selection, improving quality of published research) is different from reviews of proposed research projects (individual investigator, allocation of resources to inherently risky, speculative projects). This is particularly evident in different expectations on predictive validity and, consequently, the choice of indicators tailored to the underlying strategy, mission and policy of funding bodies to establish interpretable and useful cause-effect relationships. Meanwhile discrepancies between the selection decision on the set of “best” proposals derived from review systems and scientometrically predictive identifications are expected. Because measures, numbers, and comparisons among peers can deliver a powerful message and impose normative behavior (Ariel 2010), a number of studies have shed more light on underlying reasons (e.g., Besselaar & Leydesdorff 2009; Bornmann, Leydesdorff & Besselaar 2009; Juznic et al. 2010).
This paper looks at bibliometric evaluation of research project proposals:
• From a grant point of view, it focuses on proposals submitted to the prestigious European Research Council (ERC) in the scientific domains “Physics & Engineering”
(PE) and “Life Sciences” (LS)2. Scientists from all over the world, who are intending to work with a host institution based in a EU Member State or associated country, can compete for two different types of grants: Starting Grants (SGs) for investigators with 2-12 years of experience after their PhD at the stage of starting or consolidating their independent research team; and Advanced (AGs) for already established investigators with at least 10 years of experience and significant research achievements.
Grants are to support pioneering, far-reaching research endeavours, combine high risk/high impact potential, break established disciplinary boundaries, or explore new productive lines of scientific enquiry, methodology or techniques. Each project can receive up to 2 m€ (SGs) or 3.5 m€ (AGs) for a maximum of 5 years (cf. Table 2). • From a methodological point of view, it complements the standard approach to
scientific excellence, which is classically based on quantity of papers, citations, etc. (Bornmann, Leydesdorff, & Besselaar 2009), and takes into account textual features related to the content and quality of ‘frontier research’ (EC 2005) detectable in individual research proposals – being the sole criterion for awarding ERC grants to young or senior investigators (ERC 2008).
Due to the single evaluation criteria (scientific excellence), ERC grants provide a suitable test-bed for content analysis/text-mining and modelling in the field of bibliometric evaluation (Yoon, Lee & lee 2010). The primary interest is the extent to which research proposal comply with attributes of frontier research and the influence of these attributes on the selection of awarded grants.
Table 2. Number of proposals submitted and grants awarded by the ERC in 2007–2009. ERC grant (year) Total budget (m €) Number of proposals submitted Total number of grants awarded Number of grants awarded (in PE and LS) SG (2007) 335 9,167 299 242 AG (2008) 553 2,167 282 198 SG (2009) 325 2,503 244 187 AG (2009) 515 1,584 244 202
Source: ERC (2011); since 2009, SG and AG grants are awarded annually.
The remainder of the paper is structured as follows. After introducing the ERC peer review system and the definition of frontier research, the outline a concept of the review process is presented. Subsequently scientometric and text-analytic methods (Roche et al. 2010; Schiebel et al. 2010) capturing desired attributes of frontier research are laid out. Then, a discrete choice model is adopted to approximate the selection function and how indicators influence the decision probability for a proposal to be accepted. Finally, a discussion of the concept closes the paper by elaborating a comparison of peer review process and model outputs and the assessment of the “influencing power” of the individual indicators.
2
PE (LS) holds ten (nine) main and ~170 (100) subcategories. The third domain “Social Sciences & Humanities” is not considered as it is expected to differ in terms of publishing, citation behaviour, and other features from those observed in PE and LS (e.g., national/regional orientation, less publications in form of articles, different theoretical ‘development rate’, number of authors, non-scholarly publications), which make it less assessable for approaches developed for the natural and life sciences (Nederhof 2006; Juznic et al. 2010).
A concept based on joint scientometric and content analysis
Peer review process set up by the ERC
The first European research funding body targets research at the highest level of excellence in any scientific discipline. It supports investigator-driven projects aiming at broadening the scientific and technological knowledge without regard for established disciplinary boundaries (frontier research3) through open and direct competition. The selection of proposals for is based strictly on peer review. The ERC has established a process which is to identify scientific
excellence of frontier research as the sole evaluation criterion for funding decisions (ERC
2010). Internationally renowned scientists and scholars constitute two sets of review panels (for the SGs and AGs), each of which subdivided into 25 individual panels that cover the entire range of disciplines and fall into in the domains PE, LS, and SH4. Each panel is composed of 10-12 members and headed by a chair. If further expertise is required, external reviewers may be consulted by providing assessments on a proposal-by-proposal basis.
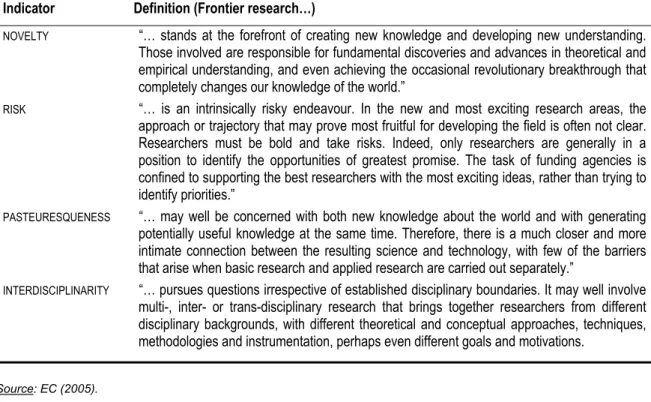
Table 3. Relation between the definition of frontier research and correspondence of indicators. Indicator Definition (Frontier research…)
NOVELTY “… stands at the forefront of creating new knowledge and developing new understanding. Those involved are responsible for fundamental discoveries and advances in theoretical and empirical understanding, and even achieving the occasional revolutionary breakthrough that completely changes our knowledge of the world.”
RISK “… is an intrinsically risky endeavour. In the new and most exciting research areas, the approach or trajectory that may prove most fruitful for developing the field is often not clear. Researchers must be bold and take risks. Indeed, only researchers are generally in a position to identify the opportunities of greatest promise. The task of funding agencies is confined to supporting the best researchers with the most exciting ideas, rather than trying to identify priorities.”
PASTEURESQUENESS “… may well be concerned with both new knowledge about the world and with generating
potentially useful knowledge at the same time. Therefore, there is a much closer and more intimate connection between the resulting science and technology, with few of the barriers that arise when basic research and applied research are carried out separately.”
INTERDISCIPLINARITY “… pursues questions irrespective of established disciplinary boundaries. It may well involve multi-, inter- or trans-disciplinary research that brings together researchers from different disciplinary backgrounds, with different theoretical and conceptual approaches, techniques, methodologies and instrumentation, perhaps even different goals and motivations.
Source: EC (2005).
Proposal reviews are carried out in two steps. 1) Individual panel member assess both the qualification of PI (Criteria-1) and originality of the proposal (Criteria-2), discuss jointly in panel meetings, score5 PI and proposal by at least three reviewers based on a scoring system6,
3
The clear distinction between basic and applied science has become blurred because new areas of science and technology often display substantial elements of both. Frontier research reflects that reality and calls for concentrated efforts on a more receptive attitude to unconventional thinking (ERC 2010).
4
In addition, a fourth domain ‘Interdisciplinary’ has been defined for cross-panel and cross-domain proposals.
5
SG, intellectual capacity to reach beyond the state of the art and creativity (achievements, publications); grant as contribution to establish independence or its consolidation; commitment (time in-residence, on project). AG, ground breaking nature of research, potential impact; interdisciplinarity; novel concepts; highly novel and/or unconventional methodologies justified by high gain/high reword balance); feasibility; recourses claimed justified added-value of team members.
6
and preliminary rank and eliminate low-ranking proposals. 2) Both panel members and remote referees individually assess Criteria-1,2 and the research environment6 (Criteria-3), and interview SG applicants; subsequently proposals are further discussed, scored and ranked, upon which chair meeting consolidate results across different panels and compose a final rank order. The ultimate outcome is a list of top ranks inside the year’s budget, next-in-rank (~50% of budget) pending and lower ranks above threshold with no chance of funding.
Defining frontier research and corresponding indicators
In response to the insight that the classical distinction between ‘basic’ and ‘applied’ research has ceased to exists, and that emerging areas of science and technology often embrace elements of both, a High Level Expert Group used the term “frontier research” to denote research that reaches beyond horizons of existing knowledge by being intrinsically risky endeavours without regard for established disciplinary boundaries. Table 3 cites key attributes of frontier research according to the Group’s report (European Commission 2005).
Figure 1. Core review process and corresponding indicators and the selection function.
Overall concept
The identification of frontier research through a combination of scientometric and text-mining methods is ambitious. The concept introduced here builds upon the understanding of the High Level Expert Group’s notion of frontier research. The relation between a sought quantitative model and the above definition is made transparent through the correspondence between each identified key attribute and its indicator as well as a selection function (Figure 1).
Although each indicator has a clear measurement function and subjective interpretation, it is insufficient to represent frontier research. A faithful representation is achieved in combination, which is implemented in form of a selection function. Clearly the notion of ‘revolutionary breakthrough’ (cf. Table 2) is practically inaccessible by scientometric and textual methods alone. Here two indicators capture different albeit related aspects of the research activity in question: the “timeliness” (one aspect of novelty) of the knowledge-base explicitly used by the author and the “proximity to emerging research topics” (another aspect of novelty) of the proposed research project inferred through the dynamic change of the scientific research landscape pertinent to this discipline.
In computing indicators, an initial step identifies from a corpus of grant application relevant scientometric (e.g., publications, citations, patents) and content data (e.g. text-strings, keywords) bearing relevance to frontier research, extracts and subjects them to data mining. This is essentially a filtering step to pre-process raw data of high quantity into input data of lower quantity but higher quality. In a subsequent step, actual indicators are automatically and robustly computed and subjected to a selection function for comparison between empirical and model parameter. Finally, cross-validation and iterative variation of thresholds, classification criteria, and metrics as well as expert feedback from panel members and chairs, refine in a last step the performance of the model to sufficiently high usability. The following sections describe indicators and selection function in more detail. For various reasons the comparison of proposals is only meaningful within one scientific discipline. Thus we obtain indicator values and apply the selection function for each discipline (panel) individually.
Indicators of frontier research
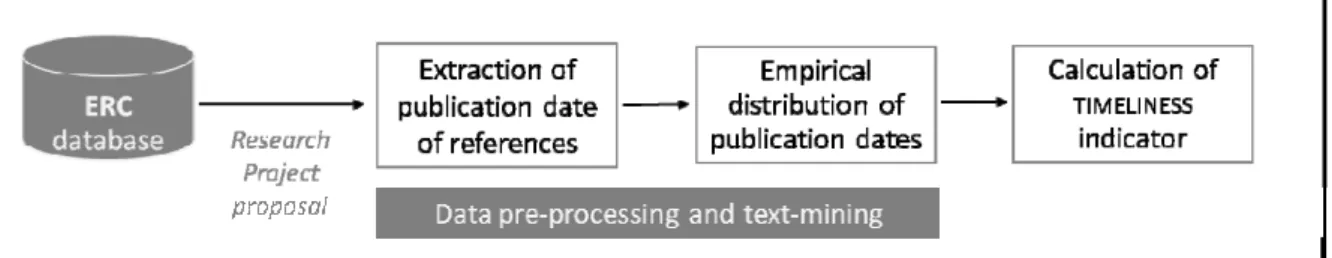
The indicator TIMELINESS illustrated in Figure 2 is used as a proxy to infer the “innovative degree” of the proposal through bibliographic references; somewhat similarly, it can be applied to the top-N listed self-citations of the author. The underlying hypothesis is that the more recent references are, the more likely the work is at the frontier of science. Therefore, the bibliometric concept focuses is on references and the time elapsed since the publication listed to validating a proposal, and TIMELINESS is obtained from the difference between the
times of proposal submission referenced publications.
Figure 2. The core bibliometric concept of the TIMELINESS indicator.
While there are alternative data sources, references of the proposal are considered appropriate because they constitute published documentation of highest velocity and directly relate to the research project. After identifying references and extracting publication dates in actual texts, the indicator can be calculated from the set of values: The simplest way to obtain TIMELINESS
is to use the arithmetic mean. In addition, because it may be influenced by statistical outliers, other statistics (e.g. mode or median of the distribution) are considered to quantify the distribution and re-sampling methods like bootstrapping are applied. Finally, it is tested whether TIMELINESS follows a known theoretical distribution (e.g. Poisson or negative
The indicator PROXIMITY illustrated in Figure 3 is used to infer the “innovativeness” of a
proposal. The more sophisticated bibliometric concept employs a “publication landscape” (represented by a cluster map of scientific resp. technological information and characterized by the level of change over time), in which it positions and assigns to each proposal a
PROXIMITY value in dependence to the distance and ranking of nearest clusters. The
underlying hypothesis is that the closer a proposal is to clusters of positive dynamic change, the more innovative it is.
Figure 3. The core bibliometric concept of the PROXIMITY indicator.
To this end, raw data are obtained from external bibliographic reference databases (for international scientific and technological literature) and ERC panel descriptions to identify and extract discriminating terminological information. A clustering algorithm is employed to obtain a cluster map that groups similar references (through related keywords) and represents the publication landscape corresponding to the considered panel. A diachronic analysis (Roche et al. 2008) is used to study the evolution of the landscape across two time windows, by considering the content of each cluster and its relative location in the network of clusters. Structural alterations of the network of clusters between the two time periods are identified and described: splitting or disappearing of clusters as well as persistence and emergence of clusters are investigated; as well cluster status changes (e.g. the evolution of a cluster the periphery toward a central position). In addition, techniques of association rule extraction are applied to complete the cluster evolution analysis (Mahgoub et al. 2008). The result is a ranking of clusters of the more recent map with respect to its dynamics and for each proposal the distance of a proposal to nearest clusters.
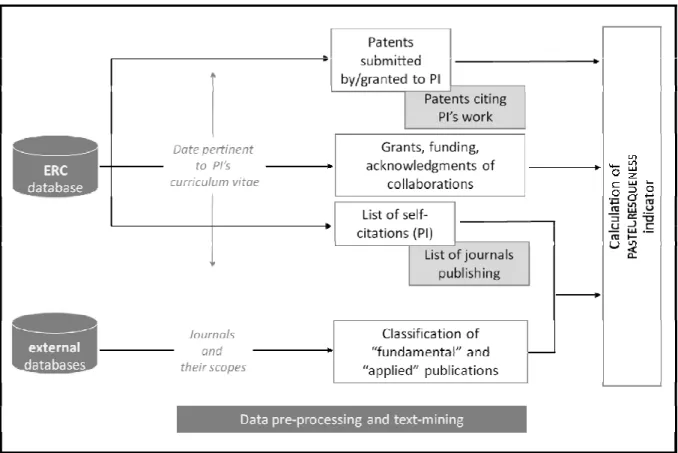
The indicator PASTEURESQUENESS illustrated in Figure 5 is used to infer the applicability of expected results of each proposal, by considering evidence for immediate or intended application. Input data are obtained from bibliographic and patent databases and proposals.
The term PASTEURESQUENESS
originates from the definition of Pasteur’s Quadrant (Stokes 1997), which describes scientific research/methods that seek both fundamental understanding and at the same time social benefit (cf. Figure 4).
PASTEURESQUENESS consists of in all three indicators: i) patents granted to the PI; ii) information related to business involvement; and iii) self-citations published in journals with prescribed ‘applicability’ (scoring function).
Figure 4. Illustration of the Pasteur Quadrant.
Figure 5. The core bibliometric concept of the PASTEURESQUENESS indicator.
The indicator RISK illustrated in Figure 6 is used to infer the “personal risk” of the PI in
executing the proposed research under the assumption that references (of proposals, papers) serve as one informative source for constructing a ‘bibliometric research profile’. In comparing the profile of a proposal to both past research by the PI and relevant research originating inside the same field, observed overlaps are used to categorize anticipated constant resp. aligned, modified or changed research directions.
On the first hand, one hypothesis is that the lower the overlap between two reference profiles (past vs. proposed research), the more risk-affine is the proposal for the PI, because it is indicative of a change from previous directions. On the other hand, another hypothesis is that the lower the overlap to all other ‘(field) profiles’, the more unique is the proposed research. The computation of RISK can be refined by “exotic terms” (rare keywords) in textual
information of the proposal; exotic in the sense that the terms are less frequently used than established terms in the same research area (Roche et al. 2010; Schiebel et al. 2010).
Figure 6. The core bibliometric concept of the RISK indicator.
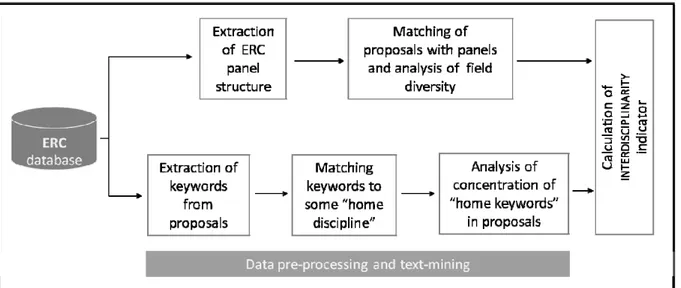
The indicator INTERDISCIPLINARITY illustrated in Figure 7 is used to infer self-consistently the
presence and proportions of characteristic terminology or textual traits, which “belong” to different ERC ‘(home) panels’, and thereby reveal the intra or inter-panel/disciplinary character of each proposal. It is build upon the assumption and previously successfully tested concept (Schiebel et al. 2010) that the frequency of occurrence and distribution of discipline specific keywords in scientific documents can be used to classify and characterize disciplines.
To this end, each keyword is labeled according to its statistical frequency of occurrence across all PE or LS panels, filter are applied to distinguish relevant from irrelevant (i.e. panel unspecific) keywords, and the concentration of keywords from different home panels is assessed to classify proposals as very high, medium-high, low-medium, or very low in concentration. In addition to free keywords extracted from textual information of proposals, the analysis is supplemented by using fixed keywords from the description of ERC panels.
Modelling the selection function
The indicators described above are expected to have a positive effect on the decision probability of a grant application, which has in principle three possible outcomes: Type-A) above threshold and funded, Type-B) above threshold and not funded, and Type-C) below threshold. Yet as there are a number of other possible factors influencing the peer review process, a statistical analysis (discrete choice model) determining the actual association between indicators and the funding decisions is carried out separately for SG and AG applications.
A discrete choice model is used to estimate how various exogenous factors (captured by the indicators, cf. Table 3) influence the probability for a project proposal to get accepted. Discrete choice models have come into wide-spread use in econometrics to represent discrete alternatives rather than a continuous measure of activity (Greene 2003). In a first attempt, the selection model assumes a binary choice (types A/B vs. C) as they are the two central outcomes of the dependent variable: the rejection or acceptance of a project proposal. To this end, the dependent variable takes the form (empirical data on the i = 1,2,…,n proposals):
1 0 otherwise. i proposal is accepted Y = ⎨⎧ ⎩
The decision probability of a proposal to be accepted, Pr(Yi = 1), depends on a set of independent, exogenous factors (indicators) summarized in a matrix X such that
, , Pr( 1) ( ) Pr( 0) 1 ( ) i i i i Y F Y F = = = = − X X β β , (2)
where Xi is a set of k observed factors for proposal i, β is the estimated k-by-1 parameter vector reflecting the impact of changes in Xi on the probability Pr(Yi = 1). It is common practice to define F by the logistic distribution function, leading to binary Logit model:
, , , exp Pr( 1) ( ) 1- exp i i i i Y = = Λ X = X X β β β . (3)
Technically, the parameter estimation is based on Maximum-Likelihood (cf. Greene 2003), and the interpretation in the context of the research question can be comfortably framed in terms of odds-ratios, which are given by exp(β) (cf. Johnston and DiNardo 2007).
Discussion
The above concept aims at developing quantitative methods for determining and examining the relationship between peer review and decisions on grant allocation in terms of attributes of frontier research:
• Can attributes of frontier research be represented and quantitatively to evaluate the grant allocation decision by bibliometric approaches?
The detailed development has focused on the ERC grant scheme (with data in 2007-2009), but the concept might be applicable more generally, depending on mission, review process and guidelines, attributes and correspondence of indicators for grant schemes. The implemented concept is intended to yield a bibliometric model in which indicators are expected to have a positive effect on the decision probability for ERC grant applications. Thus a follow up and specific question is:
• How well do bibliometric indicators and the decision probability discriminate between grant applicants accepted resp. rejected for funding?
In particular, instead of relying on performance measures the concept builds on a combination of content analysis and data-mining in combination with scientometric methods. The concept presents a new approach in that it explicitly utilizes information present in research proposals submitted to a grant agency and relates this information to the bulk of information drawn from activities of the larger research community in a specific field. To this end, textual information (e.g. keywords and longer strings extracted from proposals) as well as references (e.g. papers or patents) are combined using, e.g., human expert systems, clustering techniques, relational mapping, networks, bibliometric functions, various indices and data filtering techniques.
Described indicators and selection function are currently implemented. First ex post analyses between model and review process can be expected a mixture of similarity between peer reviewer selection (i.e. Types-A/B) and dissimilarity (i.e. type C). Depending on the found correlation between the discrimination of types A/B vs. C obtained from the bibliometric model and selection by peer review, numerical algorithms for the computation of indicators might need refinement, resulting in a modification of the model, or improvements of the future operation of the peer review process can be envisioned. In any case, it requires careful investigation (statistical independence, positive vs. negative correlation, outliers), explicit differentiation between measurement concept and interpretation, and careful feedback on parameters on a discipline-specific basis. In order to serve its purpose, the development and refinement will be hand-in-hand with experts involved in the review process to determine what the metrics could be used for and how it is affecting the review process.
Ultimately the concept shall result in a methodology that allows the grant agency to monitor the operation of the peer review process from a bibliometric perspective and thereby provide a basis for the further refinement of the peer review process, including the ex ante bibliometric evaluation of future grant applications to support reviewers with orientation knowledge for the review assessment.
Acknowledgments
The authors acknowledge the support that this work was partially funded by the Ideas specific programme of the EU’s FP7 Framework Programme for Research and Technological Development (project reference no. 240765). The authors thank Helga Nowotny and Jens Hemmelskamp of the ERC for stimulating discussions, and Manuela Kienegger for time and energy in drafting the manuscript.
References
Bornmann, L. & Daniel, H.-D. (2008). The effectiveness of the peer review process: Inter-referee agreement and predictive validity of manuscript refereeing at Angewandte Chemie. Angewandte Chemie International
Edition, 47, pp. 7173-7178.
ERC – European Research Council (2010). ERC Grant Schemes Guide for Peer Reviewers Applicable to the ERC. Starting Grants and Advanced Grants (Work-Programme 2011). Updated September 2010. Retrieved January 7, 2011 from http://erc.europa.eu/pdf/Guide_ERC_Peer_Reviewers_2011.pdf.
ERC – European Research Council (2011). Facts & Figures. Retrieved January 7, 2011 from: http://erc.europa.eu/index.cfm?fuseaction=page.display&topicID=165.
EC – European Commission (2005). Frontier research: The European Challenge. High Level Expert Group Report, EUR 21619.
Greene, W. H. (2003). Econometric analysis. Fifth Edition. Prentice Hall, Upper Saddle River (NJ). Hojat, M., Gonnella, J.S. & Caelleigh, A.S. (2003). Impartial judgment by the ”gatekeepers” of science:
Fallibility & accountability in the peer review process. Advances in Health Sciences Education, 8, pp. 75-96. Johnston, J. & Dinardo, J. (2007). Econometric methods. Fourth Edition, New York, McGraw-Hill.
Marsh, H.W., Jayasinghe, U.W. & Bond, N.W. (2008). Improving the peer-review process for grant applications - Reliability, validity, bias, and generalizability. American Psychologist, 63, pp. 160-8.
Nederhof A.J. (2006). Bibliometric monitoring of research performance in the Social Sciences and the Humanities: A review. Scientometrics, 66, 81–100.
Roche, I., Besagni, D., Francois, C., Hörlesberger, M. & Schiebel, E. (2010) Identification and characterisation of technological topics in the field of Molecular Biology. Scientometrics, 82, pp. 663-676.
Schiebel, E., Hörlesberger, M., Roche, I., Francois, C., & Besagni, D. (2010). An advanced diffusion model to identify emergent research issues: the case of optoelectronic devices. Scientometrics, online; DOI
10.1007/s11192-009-0137-4.
Stokes, D.E. (1997). Pasteur’s Quadrant. Basic Science and Technological Innovation. The Brookings Institution Press.
Sweitzer, B.J. & Collen, D.J. (1994). How well does a journal's peer review process function? JAMA-Journal of
the American Medical Association, 272, pp. 152-153.
Antonoyianakis, M., Hemmelskamp, J. & Kafatos, F.C. (2009). The European Research Council Takes Flight.
Cell, 136, pp. 805-809.
Powell, K. (2010). Making the Cut. Nature, 467, pp. 383-385.
Ariely, D. (2010). You are what you measure. Harvard Business Review, 6, 38.
Yoon, B., Lee, S., & Lee, G. (2010). Development and application of a keyword-based knowledge map for effective research. Scientometrics, 85, pp. 803-820.
Bornmann, L., Leydesdorff, L., & Besselaar, P.v.d. (2009). Journal of Informetrics, Journal of Informetrics, 4, pp. 211-220.
Besselar, P.v.d. & Leydesdorff, L. (2009). Past performance, peer review and project selection: a case study in the social and ehavioral sciences. Research Evaluation, 18, pp. 273-288.
Juznic, P., Peclin, S., Zaucer, M., Mandelj, T., Pusnik, M., & Demsar, F. (2010). Scientometric indicators: peer-review, bibliometric methods and conflict of interest. S Scientometrics, 85, pp. 429-441.
Bornmann, L. (2011). Scientific peer review. Annual Review of Information Science and Technology, 45, pp. 199-245.
Nederhof, A.J. (2006). Bibliometric monitoring of research performance in the social sciences and the humanities: A review. Scientometrics, 66, pp. 81-100.
Haindl, M (2010). Scientometry leading us astray. ERCIM News, 82, p. 8. Norden, R.v. (2010). A profusion of measures. Nature, 465, pp. 864-865.
Mahgoub, H., Rösner, D., Ismaol, N. & Torkey, F. (2008). A text mining technique using association rules extraction. International Journal of Computational Intelligence, 4, pp. 21-28.