HAL Id: pastel-00914013
https://pastel.archives-ouvertes.fr/pastel-00914013
Submitted on 4 Dec 2013HAL is a multi-disciplinary open access archive for the deposit and dissemination of sci-entific research documents, whether they are pub-lished or not. The documents may come from teaching and research institutions in France or abroad, or from public or private research centers.
L’archive ouverte pluridisciplinaire HAL, est destinée au dépôt et à la diffusion de documents scientifiques de niveau recherche, publiés ou non, émanant des établissements d’enseignement et de recherche français ou étrangers, des laboratoires publics ou privés.
Structural Study of eIF Complexes by H/D Exchange
FT-ICR Mass Spectrometry
Jianqing Wu
To cite this version:
Jianqing Wu. Structural Study of eIF Complexes by H/D Exchange FT-ICR Mass Spectrometry. Analytical chemistry. Ecole Polytechnique X, 2013. English. �pastel-00914013�
THESE
présentée pour obtenir le grade de
DOCTEUR DE L’ÉCOLE POLYTECHNIQUE Spécialité : Chimie
Par
Jianqing WU
Structures de complexes d'initiation de la traduction étudiée
par échanges isotopiques couplés à la spectrométrie de masse FT-ICR
Directeur de thèse : Guillaume van der Rest
Soutenue le 27 septembre 2013 devant la commission d‟Examen composée de:
Pr. Thomas J.D. Jørgensen Rapporteur
Dr. Martine Cadène Rapporteur
Dr. Delphine Pflieger Examinateur
Dr. Emmanuelle Schmitt Co-directrice de thèse
工欲善其事,必先利其器
孔子,《论语·卫灵公》
He that would perfect his work must first sharpen his tools.
Confucious, AnalectsAcknowledgement
I would first like to thank Dr. Gilles Ohanessian, director of the laboratoire des Mécanismes Réactionnels, for the opportunity to work in this laboratory and complete the study of this thesis.
My deepest gratitude goes to Prof. Guillaume van der Rest, my thesis supervisor. What is important that I learned from you is not only the chemistry and biology written in this thesis, but the philosophy of scientific research from and beyond our day-to-day discussions which I will always benefit.
In addition, I shall truly thank Dr. Emmanuelle Schmitt, my co-supervisor, whose instructions and inspirations from the biochemistry aspect are essential for this work. Thanks
Pierre-Damien for instructing me the biochemistry experiments as well as helping me with the
protein 3D models. I indeed appreciate your knowledge, kindness and patience. My gratitude also goes to Dr. Yves Méchulam, director of the laboratoire Biochemie for your supports during the experiments and fruitful discussions.
I would also like to thank Edith, who has always been patient and optimistic helping me with the difficulties of the instruments and experiments. Without you, my experiments would never be finished within three years.
A lot of thanks to those with whom we shared the same office: Ophélie, Yasmine, Jingjing,
Jana, Christian, Joe, Yannick, Aziz and Florian. It has always been a pleasure working and
talking with you, during which I did improve my French a lot! Besides I shall specially thank Renjie, who was like my elder sister in DCMR taking warm care of me when she was a PhD student in the same laboratory.
My heartful thanks also go to all the staff, researchers (or former researchers) and students in DCMR, to Thérèse, Julia, Gilles, Carine, Guy, Sophie, Stephane, Michel, Christophe, Julien,
Vanessa, Manjeet… You have made this three years in DCMR a memory that I will cherish
forever in my life. I wish you all the best for the future.
I appreciate, as well, the helps from the Proteomics Platform in Pasteur Institute on the MS/MS experiments, which were critical to a major part of this work.
My gratitude also goes to Prof. Thomas J.D. Jørgensen and Dr. Martine Cadène for reviewing my thesis, and to Dr. Delphine Pflieger for evaluating my work and being my thesis committee member.
I shall also express my gratitude to my family and friends --
My parents, no matter where I am or what decisions I make, you are there for me. There are never enough words to describe how much you support me and how grateful I am. I am the luckiest girl in the world because I am your daughter.
My family, your love is the harbour of my heart. Even though many of you know nothing about my work, you have always been encouraging and supporting me to pursue the achievement of this thesis.
My boyfriend, Fanji, I have always expected a relationship with love, respect, fun and full supports, and we are having it now.
My dear Friend, Xin, whom I respect as a scientist and as a person. The time in Ecole Polytechnique with you will remain a page of joy in my life. My friends Lili, Zheng, Zhibo, Zixian, Xue, Jie, Shiguang, Songzhe, Ling, Xianzhou, Yizhou…You are my family here. I wish you all a bright future.
同样也要感谢我的家人和朋友们—— 我的父母,无论我人在何方,所往何处,你们都在我的身边。父母之恩,言语不可表 其万一。只能说生为你们的女儿,是我的最大幸运。 我的家人,你们的爱就如同我心的港湾。虽然你们并不一定了解我的工作,但从未停 止过对我学业的支持与鼓励。 我的男友,孟凡济,我期望的是充满爱,尊重,快乐与互相支持的感情,正如我们的 感情。 我可爱的朋友,钱欣,无论作为一名科研工作者还是作为一个独立的人,你都让我敬 佩。与你在巴黎综合理工度过的这段日子,在我人生中留下了美好的一页。我的朋友 们,鲁黎黎,瞿铮,刘志博,蒋子贤,陈雪,杨杰,李士广,韩嵩哲,覃岭,白显洲, 刘一周,你们就如同我在法国的家人。岂曰无衣,与子同袍。愿大家都有如意的未来。 谢谢大家。
List of abbrevations
3D: three -dimensional
AA: amino acid
aMb: apo-myoglobin
AP-MS: affinity purification mass spectrometry
ATP: adenosine-5'-triphosphate
CID: collision-induced dissociation
CsmA: chlorosome protein A
CTD: C-terminal domain
CX-MS: chemical cross-linking mass spectrometry
DMF: dimethylformamide
ECD: electron capture dissociation
eIF: eukaryotic initiation factor
EM: electromicroscopy
ESI: electrospray ionization
ETD: electron transfer dissociation
FAB: fast atom bombardment
FMO protein: Fenna–Matthews–Olson protein
FT-ICR: fourier transform ion cyclotron resonance
GDP: guanosine diphosphate
GTP: guanosine-5'-triphosphate
HDX-MS: hydrogen/deuterium exchange mass spectrometry
HPLC: high performance liquid chromatography
IM: ion mobility
IRES: internal ribosome entry site
MALDI: matrix-assisted laser desorption ionization
Met-tRNAiMet: initiator methionyl tRNA charged with methionine
MFC: multi-initiation factor complex
mRNA: messenger ribonucleic acid
MS: mass spectrometry
MSP1D1: membrane scaffold protein 1D1
NH: amide hydrogen
NMP: N-methylpyrrolidone
NMR: nuclear magnetic resonance
NTD: N-terminal domain
PABP: poly(A)-binding protein
PIC: pre-initiation complex
PTM: post-translational modification
RNA: ribonucleic acid
SAXS: Small-angle X-ray scattering
SFC: supercritical fluid chromatography
TAP: tandem affinity purification
Content
General Introduction ... 1
Part I Introduction ... 7
Chapter 1 Structural analysis of protein complexes by MS ... 9
1 The structure of proteins ... 12
1.1 The secondary structure: α-helix, β-sheet and motif ... 12
1.2 The tertiary structure: protein folding process ... 13
1.3 The quaternary structure: protein complex and assembly ... 14
2 Probing protein structure by mass spectrometry ... 14
2.1 AP-MS ... 14
2.2 Native MS ... 15
2.3 Chemical cross-linking MS ... 17
2.4 Labeling techniques ... 17
2.5 Perspectives of combining the structural MS strategies ... 18
3 Hydrogen/deuterium exchange ... 18
3.1 Brief history of HDX studies ... 18
3.2 General principle of hydrogen exchange ... 19
3.2.1 The exchange of free-exposed hydrogens ... 19
3.2.2 The exchange of amide hydrogen ... 22
3.3 Incorporation of deuterons: labeling strategies ... 24
3.3.1 Continuous labeling ... 24 3.3.2 Pulse labeling ... 25 3.4 Measuring the HDX ... 26 3.4.1 Bottom-up approach ... 28 3.4.1.1 Back exchange ... 28 3.4.1.2 Choice of protease ... 29 3.4.1.3 Chromatography ... 30 3.4.2 Top-down approach ... 31
3.4.3 Mass measurement and data processing ... 32
3.5 Application of HDX-MS in protein structural studies ... 33
3.5.1 Protein folding ... 33
3.5.2 Protein interactions ... 34
3.5.3 Aid in structure elucidation and crystal production ... 36
3.5.4 Quality control ... 36
3.6 The on-going improvements and perspectives for HDX-MS ... 36
3.6.1 Automated experimental work-flow and data processing ... 37
3.6.3 High performance mass spectrometer ... 39
4 HDX vs. other structural tools ... 41
References ... 43
Chapter 2 The eIF3 complexes: functions, structure, production and purification ... 49
1 Pathway of eukaryotic translation initiation ... 51
2 The role of eIF3 in translation initiation ... 52
3 The structure of eIF3 ... 53
3.1 MS revealed the overall interaction network of human eIF3 ... 54
3.2 The atomic structure of yeast eIF3i:b(654-700) ... 56
4 Synthesis and purification of proteins of interest ... 59
References ... 62
Part II Results ... 65
Chapter 3 Method development in the bottom-up HDX approach ... 67
1 Initial workflow of HDX experiments and data processing steps ... 69
1.1 The HDX-MS experiments ... 69
1.2 Initial data processing workflow ... 70
1.2.1 Retention time correction ... 71
1.2.2 Establishment of the peptide reference list ... 72
1.2.3 Peak assignment for deuterated peptides ... 74
1.2.4 Calculation of deuteration level and kinetics plotting ... 77
2 Method improvements in the establishment of peptide reference list ... 77
2.1 Insufficiency of mass accuracy for peptic peptide identification ... 78
2.2 Pepsin specificity as another approach for peptic peptide identification ... 80
2.2.1 Probability of occurrence of a peptide ... 80
2.2.2 POc filter and mass error filter ... 83
2.2.3 Resolving ambiguous assignments ... 85
2.2.4 Reproducibility control ... 87
2.2.5 Method validation by MS/MS and evaluation ... 87
3 Method improvements in the processing of deuterated sample data ... 92
3.1 Mass recalibration ... 92
3.2 Program upgrades for peak assignments of deuterated samples ... 92
References ... 94
Chapter 4 HDX analysis of the eIF3 complexes ... 95
1 Peptide selection, centroid mass verification and deuteration level calculation for deuterated samples ... 97
2 The eIF3i monomer and complexes of eIF3i:bC3 and eIF3i:gC1ΔC ... 102
2.1 HDX of eIF3i monomer ... 102
2.2 HDX of eIF3i in complex with eIF3bC3 ... 106
2.3 HDX of eIF3i in complex with eIF3gC1ΔC ... 118
2.4 Discussion ... 127
References ... 129
Part III Methods ... 131
Chapter 5 Materials and methods ... 133
1 NanoLC system in HDX-MS ... 135
2 FT-ICR MS ... 137
2.1 The principles of FT-ICR MS ... 138
2.2 Factors ensuring the high performance of FT-ICR MS ... 140
2.3 The evolution of instruments during this work ... 141
2.3.1 APEX III ... 141
2.3.2 APEX Q ... 142
2.3.3 SolariX ... 142
3 Experimental protocols ... 144
3.1 Protein production and purification ... 144
3.1.1 Production of eIF3i, eIF3bC3 and eIF3gC1ΔC ... 144
3.1.2 Protein purification ... 145
3.1.3 Complex purification ... 146
3.1.4 Protein storage ... 146
3.2 Hydrogen/deuterium exchange reaction ... 146
3.3 NanoLC-MS ... 146
3.4 LC-MS/MS ... 148
References ... 150
Mass spectrometry has entered the biology and biochemistry laboratories since the end of the 1980’s with the introduction of MALDI and ESI as powerful ionization sources. These ion sources provided instruments with ability to produce ions of biological molecules with high efficiency, and thus allowed the analysis of high molecular weight biomolecules. The most routinely used technique relies on the measurement of the mass of peptides within a peptide digest, allowing efficient identification of proteins, provided a protein or genomic database is available. The peptide sequencing capabilities provided by MS/MS instruments allows the gain of sequence information on t hese peptides which can then be used to confirm identification, even in complex situations such as in the presence of protein post-translational modifications (PTM analysis). But these “soft” ionization techniques have also been shown to allow resolving large intact macromolecular assemblies, including large protein complexes. Thus mass spectrometry can be used as a tool not only for protein identification and characterization but also for protein structure analysis. The major advantage of mass spectrometry in this area relies on the extreme sensitivity of the mass measurements: although it is s destructive technique, only minute quantities (on the order of 10 atomoles) of biological material are required to perform an analysis on t he most sensitive instruments currently available.
Another major advance in mass spectrometry has been the huge increase in mass resolving power and mass accuracy. Prior to the 2000, only FT-ICR instruments could provide routine resolutions over 100 000 and mass accuracy on the order of 1 ppm. The development of the Orbitrap™ mass analyser by Thermo has been a major breakthrough, allowing high mass accuracy and high resolution for much less cumbersome instruments. Currently, ESI-TOF analyzers are also in constant progress and mass accuracies on t he order of 1 ppm are routinely achieved on a range of instruments. It is thus of interest to develop techniques that make use of established protocols but also include increased mass accuracy and high resolution in the protocol.
The development of improved techniques is not a goal in itself, and a mass spectrometry technique has to demonstrate its problem-solving capabilities to be widely used. Thus this thesis has also relied on attempts to gain insights in a major pathway in biology, protein synthesis. The initial aim was to focus on eIF3, one of the protein complexes involved in translation initiation: translation initiation involves a number (on the order of 10 for simple eukaryotic systems) protein complexes which interact together in a w ell-orchestrated molecular machinery, opening the way for efficient and accurate expression of proteins from
the mRNA. The eIF3 complex is itself a heteromultimeric protein complex, comprised of 5 stoechiometric units in the budding yeast Saccharomyces cerevisiae and on the order of 13 subunits in Homo sapiens. The crystal structure of this large (around 300 kDa) complex is not known yet, and only partial information is available on t he assembly of subunits together. Even the contact regions between some subunits remains to be solved, and this seemed a good system on which to apply the mass spectrometry methods based on the measurement of amide H/D exchange (HDX) as developed in the DCMR group at the Ecole Polytechnique in the past years.
Thus this manuscript is organized to reflect the major advances undergone in the course of this three year work. In a first introductive part, a summary the key problems tackled in this thesis are presented. In a first chapter, the current status on the uses of mass spectrometry for protein complex analysis is reviewed. A focus is put on the HDX methods, which represent the core of the work presented in this thesis. The standard protocol is presented and discussed and recent developments, including the uses fragmentation techniques to gather improved resolution on site-specific exchange rate constants will be surveyed. In a second chapter, a review of the literature concerning the eukaryotic translation initiation factor is done. This review puts in perspective the current work with both prior knowledge, and also advances that occurred in the course of the thesis, including a crystal structure of partial domains which are very close to one of the systems that has been studied in the course of this work. Finally, the chapter will focus on the experimental procedures for the production of the protein complexes used in this work.
In a second part, the experimental results gathered throughout this work will be presented. This part is itself separated in two. Chapter 3 deals with the methodological developments that have been required to increase the size of complexes that could be addressed. As will be shown, the increase in size of the protein complexes made that mass accuracy alone was not sufficient to correctly assign each isotope distribution to a single peptide. In these conditions, the standard procedure would have been inclusion of an MS/MS step to validate individually each peptide. But after a change in instrumentation, we noticed that on the newer mass spectrometers, sensitivity gains led to the detection of a vastly increased number of peptides. Individual validation of each of these peptides was a tough task, and we sought alternatives to the MS/MS validation step. The major limitation arises from the lack of specificity of pepsin in conditions used for HDX mass spectrometry. But using prior work of another group, we
termed “Probability of occurrence” (POc). Combining this score with high mass accuracy, it seemed possible to correctly assign peptides without requiring MS/MS validation. Of course, in order to demonstrate the validity of this POc scoring system, a thorough comparison of datasets with the MS/MS reference method has been performed, and showed very few instances for which the POc / accurate mass combination led to falsely assigned peptides. As a consequence of this method, it should also be noted that not requiring MS/MS validation allows inclusion of a much larger number of peptides within the reference dataset: as noticed in this work as well as in earlier work, pepsin digest peptides do not necessarily fragment as well in collision induced dissociation conditions as the more common tryptic peptides usually present in proteomics studies. Thus a number of peptides are present in the sample but are not taken into account when an MS/MS validation step is required because their fragmentation results are not sufficient to meet the validation criteria.
In addition to this central technical development, this chapter will also deal with other improvements that have been performed on the processing of the data. The huge datasets that are obtained from nano-LC/FT-ICR MS cannot be manually processed. An in-house developed software has been used to automate the task of spectrum analysis as much as possible. The whole workflow is described and the critical steps which still require manual intervention of the scientist are identified and the limitation of automation for these steps will be discussed in this chapter.
Chapter 4 is devoted to the biological results achieved in the course of this thesis on the eIF3 subunits interaction domain. The first system which will be discussed is the eIF3i:bC3 interaction region. In 2012, a crystal structure of this binding region was obtained while HDX MS data was acquired in our group. Although a bit disappointing since we expected to be able to determine the interaction region based on HDX MS measurements, this comparison structure allows a good critical discussion on the HDX results for this system. Furthermore, this crystal structure also helped a lot in providing a first proposed structure for the eIF3i subunit. The existence of this structure helped a lot in the discussion of the results for the other system which was explored in this thesis, the eIF3i:gC1ΔC binding region, which will constitute the second part of this chapter. Unfortunately, at the time of writing this manuscript, only preliminary results are available on the eIF3i:b:g ternary complex: thus only a sketch of the global interaction region between the three subunits will be presented in this manuscript.
In a final part, the manuscript will present a complete material and methods section. It must be pointed out that in the course of this work, the auther had the opportunity to work in close collaboration with two groups: in the biochemistry laboratory (Laboratoire de Biochimie), all the steps required for obtaining the biological samples were performed, which included protein expression, purification, production and purification of the protein complexes. In the mass spectrometry laboratory (Labratoire des Mécanismes Réactionnels), the HDX kinetics as well as the mass spectrometry analysis and data processing were performed. This leads to a very complete work, and all the relevant protocols as well as the technical details are provided in this manuscript.
Part I
Chapter 1
Structural analysis of protein
complexes by MS
1 The structure of proteins ... 12
1.1 The secondary structure: α-helix, β-sheet and motif ... 12
1.2 The tertiary structure: protein folding process... 13
1.3 The quaternary structure: protein complex and assembly ... 14
2 Probing protein structure by mass spectrometry ... 14
2.1 AP-MS ... 14
2.2 Native MS ... 15
2.3 Chemical cross-linking MS ... 17
2.4 Labeling techniques ... 17
2.5 Perspectives of combining the structural MS strategies ... 18
3 Hydrogen/deuterium exchange ... 18
3.1 Brief history of HDX studies ... 18
3.2 General principle of hydrogen exchange ... 19
3.2.1 The exchange of free-exposed hydrogens ... 19
3.2.2 The exchange of amide hydrogen ... 22
3.3 Incorporation of deuterons: labeling strategies... 24
3.3.1 Continuous labeling ... 24 3.3.2 Pulse labeling ... 25 3.4 Measuring the HDX ... 26 3.4.1 Bottom-up approach ... 28 3.4.1.1 Back exchange ... 28 3.4.1.2 Choice of protease ... 29 3.4.1.3 Chromatography ... 30 3.4.2 Top-down approach ... 31
3.4.3 Mass measurement and data processing ... 32
3.5 Application of HDX-MS in protein structural studies ... 33
3.5.1 Protein folding ... 33
3.5.2 Protein interactions ... 34
3.5.3 Aid in structure elucidation and crystal production ... 36
3.5.4 Quality control ... 36
3.6 The on-going improvements and perspectives for HDX-MS ... 36
3.6.1 Automated experimental work-flow and data processing ... 37
3.6.2 Combining the bottom-up and top-down approach ... 38
3.6.3 High performance mass spectrometer ... 39
4 HDX vs. other structural tools ... 41
Before the development of the so-called “soft-ionization” techniques, mass spectrometry (MS) was used exclusively in the field of small molecules for the elucidation of unknown molecular composition. When it comes to the late 1980s, the development of “soft” electrospray ionization (ESI) and matrix assisted laser desorption/ionization (MALDI) techniques opened the door of biological MS, as bio-macromolecules can be transferred into the gas phase as intact ions, thereby making them amenable to detection by different types of mass analyzers. [1-4] Since then, mass spectrometry has been an indispensible tool in the development of proteomics study. According to the introductory book of Proteomics, [5] five categories of experiments can be considered as applied MS in proteomics: (1) protein identification, (2) protein quantitation or differential analysis, (3) post-translational modifications (PTMs), (4) protein-protein interactions, and (5) structural proteomics.
Among all the above aspects, MS is most commonly known for its capacity to identify proteins and monitor post-translational modifications (PTMs). Thanks to the large amount of protein sequence data available, the identification of several thousand proteins in a single study can nowadays be achieved upon a database search using the MS and MS/MS data from tryptic (or other protease) peptides. When this technology is applied carefully and correctly, the rapid, accurate, sensitive and reproducible characters that modern MS has shown in protein identification make it accepted as the routine method for such topics, and bring the broad expectations to generate high-coverage to complete proteome maps. [5-7] In the PTMs strategies, types and sites of modifications are identifiable for single or multiple protein(s). While typical bottom-up approach has been the most widespread method for standard PTMs study, complementary methods are also introduced with interesting performances. Top-down approach, though they require more advanced instrumentation and data processing software, can provide a more comprehensive overview of the protein sequence and the PTM pattern, where as middle-down approach that uses proteases cleaving less frequently-occurring amino acid residues to generate long peptides (5-6 kDa) has attracted increasing interests as it is particularly suitable to focus on regions in which major modifications reside. [8-9] With the still undergoing developments of these methods, the proteomic-scale study on PTMs and PTMs changes in biological processes has started to grow.
This work, on the other hand, focuses on another domain of proteomics studies, namely the structural proteomics. This involves the fundamental structure determination of proteins, as well as the dynamics and structural changes that proteins may undergo due to different
factors, e.g. the interaction with ligands, other proteins, the conformational changes during various physiological processes, etc.
1 The structure of proteins
Proteins are extremely complex molecules. Biochemists define the protein structure into several levels (Figure 1): primary structure refers to the amino acid (AA) sequence that forms the polypeptide. As the peptide chain folds, it forms certain localized arrangements of adjacent (but not necessarily contiguous) AAs that constitute secondary structure. The three-dimensional (3D) shape that the peptide chain assumes is termed the tertiary structure. When consisting of more than one polypeptide chains the protein has a quaternary structure. [10]
Figure 1 Brief illustration of 4-level protein structures. [11]
1.1 The secondary structure: α-helix, β-sheet and motif
In the secondary structure of proteins, peptide chains can fold into several repeating patterns. The most widely observed patterns are the α-helix and the β-pleated sheet. Both of them are
stabilized by localized hydrogen bonding between the carbonyl and N-H groups in the peptide backbone.
The α-helix is a rigid, rodlike structure that forms when a polypeptide chain twists into a right-handed helical conformation. Hydrogen bonds form between each N-H of amide group and the carbonyl group of the amino acid four residues away, while side chains extend outward of the helix. Each turn in the helix consists of 3.6 residues and the distance between the same positions of two turns is 0.54 nm.
β-sheets are formed when two or more peptide chains line up side by side, with each chain segment termed as β-strand. The stabilizing hydrogen bonds form between the backbone amide N-Hs and the carbonyl groups in the adjacent chains. β-sheets can be either parallel, with both chains N-C oriented in the same direction, or anti-parallel with the two chains oriented heads to tail.
Combinations of several α-helix(es) and the β-pleated sheet(s) structures form the so-called supersecondary structures or motifs, e.g. the βαβ unit with two parallel β-sheets connected by an α-helix, or the β-meander unit with two or more consecutive antiparallel β-sheets linked together by direction-reversed hairpin loops. These structures are usually stabilized by hydrophobic interaction involving the side chains.
1.2 The tertiary structure: protein folding process
As globular proteins fold into their unique native structures and prosthetic groups, if any, are inserted, they assume the tertiary structure. The formation process, protein folding, makes highly organized structures out of nascent polypeptides. This process occurs as a consequence of the interactions between the AAs side chains. Main interactions that stabilize tertiary structure include: 1) hydrophobic interactions, when hydrophobic side chains are brought closer as they are excluded from water, while highly ordered water molecules are released from the interior of the tertiary structure. Yet a few water molecules may remain within the core of the folded protein and form up to 4 h ydrogen bonds with the peptide backbones and increase the flexibility of some of the internal interactions, which may be crucial in the binding of ligands. 2) electrostatic interactions, involving the strong interactions between ionic groups of opposite charge (salt bridges) in water-free regions, and weak interactions between ion-dipole, dipole-dipole, etc. These interactions can be significant in holding the interiors of the tertiary structure, as well as contributing to the interactions of the
subunits/ligands in the quaternary structure, as will be discussed later. 3) hydrogen bonds, which is not only the stabilization factor in the secondary structure, but also important and often observed in the interior and surface of the globular proteins. 4) covalent bonds, most prominently the disulfide bridges in many extracellular proteins, are significant in protecting proteins from adverse changes in pH or salt concentrations. 5) hydration, i.e. the dynamic hydration shells formed around the tertiary structures.
1.3 The quaternary structure: protein complex and assembly
A lot of proteins, especially those with high molecular weights, contain more than one polypeptide chains (subunits), and these subunits can be either identical or different. The quaternary structures, similar to the tertiary structures, are stabilized either by noncovalent interactions such as the hydrophobic effect, electrostatic interactions and hydrogen bonds, or by covalent cross-links such as disulfide bridges. It is worth noticing that the assembling of subunits is often triggered by a conformational change that is affected by the binding of ligands, and such conformational change is called allosteric transition.
2 Probing protein structure by mass spectrometry
Protein structures, as well as the formation and transition of protein structures, are essential to the understanding of various protein functions and metabolic processes. Proteins expressed in living organisms mostly function in the form of protein complexes, which are further organized in protein interaction networks in the living cell. [12] In order to understand the function of a protein, it is of great importance to obtain comprehensive knowledge of its structure and dynamics on the molecular level and preferably in its native state, i.e. in the solution phase, in a medium close to the cellular content. Structural MS has drawn increasing attentions and shown great successes on t hese topics since the introduction of ion sources adapted for biomolecules. Typical structural MS techniques includes affinity purification mass spectrometry (AP-MS), chemical cross-linking mass spectrometry (CX-MS), MS of intact assemblies (native MS), and labeling techniques such as hydroxyl radical labeling and hydrogen/deuterium exchange mass spectrometry (HDX-MS).
2.1 AP-MS
AP-MS uses the affinity purification technique, one that has been commonly applied by biochemists. In AP, the protein of interest and its associated interactors are selectively
purified using either antibodies targeted towards this protein or an affinity tag introduced in the protein of interest. After pull down the proteins present are then analyzed and identified by proteomics-based MS (Figure 2 D). [13-15] Using AP-MS, it is therefore possible to investigate the connectivity within a complex or establish whole protein interaction networks. AP-MS is nowadays probably the method of choice when looking at protein-protein interactions on a global scale. With the application of the powerful tandem affinity purification (TAP) protocols and the integration of other strategies such as quantitative interaction proteomics, elegant works have been reported on s olving large-scale protein network architecture, for example the stoichiometry and architecture of the cullin-RING ubiquitin ligase network was revealed by a study which combined AP-MS with multiplex absolute quantification technology. [16]
2.2 Native MS
In native MS, intact complexes of up t o several MDa are no l onger hydrolyzed as in conventional MS-based proteomics studies, but directly ionized and analyzed by mass spectrometry (Figure 2 E). By careful manipulation of the experimental conditions of pressure and accelerating voltages, the target protein assembly can be ionized in the intact form as a whole without dissociation in the travel through the instrument. [12, 17-18] The overall stoichiometry is the initial information obtainable from the native MS, yet the connectivity of the different subunits are also important information achievable when partial dissociation is performed in controlled conditions. Native MS is often combined with proteomics MS to identify each of the subunits in the assembly, ion mobility to understand the topological structure of the global complex, and modeling approaches to stitch together information obtained through various techniques, and has shown powerful ability in a number of complicated topics, including studies of notoriously difficult targets such as membrane proteins, [19-20] and investigations of ligand binding processes such as the report of bound lipids and the effects of nucleotide binding of ATPases. [21]
Figure 2 Selected mass spectrometry based methods for structural biology. (A) Purification of a protein complex by a biochemical approach. (B-C) Chemical cross-linking MS (CX-MS) workflow. (D) Affinity purification coupled to MS (AP-MS) workflow. (E) Native MS workflow. (F) Integration of diverse structural data by computational modeling. Thereby a model (or an ensemble of models) is searched that satisfies the structural data. [12]
2.3 Chemical cross-linking MS
Chemical cross-linking MS (Figure 2 B, C) is based on the fact that in proteins or protein complexes, amino acid residues in spatial proximity (20-30 Å) can be physically connected by covalent bonds via a cross-linking reagent. Target proteins or protein complexes are chemically cross-linked in solution under near-physiological conditions, enzymatically hydrolyzed to peptides, and the resulting peptides are analyzed by mass spectrometry. The cross-linkers can be either cleavable, so that the linked peptides are uncoupled before or during the mass spectrometric fragmentation process, or in more common cases non-cleavable, where ions of the cross-linked peptides are fragmented as single chemical entities. [12, 22] Various analytical enrichment strategies have been developed to increase the detectability of the cross-linked peptides in the complex peptide mixture, which is crucial to the efficiency of the technique because both the amount and the number of cross-linked peptides are vastly lower as compared to the abundance and number of non c ross-linked peptides, and facilitate the latter data processing steps to the MS data. [23-25] With the help of these efforts, successful applications of CX-MS integrated with other techniques to challenging large macromolecular assemblies have been reported: recent examples include the determination of the architecture of the 2.5-MDa 26S proteasome using CX-MS together with cryo-electron microscopy (EM) and X-ray crystallography [26], and the deciphering the subunit topology of the TRiC/CCT chaperonin using CX-MS combined with molecular modeling. [27-28]
2.4 Labeling techniques
The local structures of the proteins are studied conventionally by X-ray crystallography and NMR. Yet different labeling techniques combined with MS measurement provide alterative pathway towards the structural information as well as the changes and dynamics of protein structures. Hydroxyl radical labeling uses the hydroxyl radicals (•OH) to induce covalent modifications at solvent-exposed amino acid side chains, which is detected as a +16 Da mass shift. The difference in the reactivity of individual side chains, keeping notion that it varies according to their chemical nature, reflects the solvent accessibility of their specific location. [29-32] The HDX technique, on t he other hand, probes the protein structure with the information of the backbone amide hydrogens. The details of this technique will be discussed in the later part of this chapter.
2.5 Perspectives of combining the structural MS strategies
Increasing attention has been paid to the combination of the above approaches as each of them has unique strengths and weaknesses. AP-MS is able to detect subtle changes in interaction partners and dynamics and is as well able to deal with lowly expressed complexes. MS of intact assemblies is able to assess the absolute stoichiometry of the intact complex and multiple subcomplexes, yet both of them lack the ability to provide finer structural details on the amino acid or pseudo-amino acid scale resolution. On the other hand, CX-MS provides peptide resolution on t he interaction site of two subunits, and HDX-MS (which will be presented in the next section) reveals protein conformations and dynamics in seconds to hours time scale and down to single-amide resolution, but both methods cannot probe the overall stoichiometry or higher oligomeric state. Therefore it is believed that these approaches are complementary and their combination could generate complete interaction maps on global protein assemblies (Figure 2 F), and furthermore, enable subsequent merging of such datasets with topological information from IM-MS and cryo-EM results. [12, 15, 17]
3 Hydrogen/deuterium exchange
Protein molecules contain a huge amount of hydrogen atoms. Part of these hydrogen atoms are bound to carbon atoms through stable covalent bonding. Whereas other hydrogen atoms, those in O–H, N–H, and S–H groups, are labile due to the higher eletronegativities of the binding atoms, and they can exchange with the surrounding water. HDX targets all labile hydrogen atoms.
3.1 Brief history of HDX studies
The study of protein hydrogen exchange dates back to the pioneering work of Linderstrøm-Lang and his coworkers at the Carlsberg Laboratories in Copenhagen in the 1950s. [33-34] Although a lot of the early data from these days were incorrect, Linderstrøm-Lang inferred the basic dynamic mechanisms of the hydrogen exchange processes and suggested the equations that govern measurable HDX, which are still accepted today.
The extraordinary potential that hydrogen exchange offers was, however, challenged for a long time by the difficulty of accurately measuring the incorporated deuterium. The development of multidimensional NMR methods first provided an efficient way to measure HX in rather small protein molecules on single amide level, as the amide proton peaks (from
hydrogen) disappear after deuteration because 2H has a spin of 1and 1H has a spin of ½.
[34-36].
Alternatively, due to the mass shift from 1.0078 Da of 1H to 2.0141 Da of 2H, the exchange
of deuterium can be measured by mass spectrometry. In 1991, Katta and Chait reported the first application of MS-based HDX [37], where they probed different conformers of ubiquitin by HDX-ESI-MS. The first HDX MS experiments to include protease (pepsin) digestion and HPLC separation were reported 1993. [38] In this work, exchange reaction was quenched at different time points by acidification and temperature decrease, followed by pepsin proteolysis, HPLC separation and FAB-MS analysis. This prototype develops into the standard bottom-up approach without major changes in the basic experimental design, but it becomes increasingly powerful thanks to the vast advances of instrumentation and software. The development of fragmentation methods, electron capture dissociation (ECD) [39] and electron transfer dissociation (ETD) [40], leads to the alternative top-down approach.
3.2 General principle of hydrogen exchange
3.2.1 The exchange of free-exposed hydrogens
The mechanism of such reaction has been studies ever since the first reports of the HDX method. [33, 41-43] Starting from the fundamental of the proton transfer reaction, now the widely accepted pathway can be described in three steps (Equation 1): formation of a hydrogen-bonded complex via diffusional collisions between a proton donor (X-H) and an acceptor (Y); rapid equilibrium redistribution of the proton between the proton donor and acceptor within the complex, and dissociation of the hydrogen-bonded complex. [42]
X H + Y k1 [ k-1 X H Y k2 X H Y] X+Y H k-2 k3 k-3 (1) k = k1( 10 𝛥𝑝𝐾 1+10𝛥𝑝𝐾) (2)
The overall rate constant can be approximated as Equation 2, where ΔpK represents the difference between the pK value of the proton acceptor and donor. [44-45] Therefore, if the acceptor is a much weaker acid than the donor, i.e. pKacceptor ≫ pKdonor, the rate constant (k) of
the proton transfer will be equal to that of the diffusional collision k1, meaning that every
collision between X-H and Y leads to a successful transfer. On the contrary, if the transfer proceeds from a weaker to a stronger acid, the transfer will be much slower than the diffusion.
This explains the different behavior of the hydrogen atoms in different groups in proteins and allows delineating three groups of hydrogen atoms. (1) Hydrogens bonded to carbon show a very high pKa and thus these hydrogens hardly exchange with surrounding hydrogens. (2) Hydrogens bonded to heteroatoms of -N, -O and -S on polar side chains or the N/C termini display much a lower pKa values for deprotonation (lower than 13 at pH 7, 25 °C) than the pKa (15.7 at pH 7, 25 °C) for OH- protonation, and therefore they are easily exchanged with
OH-. (3) Hydrogens at backbone amide groups, however, has a much higher pK value (~18),
in other words, the exchange of such hydrogens proceeds from a weaker to a stronger acid, and thus is much slower. This explains why the hydrogen exchange that is most often measured in proteins is that of the backbone amide hydrogen (NH).
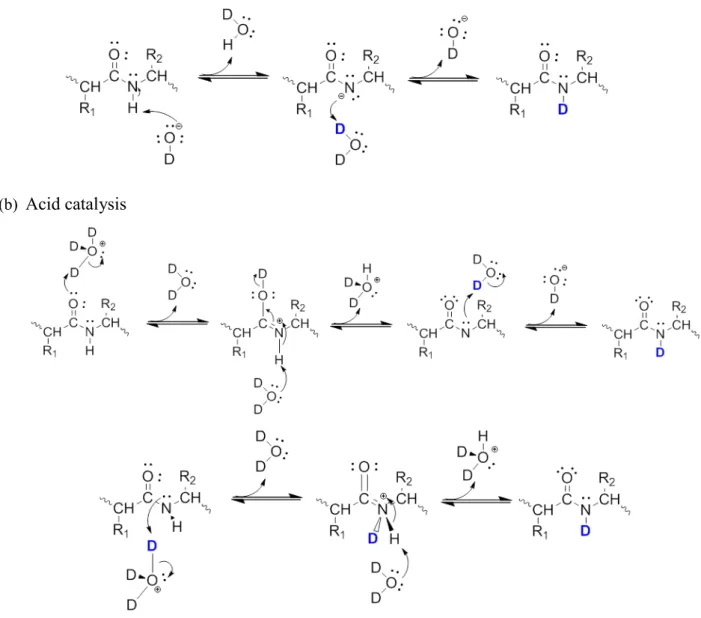
(a) Base catalysis
(b) Acid catalysis
The H/D exchange on peptide/protein backbone amide groups may proceed via base- or acid-catalyzed mechanisms. [46-47] The base-acid-catalyzed pathway, first proposed by Berger et al. in 1959, has been quickly accepted without much debate. Exchange begins from abstraction of the amide proton by a hydroxide ion and the formation of an imidate anion, which is subsequently re-protonated to complete the transfer (Figure 3 (a)). This is the more important mechanism for the physiological conditions in which proteins exist, yet it is also possible that the exchange happens via the acid-catalyzed pathway. The latter, however, has gone through a long way of discussions between two distinct mechanisms. [46, 48-49] Nowadays the more commonly accepted pathway is the so-called O-protonation (Figure 3 (b)): the protonation of the carbonyl oxygen happens first, lowering the pK for deprotonation of the amide group. The amide hydrogen is therefore removed by a water molecule to produce the imidic acid intermediate that extracts a d euterium and returns to an amide. This mechanism is more reasonable due to the fact that on the backbone amide, the more basic group is the oxygen rather than the nitrogen. Whereas an earlier-raised pathway, N-protonation (Figure 3 (c)), starts directly from the protonation of the amide nitrogen. This mechanism is mostly inhibited but still not strictly impossible. In sum, the base-catalyzed exchange occurs via the imidate anion, and is related to the structural information of the amide nitrogen. The acid-catalyzed exchange, on the other hand, is predominantly occurring via O-protonation pathway and is influenced by the amide carbonyl. Thus exchange rate constant of freely exposed backbone amide hydrogens can expressed as:
kex = kacid[D3O+]+ kbase[OD-]+ kwater (3)
According to reference studies using small peptides [33, 48, 50], at low salt conditions and 20 °C kbase can be as much as eight orders larger than kacid and eleven orders larger than kwater.
This implies that the base-catalyzed exchange is predominant at physiological conditions. Plotting log(kex) versus pH leads to a V-shaped curve (Figure 4), with a minimum exchange
rate at pH 2.5 - 3.0. This can be deduced by differentiating Equation 3 as
+ + 2 3 3 [D O ]ex acid base[D O ]w k k k K ∂ = − ∂ (4)
and setting to zero, where Kw represents the ionization constant of water. On either side of the
minimum pH, the slope of Δlog(kex)/ΔpH is approximately equal to 1 for higher pH and to -1
kcl
shift of one pH unit from the pHmin changes the exchange rate by 10-fold, and that the
exchange is nearly four orders slower at pH 2.5 than at pH 7.
Figure 4 Dependency of the exchange rate kex
51 on solution pH for amide hydrogens within a polyalanine peptide. [ ]
Another feature that affects significantly the exchange rate is the temperature. At fixed pH, reducing the temperature alters the concentration of OD- through modification of the K
w. In
addition, the diffusional collision rate k1 also changes in accordance to temperature. The
exchange rate reduces approximately one order of magnitude when the temperature lowers from 20 to 0 °C.
3.2.2 The exchange of amide hydrogen
In native (folded) proteins, a few hydrogen atoms are fully solvent-accessible that can readily exchange at a fast and often similar rate. In contrast, some of the NHs exchange quickly and others exchange much more slowly with half-lives up t o months. [9, 41, 45, 52-54] This difference in the exchange rate can be demonstrated through the following kinetic model:
NH (protected) 𝑘�� NH (unprotected) 𝑜𝑝 𝑘��ND (unprotected) 𝑒𝑥 𝑘�� ND (protected) (5) 𝑜𝑝 where kop and kcl are the rate constants for the unfolding (opening) and refolding (closing)
events that expose amide hydrogen to the solvent. This assumes that amide hydrogen requite to be in a open state in order to exchange with the surrounding water. Although there is also experimental evidences that the exchange reaction can occur when the protein is folded [55-56], most studies have been based on the above model and assume that the
exchange-competent state for an amide hydrogen is either a fully or partially unfolded state. In these conditions, the overall exchange rate constant kHDX is deduced as:
op HDX ex cl ex k k k k k = + (6) Two extreme regimes have typically been demonstrated: ordinarily proteins are stable in their native state so the refolding process is much faster than the exchange, kcl ≫kex, and the kHDX
is therefore approximated as:
kHDX = Kopkex (7)
where Kop = (kop/kcl) is the equilibrium constant of the unfolding process, implying the
probability of the exchange reaction occurring in a single unfolding event. This regime is referred to as EX2, which is more prevalent in physiological conditions than the other regime, EX1. The latter refers to the case when kex ≫kcl, meaning that the unfolding event is rate
limiting, i.e.
kHDX = kop (8)
The EX1 exchange is often observed under protein denaturing conditions or by increasing the intrinsic exchange rate. The two kinetics are easily distinguishable by mass spectrometry [57]: EX1 regime gives rise to two distinct and separated mass envelope (the undeuterated and deuterated forms) while EX2 regime gives a gradual shift of the mass envelope with time. An example of the EX1 and EX2 scheme is given in Figure 5, from a work on l ipid dependent changes of the membrane scaffold protein MSP1D1. [58] The HDX of the lipid-associated states (Figure 5, spectra on the right and red plots) shows a typical EX2 pattern, i.e. a single isotopic distribution. In the HDX of the lipid-free form, the peptide displays EX1 kinetics which can be distinguished by the presence of two isotopic distributions, e.g. in the spectrum of 5m. For the peptide with EX1 unfolding, each time point is fitted with two Gaussian distributions. The center of these distributions is used to plot the deuterium uptake for both the low (solid line, filled symbols) and high (dashed line, empty symbols) mass populations as shown in blue in Figure 5.
Figure 5 Mass spectra and deuterium uptake plots for peptide MSP1D1(72-82) in both the lipid-free (blue) and lipid-associated (red) states.[58]
3.3 Incorporation of deuterons: labeling strategies
Exposing a protein to a D2O-containing environment leads to H-D replacements that increase
the mass of the protein by one unit per exchange event, this is referred to as an ‘‘exchange-in’’ scenario, which will be mostly used throughout this thesis. Although less commonly used, it is also possible to conduct measurements in an ‘‘exchange-out’’ protocol. In the latter case the protein is first fully deuterated before placing it in H2O, so that labeling occurs in the D-H
direction. [54, 59] The protocols to induce the deuterium incorporation into the protein can be generally grouped into two types: continuous labeling and pulse labeling.
3.3.1 Continuous labeling
The final deuterium concentration after the dilution exceeds 95%, so that the exchange reaction is forced in only one direction, H→D. Unstructured and highly dynamic protein segments undergo fast exchange (blue and red colors represent protons and deuterons, respectively), while less dynamic segments exchange more slowly (Equations 5-8). At various time points from minutes to hours, aliquots are removed from the deuteration solution, and the exchange is quenched by rapid acidification.
Figure 6 Schematic representation of typical continuous labeling work flow. [60]
The nature of the protein properties that are being monitored with continuous labeling has gone through different debates. It has always been demonstrated that HDX provides direct information on t he solvent accessibility of amide groups. [52, 61-62] Yet according to detailed studies of the exchange patterns [54, 63], it s eems more appropriate to state that HDX rates reflect the intactness of the hydrogen bonding network, i.e. solvent exposure and breakage of hydrogen bonds are both required for the exchange to occur, which should be met simultaneously in the “unprotected” conformation in Equation 5. It is also claimed that that HDX primarily reports on the stability and dynamics of secondary structure elements, because most intramolecular hydrogen bonds are associated with α-helices and β-sheets. [54, 64]
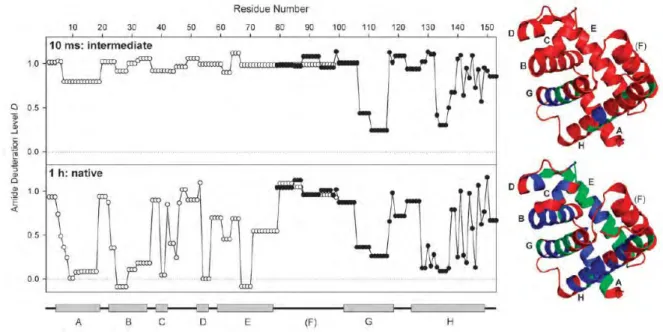
3.3.2 Pulse labeling
Pulse labeling strategy, although less commonly used, brings unique type of information: it detects and characterizes protein folding intermediates, short-lived species that exhibit structural features in-between the native and the unfolded states. [58, 65-66] In these studies
(Figure 7) an initially denatured protein is rapidly transferred to a suitable solvent environment, thereby triggering the refolding process. Subsequently, the protein is exposed to a brief (millisecond to several seconds) HDX pulse at a well defined time point during the reaction. A series of measurements is conducted by varying the time interval between folding trigger and pulse. In this way it is possible to obtain detailed insights into the temporal sequence of events that lead from the unfolded state to the native conformation. Pulsed HDX is typically handled under basic conditions (pD 8–10) to ensure that extensive isotope exchange can occur during the short labeling step, taking advantage of the pD-tunability of kex according to Equation 3. The labeling pulse may be quenched by rapid acidification to pH
2.5 or solvent evaporation during ESI in the case of on-line HDX-MS approaches. Often the folding intermediates contain regions that are hydrogen bonded to some extent, whereas other segments remain disordered. When the pulse conditions are well-controlled, the free amides become completely deuterated, whereas those that are even marginally protected remain in their N–H form. The ‘‘all-or-nothing’’ (protected or not) readout under such conditions allows folded and unfolded regions to be readily differentiated.
Figure 7 Example of typical pulsed HDX work flow. [67] Mixing of acid-denatured protein with ammonium hydroxide triggers refolding at mixer M1 in a H2O environment. After a variable folding
time (tfold, ranging between 10 ms and 1 s), addition of D2O at mixer M2 initiates a 20 ms labeling
pulse. HDX is quenched by formic acid solution after M3 for 1 s, before the solution is infused into the ESI source of a mass spectrometer. pH-meter readings for D2
3.4 Measuring the HDX
O-containing solutions are referred to as pH*.
Any method that is sensitive to the properties of the isotopes of hydrogen can be used to monitor the HD exchange. The prior applications were the measurements of increasing
radioactivity of the labeled proteins after incorporation of tritium (T2O) [44], and later NMR
was introduced because deuterium is NMR silent and replacement of amide hydrogens by deuterons causes the disappearance of the corresponding 1H NMR peaks. [68] The first report
of protein HDX-MS appeared in 1991[37], thanks to the application of ESI.
Mass analyses of deuterated proteins can be conducted at the global protein level, which represent a straightforward approach for characterizing global changes in protein structure and stability, either when the protein is alone to monitor natural motions under equilibrium conditions or in response to ligand binding, complex formation, activation, presence of denaturants, etc.
To achieve spatial resolution, the deuterium levels of short peptide fragments have to be measured. This is achieved, before the mass measurement, either by proteolysis of the deuterated protein, or by fragmentation of the protein in gas-phase with ECD or ETD, referred to as the bottom-up and top-down approach, respectively (Figure 8).
Figure 8 Brief illustration of the difference between bottom-up and top-down HDX-MS protocols. [54] In bottom-up experiments the protein is subjected to limited proteolysis after labeling. Each protein molecule is cleaved multiple times, generating solution-phase peptides. Top-down experiments involve the dissociation of intact proteins in the gas phase. Individual protein molecules usually experience only one cleavage event, resulting in complementary N- and C-terminal ion-pairs (c/z-ions in the case of ECD and ETD).
3.4.1 Bottom-up approach
The classical proteolysis/LC-MS approach, or the bottom-up approach of HDX-MS, was first reported in 1993. [38] It was originally developed as an extension of the NMR and radioactivity strategies, yet through the past decades this approach has been gradually improved thanks to the great instrumental improvements of the chromatography and mass spectrometry as well as the variations of the experimental protocols. Typically, continuous-labeling HD exchange is followed by acid quenching. [54] Subsequently, an acid-tolerant protease such as pepsin is added to induce limited proteolysis. The resulting peptides are desalted and separated by reversed phase LC, and analyzed by ESI-MS. The solution temperature is lowered to ~0 °C during quenching and all subsequent steps, and proteolysis and LC separation are conducted in a minimum of time (~30 min. or less), in order to minimize the back-exchange effect that some deuterons incorporated in backbone amides exchange back with surrounding hydrogen. In this process, no information is obtainable for side chains due to their very high back exchange rates.
3.4.1.1 Back exchange
It is critical for HDX-MS to retain the label as much as possible during the experimental process. However, as stated above, after deuteration the proteins have to undergo proteolysis, desalting, concentration, separation and mass measurement, all of which are carried out in protiated solution. Therefore, deuterated positions on a mide groups as well as side chains may all revert to hydrogen. These back-exchange processes cannot be completely avoided. On the side-chains, due to the high kex value, all deuterons are back-exchanged to hydrogen.
On the amide backbones, contrarily, the back-exchange can be minimized if careful control is taken during the experiment.
Primarily, a pH at which exchange is at the minimum state and a t emperature as low as possible are maintained during the whole procedure after the HD exchange. According to Equations 3 a nd 4, t he exchange rate reaches the minimum at pH ~ 2.5, whereas the quenching temperature is usually set 0-4 °C, the temperature limit a t which the LC experiment may be carried out. Comparing to the condition at pH 7 and 25 °C, the exchange rate constant of the unprotected hydrogen/deuteron is five orders of magnitude lower in this quenching condition. The half-life for back-exchange, depending on t he sequence of the proteins and proteolyzed peptides, varies from 30 to 120 min [45, 50-51], and therefore the
whole analysis process after the exchange reaction has to be completed as quickly as possible. It has been proven that if proteolysis and separation steps are kept under 12-15 min total, deuterium recovery can be as much as 85%, while the losses in the ESI interface during spraying can be kept to less than 5%. [66] Notably, although the measured increases in mass correspond predominantly to the exchange on the backbone amides, rich content of arginines can complicate the analysis because arginine has a side chain amide hydrogen with a minimum exchange rate close to that of the backbone NHs, so that the deuterons on these groups may not be completely washed away before the mass analysis.
Various methods have been reported to adjust or reduce the back-exchange. For example, the deuteration level can be corrected by compensating the extent of labeling loss for completely deuterated proteins. [38] The use of supercritical fluid chromatography (SFC) is also introduced as an alternative to HPLC, taking advantage of separating the peptides using CO2
rather than protiated solvents as mobile phase, which partly reduces the possibility of back-exchange although the proteolysis step cannot be accomplished in supercritical CO2.[69]
3.4.1.2 Choice of protease
The quenching condition, i.e. pH 2.5 and ~0 °C has to be maintained strictly during the whole analytical process. The protease to hydrolyse the proteins, therefore, has to be active at this chosen pH and temperature. Pepsin has always been the enzyme of choice. [38, 51] Pepsin is most active at pH 1.5-2.0. [70] Its optimal temperature is 37-42 °C, but is still active at 0 °C. Unlike trypsin and other strictly specific enzymes, pepsin shows only a preference of cleavage towards some amino acid residues. The weak specificity of pepsin results in both advantages and hindrances for the HDX MS methodology. The peptic peptides detected by mass spectrometry can achieve sequence coverage of 100% or higher, i.e. overlaps of peptide fragments are frequently observed. However, the identification of peptides from such a complicated mixture is not straightforward via cleavage position alone. Therefore, tandem mass spectrometry (MS/MS) has been considered as an indispensable step for the peptic peptide identification.
However, incomplete cleavage of large proteins and limited number of peptic peptides sometimes restrict the range of applicability when using pepsin alone. Additional proteases (protease type XIII from Aspergillus saitoi and protease type XVIII from Rhizhopus) were introduced in the HDX MS method, and have been demonstrated to increase the sequence coverage of the peptide mixture. [65, 71-72] These proteases are, similarly as pepsin, not
specific in the cleavage site, but they are not as efficient as pepsin under quench conditions. Yet combining the different proteases yields significantly higher sequence coverage and better spatial resolution as they each have slight preferences of the cleavage sites.
3.4.1.3 Chromatography
Typically, for a protein of about 50 kDa, more than one hundred peptides are generated after pepsin hydrolysis. [57] In addition, the peptide mixture is usually in a salt solution which cannot be directly analyzed by MS. Thus prior to mass analysis, the peptides are desalted and separated using HPLC to minimize mass overlap and ion suppression in the mass spectrometer. The length in time of the HPLC run and the detailed gradient needs to be appropriately designed, so that the loss of deuterium through back exchange with solvent is minimized, while the resolution can be achieved as high as possible. As stated above, 85% of the total exchange can be retained if the proteolysis and separating steps are finished within 15 min. IN order to compensate the loss of labeling and the gain in final sequence coverage, a 30-40-min time scale for proteolysis and separation is typically applied nowadays.
The complexity of the samples that can be analyzed in such a f ast gradient is generally limited comparing to standard LC separation gradient that sometimes last up to several hours, especially when using slower scanning or lower-resolution mass spectrometers. In addition, the short time allocated to the separation makes it d ifficult to implement capillary chromatographic systems that have typically higher elution delays due to larger relative in system dead volumes. [73] Therefore different approaches have been reported to improve the LC efficiency and reduce the back-exchange during the chromatography.
Besides the above-mentioned use of SFC, the replacement of H2O in the aqueous mobile
phase with mixed solvent of H2O and polar aprotic modifiers [dimethylformamide (DMF) or
N-methylpyrrolidone (NMP)] during the HPLC step [74] was another option to decrease the back-exchange derived from the idea of avoid the use of protiated solvents.
Other strategies involve the decrease of the temperature below zero point. The half time of back-exchange extends to 18 hour s at -30 °C. [73] To achieve successful LC at subzero conditions, buffer modifiers need to be carefully selected that can reduce the freezing point of commonly used aqueous solvent systems, are mass spectrometry compatible, and do not preclude the use of liquid chromatography. Once such a system is well designed, it allows
much longer time to perform extensive chromatographic separation or subsequent sample processing.
As discussed in 2.4, ion mobility separation (IMS) has been widely applied to the analysis of proteins after ESI and MALDI. Based on the drift behaviors through an inert gas under the influence of an electric field, ions are separated due to the differences in the sizes, shapes and charges. These features are different from that of reversed-phase (RP)-HPLC in bottom-up HDX-MS workflow, thereby making IMS independent to HPLC and adding an additional dimension of separation. [75-76] Commercial IMMS instrument uses IM to separate ions between the ion source and mass analyzer, which occurs on a millisecond timescale; many mobility separations can occur during each chromatographic peak (which are typically on more of a seconds timescale). It is also proven from a demonstrative study of a small protein [75] that no additional losses of deuterium were created during the IMS process, and the drift time does not change upon solution-based deuterium incorporation, thus the addition of IMS increases the LC peak capacity of the experiment and should aid in HDX studies of very large proteins and protein complexes.
3.4.2 Top-down approach
Unlike the proteolysis/LC-MS approach that cleaves the deuterated proteins before introducing them into the mass spectrometer, in the “top-down” approach, fragmentation of the proteins takes place in the gas phase. Every individual chain typically experiences only a single cleavage event, resulting in a complementary N- and C-terminal ion pair. Spatial resolution can be obtained in top-down experiments because not every protein is cleaved at the same backbone site, such that a ladder of ion pairs is produced (Figure 8, lower part). Early attempts to apply top-down strategies in HDX/MS were based on the use of collision-induced dissociation (CID). Yet the collisional heating of CID leads to a “scrambling” process, the intramolecular migration of hydrogen upon activation and can completely randomize the H/D exchange pattern that was imprinted onto the protein backbone during solution-phase HDX. The uses of ECD [39] and ETD [40] have basically solved the scrambling problem. Both techniques involve the transfer of a low energy electron to a gas-phase protein cation, generating the c/z- ion pairs. And the low energy induced in such fragmentations is critical as scrambling is negligible during the process, provided that collisional activation in the ion sampling interface is kept at a minimum. Potential advantages of these electron-based fragmentation techniques include an improved spatial resolution and
the opportunity to minimize back exchange. [62] Both ECD and ETD have claimed high sequence coverage, allowing enhanced spatial resolution to be achieved, in some cases even down to the single amide level. [67] As chromatography is no longer a limit for the solvent selection and the analysis can be much faster because the proteolysis and separation steps are replaced by the gas-phase fragmentation, more flexible strategies can be applied to reduce the back-exchange. The temperature in the quenching condition can be subzero, e.g. Amen et al. [77] have reported a chip-based nanoelectrospray approach based on cooling to subzero temperature (-15 °C), offering additional advantages over nanoelectrospray needles such as high spray reproducibility and spray stability and the possibility for automation [78], and the deuteration level remains ~95% after 10 m in of back-exchange. Yet when the protein size increases, i.e. when the protein is larger than 30 kDa, the top-down approach has not conquered the limitation of incomplete sequence coverage, which is a hindrance from the gas phase fragmentation efficiency. [79] Combining the bottom-up and top-down approach is therefore another option to take advantages of both methods, which is going to be discussed later.
3.4.3 Mass measurement and data processing
Relative HDX levels of individual protein fragments are determined as a function of deuteration time t according to
deuteration level (t) = 𝑚(𝑡)− 𝑚0
𝑚𝑚𝑎𝑥 −𝑚0 (9)
where m(t) is the centroid mass of the peptide of interest, whereas mmax and m0 are the
corresponding reference masses for completely labeled and unlabeled peptide, respectively. Each amino acid residues in the protein corresponds to a unique kinetic, yet this single site resolution are difficult to achieve with common experimental condition. Therefore the exchange rate constants on the peptide level are always determined rather than the single amide group, as:
deuteration level (t) = A0 + A1(1 – exp[-k1t]) + A2(1 – exp[-k2t]) (10)
where A0 is the fraction of amide sites that undergo burst phase exchange, and A1, A2 are the
fractions that are labeled with average rate constants k1 and k2, respectively. [54] In many
cases, a single exponential term is sufficient for the fitting of the observed kinetics, and it is not very common to observe kinetics that requires more than two exponentials.
![Figure 5 Mass spectra and deuterium uptake plots for peptide MSP1D1(72-82) in both the lipid-free (blue) and lipid-associated (red) states.[58]](https://thumb-eu.123doks.com/thumbv2/123doknet/2730411.64905/35.892.324.567.103.632/figure-spectra-deuterium-uptake-plots-peptide-associated-states.webp)


![Figure 1 The eukaryotic translation initiation pathway. [1] 2 The role of eIF3 in translation initiation](https://thumb-eu.123doks.com/thumbv2/123doknet/2730411.64905/63.892.178.719.246.878/figure-eukaryotic-translation-initiation-pathway-role-translation-initiation.webp)
![Figure 2 MS spectrum of the yeast eIF3 isolated by tagging subunit eIF3b. [12]](https://thumb-eu.123doks.com/thumbv2/123doknet/2730411.64905/66.892.165.735.348.760/figure-ms-spectrum-yeast-eif-isolated-tagging-subunit.webp)
