Previous growing season climate controls the occurrence of black
1
spruce growth anomalies in boreal forests of Eastern Canada
2 3
Clémentine Ols*, Annika Hofgaard, Yves Bergeron & Igor Drobyshev 4
5
Clémentine Ols, Institut de Recherche sur les Forêts, Université du Québec en Abitibi-6
Témiscamingue, 445 boul. de l'Université, Rouyn-Noranda, QC J9X 5E4, Canada; e-mail: 7
clementine.ols@uqat.ca 8
Annika Hofgaard, Norwegian Institute for Nature Research, P.O. Box 5685 Sluppen, NO-9
7485 Trondheim, Norway; e-mail: annika.hofgaard@nina.no 10
Yves Bergeron, Institut de Recherche sur les Forêts, Université du Québec en Abitibi-11
Témiscamingue, 445 boul. de l'Université, Rouyn-Noranda, QC J9X 5E4, Canada; e-mail: 12
yves.bergeron@uqat.ca 13
Igor Drobyshev, Institut de Recherche sur les Forêts, Université du Québec en Abitibi-14
Témiscamingue, 445 boul. de l'Université, Rouyn-Noranda, QC J9X 5E4, Canada; Southern 15
Swedish Forest Research Centre, Swedish University of Agricultural Sciences, P.O. Box 49, 16
SE-230 53 Alnarp, Sweden; e-mails: igor.drobyshev@uqat.ca, igor.drobyshev@slu.se 17
18
*Corresponding author: 19
Clémentine Ols: Institut de recherche sur les forêts, Université du Québec en Abitibi-20
Témiscamingue, 445 boul. de l'Université, Rouyn-Noranda, QC J9X 5E4, Canada. 21
Tel: +1 819 880 0288 or +33 (0)7 82 81 89 20, email: clementine.ols@uqat.ca 22
Abstract
23To better understand climatic origins of annual tree-growth anomalies in boreal forests, we 24
analysed 895 black spruce (Picea mariana [Mill.] B.S.P.) tree-growth series from 46 xeric 25
sites situated along three latitudinal transects in Eastern Canada. We identified inter-annual 26
(based on comparison to previous year growth) and multi-decadal (based on the entire tree-27
ring width distribution) growth anomalies between 1901 and 2001 at site and transect levels. 28
Growth anomalies occurred mainly at site level and seldom at larger spatial scales. Both 29
positive inter-annual and multi-decadal growth anomalies were strongly associated with 30
below-average temperatures and above-average precipitation during the previous growing 31
season (Junet-1-Augustt-1). The climatic signature of negative inter-annual and multi-decadal 32
growth anomalies was more complex and mainly associated with current year climatic 33
anomalies. Between the early and late 20th century, only negative multi-decadal anomalies 34
became more frequent. Our results highlight the role of previous growing season climate in 35
controlling tree growth processes and suggest a positive association between climate warming 36
and increases in the frequency of negative multi-decadal growth anomalies. Projected climate 37
change may further favour the occurrence of tree-growth anomalies and enhance the role of 38
site conditions as modifiers of tree response to regional climate change. 39
Key words: ecological resilience, climate change, growth sensitivity, adaptive capacity, forest 40
productivity 41
Résumé
43Nous avons étudié l’origine climatique des anomalies de croissance des forêts boréales en 44
analysant 895 séries de croissance d’épinette noire (Picea mariana [Mill.] B.S.P.) provenant 45
de 46 sites xériques repartis le long de trois transects latitudinaux dans l’Est Canadien. Nous 46
avons identifié les anomalies de croissance interannuelles (comparaison à l’année précédente) 47
et multi-décennales (comparaison à toutes les années) pour chaque site et transect de 1901 à 48
2001. Les anomalies de croissance apparaissent principalement à l’échelle du site mais 49
rarement à de plus larges échelles géographiques. Les anomalies positives (interannuelles et 50
multi-décennales) sont fortement associées à des températures basses et des précipitations 51
fortes pendant la saison de croissance de l’année précédente. L’origine climatique des 52
anomalies négatives (interannuelles et multi-décennales) est plus complexe et généralement 53
associée à des anomalies climatiques de l’année en cours. Entre le début et la fin du XXe 54
siècle, seules les anomalies multi-décennales négatives sont devenues plus fréquentes. Nos 55
résultats révèlent l’importance du climat de la saison de croissance précédente dans 56
l’apparition d’anomalies de croissance et suggèrent un lien positif entre le réchauffement 57
climatique et l’augmentation de la fréquence des anomalies multi-décennales négatives. 58
L’augmentation prévue des températures dans les prochaines décennies pourrait davantage
59
accroitre la fréquence des anomalies.
60
Mots-clés: résilience écologique, changement climatique, sensitivité de croissance, capacité 61
d’adaptation, production forestière 62
Introduction
64Recent climate dynamics indicate an increase in global mean temperature and in the 65
frequency and intensity of climate extremes (IPCC 2014). Trees have shown physiological 66
limitations to cope with the rate of climate changes (Renwick and Rocca 2015), as evidenced 67
by the occurrence of recent geographically widespread growth declines (Girardin et al. 2014) 68
and drought-induced mortality (Allen et al. 2010). Effects of climate change on tree growth 69
are most often assessed by correlating continuous time series of annual tree-rings data with 70
climate variables (Fritts 1976). Among less common approaches is the use of discontinuous 71
series, such as binary time series of years of growth anomalies, that also provide information 72
on the effects of climate anomalies on tree-growth dynamics (Neuwirth et al. 2007). 73
Nevertheless, the influence of climate extremes on tree growth, and particularly on the 74
occurrence of tree-growth anomalies, is complex and still poorly understood. Existing studies 75
suggest that, depending on their timing, duration and intensity, climate extremes impact tree 76
growth in different ways. For instance, unusually low precipitation during spring and summer 77
has often been associated with reduced tree growth, while similar anomalies in autumn and 78
winter rarely affect growth (Zeppel et al. 2014). Similarly, frost events prior to bud break 79
usually do not impact growth, whereas frost events following bud break can damage newly 80
formed needles or leaves, and lead to a decreased growth during the remaining growing 81
period (Sutinen et al. 2001). Moreover, due to temporal changes in tree sensitivity to climate, 82
recurrent climate extremes during an individual tree’s lifespan may trigger contrasting growth 83
responses (Fritts 1976). 84
Despite the complexity of associations between climate extremes and growth anomalies, 85
temporal changes in the frequency of growth anomalies may reflect occurrence of extreme 86
weather conditions at regional scales (Fonti et al. 2010) and may also provide information on 87
tree sensitivity and tree capacity to adapt to climate change, especially in well-drained sites 88
where trees are more sensitive to changes in precipitation patterns (Fritts 1976). For example, 89
narrow rings formed during droughts are generally characterized by higher proportions of 90
latewood cells that increase tree “hydraulic safety” (Pothier et al. 1989). The plasticity of 91
anatomical structure in tree rings may therefore represent an adaptation strategy to withstand 92
soil water deficits (Bigler and Veblen 2009). On the other hand, more frequent negative 93
growth anomalies may reflect an increase in the occurrence of drought conditions whereas 94
more frequent positive growth anomalies may reflect trees’ capacity to maintain high growth 95
levels despite changes in mean climate and climate variability. The use of temporal changes
96
in the frequency of growth anomalies as proxy for climate variability or/and tree capacity to 97
withstand such variability calls for a better understanding of associations between regional 98
climate dynamics and growth anomalies. 99
Growth anomalies are commonly studied on annually resolved tree-ring series 100
(Schweingruber et al. 1990). Anomalies observed in a large proportion of individual tree-101
growth series within the same site or region have been called pointer years (Schweingruber et 102
al. 1990) and have been associated with large-scale climatic anomalies (Schultz et al. 2009), 103
insect outbreaks (Boulanger et al. 2012) and volcanic eruptions (Gennaretti et al. 2014). 104
Boreal forests in Canada cover 55% of the land area and are dominated by black spruce 105
(Picea mariana [Mill.] B.S.P.). Because of its ecological and economical importance, large 106
geographical distribution and sensitivity to climate, black spruce has been widely used to 107
study climate-growth interactions (Hofgaard et al. 1999; Rossi et al. 2006). Growth declines 108
have been reported to dominate across old-growth black spruce forests of North America 109
(Girardin et al. 2012). These results suggest that the benefits of warmer temperatures, such as 110
a longer growing season, may not necessarily counterbalance the moisture stress and 111
respiration-associated carbon loss triggered by higher temperatures. 112
In Eastern Canada, seasonal temperatures have increased since the beginning of the 20th 113
century (Hansen et al. 2010), while seasonal precipitations have shown inconsistent patterns 114
(Wang et al. 2014). Warmer temperatures increase tree respiration, decrease trees’ carbon 115
stock and shift carbon allocation from stem to roots or foliage (Gifford and Evans 1981). 116
Such changes in allocation patterns may favour the occurrence of growth anomalies. In the 117
boreal forest of western Quebec, pointer years of black spruce have recently been associated 118
to anomalies in spring and summer weather (Drobyshev et al. 2013). However, no studies 119
have yet specifically investigated the spatiotemporal frequency and climatic origin of black 120
spruce growth anomalies at synoptic (103 km2) scales. In this paper, we analyze (1) the 121
spatiotemporal patterns and (2) climatic origin of pointer years across province-wide climatic 122
gradients in well-drained boreal forests in Quebec. We formulate three hypotheses: (i) pointer 123
years occur synchronously across climatic gradients within boreal Quebec; (ii) pointers years 124
are mainly associated with climatic anomalies during the growing season; and (iii) in the face 125
of climate change, negative and positive pointer years have become more and less frequent, 126
respectively. 127
128
Material and Methods
129Study area
130
We studied black spruce growth along three latitudinal transects in northern Quebec (Figure 131
1). The western transect (henceforward named West) is characterised by low plains (200-350 132
m a.s.l.) while the central and eastern transects (Central and East, respectively) are dominated 133
by hills (400-800 m a.s.l.), particularly pronounced in the north. Dominant overlying bedrock 134
deposits consist of peat along West and of till along Central and East (Ministère des 135
Ressources naturelles du Québec 2013). The two main climatic gradients in the study area are 136
a decreasing temperature gradient from south to north and an increasing summer precipitation 137
gradient from west to east. July and January are the warmest and coldest month of the year, 138
respectively (Table 1). The mean growing season length (1971-2000), starting 10 days after 139
average daily temperature is above 5°C and ending at fall frost, ranges from < 100 days in 140
northern parts to 110-120 days in southern parts of all transects (Agriculture and Agri-Food 141
Canada 2014). The growing season starts in late April in West and early May in Central and 142
East, and ends in early October in all transects (Table 1). The whole study area receives a 143
similar amount of precipitation between May and September, even if it rains substantially less 144
along West than along Central and East over June to August (Figure 1). Major snowfall 145
periods occur in December and January in all transects, with additional important snowfall in 146
March in Central and East (Table 1). Due to these temperature and precipitation gradients, 147
current fire cycles are shorter in the western part (about 95 years) than in the eastern part of 148
the study area (up to 2000 years) (Ministère des Ressources naturelles du Québec 2013). 149
150
Site selection and sampling
151
We selected 14 to 17 sampling sites along each transect (Table1, Figure 1), using the 2007 152
Provincial Forest Inventory (Ministère des Ressources naturelles du Québec 2009). Most sites 153
were situated in the spruce-moss forest bioclimatic domain, but few northernmost sites were 154
located in the spruce-lichen domain (Figure 1, Supplement S1). Selected sites consisted of 155
unmanaged black spruce forests (> 100 years) on well-drained soils. We selected unmanaged 156
forests to minimize anthropogenic impacts on growth patterns, old stands to allow the 157
construction of long series and sites on well-drained soils (xeric to mesoxeric) to maximize 158
precipitation signal in tree-growth series and drought effects on tree-growth. 159
At each site, we collected 3-16 cores from dominant healthy living trees (one core per tree) 160
and 0-15 cookies from dead trees (one cookie per tree) (Supplement S2). We sampled cores 161
and cookies as close as possible to the ground but above stem base deformities, using an 162
increment borer and chainsaw, respectively. The total number of samples per site ranged from 163
10 to 27 (Table 1, Supplement S2). Dead trees were sampled to extend series and accounted 164
for 0-100% (40% in average) of the sampled trees per site (Supplement S2). We attempted to 165
restrict sampling of dead trees to snags of trees that were dominant when still alive. Ten pre-166
selected sites along West burnt before sampling in 2013. As no trees had survived, sampling 167
was adapted accordingly to only include recently dead but previously dominating trees (15 168
cookies per site, Supplement S2). We sampled trees during the summers of 2013 and 2014. 169
170
Sample preparation, crossdating and measurements
171
Tree-growth samples were sanded, scanned and measured with an accuracy of 0.01 mm using 172
the CooRecorder program (Cybis Elektronik & Data AB 2015). Prior to analyses, we quality 173
checked each tree-growth series. First, we visually and statistically crossdated tree-growth 174
series at site level using the R package dplR (Bunn 2010) and the COFECHA program 175
(Grissino-Mayer 2001). Following crossdating, we excluded tree-growth series presenting a 176
low correlation (r < 0.4) with their respective site master (average of all series of a site except 177
the focal series). We also excluded tree-growth series presenting any growth reduction longer 178
than five years that synchronized with years of known spruce budworm outbreaks (Boulanger 179
and Arseneault 2004). Out of 1380 tree-growth series, 895 passed the quality check and were 180
used in the analyses: 183, 342 and 370 individual tree-growth series along West, Central and 181
East, respectively (Table 1, Supplement S2). Quality checked tree-growth series were then log 182
transformed, detrended using a 32-year spline and prewhitened (Cook and Peters 1997). This 183
standardisation procedure kept high-frequency variations in growth, mainly linked to climate 184
variability, while removing low-frequency variations commonly related to biological or stand-185
level effects. As a result, the standardisation increased correlation between tree-growth series 186
and climate. Finally, we built raw and detrended site series, calculated as the biweighted 187
robust mean of all raw or detrended series from a site (Supplement S2). Site series lengths 188
ranged from 120 to 312 years (Table 1, Supplement S2). Most raw site series presented a 189
signal-to-noise ratio larger than 2 and an expressed population signal larger than 0.6. Both 190
indicators generally increased after detrending (Supplement S2). 191
192
Identification of pointer years
193
Pointer years are commonly defined as growth anomalies appearing synchronously in several 194
individual tree-growth series within a specific geographical region or site (Fritts 1976). The 195
identification of pointer years can vary substantially depending on the time frame within 196
which anomalies are defined (Bijak 2008). In this study, we concomitantly considered two 197
definitions of pointer years previously used in the literature. First, we considered pointer years 198
as inter-annual growth anomalies, also known as pointer interval (Schweingruber et al. 1990). 199
We termed these as year-to-year (YTY) pointer years. YTY pointer years were defined as 200
years in which at least 75% of the trees within a site recorded a 10% increase or decrease in 201
ring width as compared to the previous year (Mérian 2012). Second, we considered pointer 202
years as multi-decadal growth anomalies, i.e., years in which tree-ring width fell outside the 203
central 90% of the ring width distribution of a tree. We termed these as quantile (QTL) 204
pointer years. QTL pointer years were defined as years in which at least 20% of the trees 205
within a site exhibited a growth in the upper and lower 5% quantiles of the distribution 206
(Drobyshev et al. 2013). The two identification methods differ in initial inputs (raw series for 207
YTY and detrended series for QTL pointer years) and in the temporal scale at which 208
anomalies are defined (short-term variability in YTY and long-term variability, i.e., over the 209
entire lifespan of an individual tree in QTL). 210
We identified positive and negative pointer years at site level when site series included at 211
least 10 individual tree series between 1901-2001. All site series presented a sample depth of 212
10 over the entire study period except six series in West that had a replication of 10 only from 213
1900-1950, 1920-1974, 1900-1973, 1900-1988, 1900-1972 and 1918-2001. Lastly, we 214
identified years in which at least 50% of the site series within a transect recorded a pointer 215
year of identical sign (positive or negative), henceforward named main pointer years. 216
217
Ordination of pointer years’ occurrence at site level
218
Between 1901-2001, we coded pointer years as 1 and all other years as 0, and built site-219
specific binary time series for each of the four types of pointer years (positive/negative 220
YTY/QTL). Years with a sample depth below 10 trees were coded as NA. We evaluated 221
between-site similarity in the occurrence of pointer years by non-metric multidimensional 222
scaling using the R package vegan (Oksanen et al. 2015). This ordination method condenses a 223
set of multiple time series into a set of two or three principal components (dimensions) to 224
facilitate the visual interpretation of the results. The ordination was performed separately for 225
each type of pointer year using Euclidean distances between binary time series. We ran the 226
ordination at a two-dimension level with a limit of 150 random iterations. However, stable 227
results were always found after a maximum of 10 iterations. 228
229
Synchronicity of pointer years along and across transects
230
To account for possible random effects on synchronicity, we tested differences between 231
observed and expected frequencies of synchronous pointer years along and across transects 232
with a Chi-square test between 1901-2001. Considering within-transect synchronicity, we 233
calculated transect-specific ratios of observed vs. expected number of years with zero to N 234
sites synchronously presenting a pointer year. N was the highest observed number of sites 235
synchronously recording a pointer year. Similarly, to evaluate synchronicity levels across 236
transects, we calculated ratios of observed vs. expected number of years with zero to three 237
transects synchronously presenting a main pointer year (cf. identification of pointer years). To 238
comply with requirements of the Chi-square test, we aggregated data into classes with 239
expected frequency above five. 240
241
Climate data
242
Climate data from meteorological stations in Quebec are too scarce to perform accurate and 243
reliable climate-growth analyses at large geographical scales. We, therefore, used climate data 244
from the 0.5° x 0.5° CRU TS 3.22 global dataset (Harris et al. 2014). Site-specific climate 245
data were extracted using 0.5° x 0.5° grid cells, each site location defining the centre of a 246
climatic grid cell. Prior to analyses, we verified the quality of the extrapolated grid data by 247
comparing them to climate data from 11 meteorological stations in Quebec (Environment 248
Canada 2014) that had not been used in the construction of the CRU dataset (Supplement S3). 249
We averaged station data at transect level and compared them to the average of all site-250
specific 0.5° x 0.5° grid cells data along each transect between 1936-2004, the longest 251
common period between both types of climate data. Grid data correlated well (r > 0.97) with 252
station data, preserving climate variability within and between transects, i.e., north-south 253
temperature and west-east precipitation gradients (data not shown). The extrapolated grid data 254
were, therefore, selected as climate input for all further analyses. The mean climatic 255
characteristics of each transect between 1901-2001 are presented in Table 1. In addition to 256
temperature and precipitation, we extracted monthly North Atlantic Oscillation and Arctic 257
Oscillation indices from the Climate Prediction Center database (NOAA 2014) between 1950-258
2001. 259
260
Associations between pointer years and climate
261
We studied associations between the occurrence of pointer years and climatic anomalies at 262
site level through superposed epoch analyses using the R package dplR (Bunn 2010). These 263
analyses evaluate whether the mean values of climate variables during pointer years 264
significantly differ from their mean values during normal years. Climate variables included 265
monthly mean, maximum and minimum temperature and total precipitation and the two 266
monthly oscillation indices. We performed superposed epoch analyses for each of the four 267
types of pointer years (positive/negative YTY/QTL). We ran analyses on the longest common 268
period between climatic records and site-specific binary time series, i.e., 1901-2001 for 269
temperature and precipitation, and 1950-2001 for the two oscillation indices. Analyses 270
included months from previous May (Mayt-1) to current August (Augustt). 271
In addition, we studied climate-growth interactions along each transect by investigating
272
correlation coefficients and response functions between detrended transect series (average of
273
all detrended site series along a transect) and the above-mentioned climate variables.
274
Analyses were performed using the R package bootRes (Zang and Biondi 2013). All
275
correlation coefficients and response functions were tested for 95% confidence intervals using
276
1000 bootstrap samples.
277 278
Temporal changes in the frequency of pointer years
279
We studied changes in the frequency of pointer years between 1901-2001 by dividing the 280
study period into three sub-periods of approximately 30 years (1901-1935, 1936-1970, 1971-281
2001). This temporal division, based on the definition of climate by the World Meteorological 282
Organization (WMO 2015), assumes a 30-year block-stationary climate (Visser and Petersen 283
2012). We partitioned our study area into six regions by dividing each transect into a northern 284
and southern region (Figure 1, Supplement S1). The north-south delimitation along each 285
transect was defined by the median latitude of all sites. 286
We identified changes in the frequency of pointer years between the first (1901-1935) and last 287
sub-period (1971-2001) using generalized linear models with binomial distribution (Crawley 288
2005). Models were run at a regional level. For each region, we tested the significance of
289
temporal changes in pointer year frequencies, aggregating data from all site-specific binary 290
time series within that region. In case of over-dispersion in the residuals, we re-fitted the 291
models using quasibinomial distribution and performed a Pearson's Chi-squared test to test for 292
significance in differences following this readjustment (Crawley 2005). All Chi-square tests 293 were significant at p < 0.05. 294 295
Results
296Among-site similarities in occurrence of pointer years
297
Regardless of the type of pointer year, the ordination revealed strong longitudinal and 298
latitudinal patterns in the occurrence of pointer years, and particularly for negative pointer 299
years (Figure 2). The aggregation level of ordination was generally low for all types of pointer 300
years, except for QTL positive pointer years in which sites were strongly aggregated around 301
the origin of the ordination (Figure 2). For all types of pointer years, West was the most 302
geographically defined group while some overlap occurred between Central and East, 303
especially during positive pointer years. 304
305
Spatial scale of pointer year occurrence
306
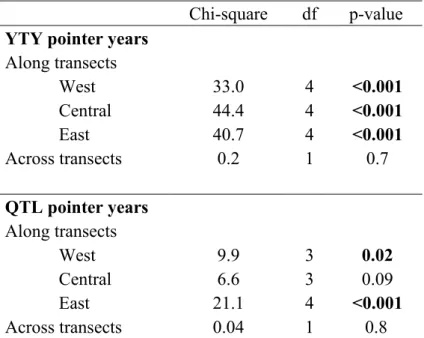
Both YTY and QTL pointer years mainly occurred at site level and more rarely at larger 307
scales, as underlined by the few main pointer years (2 to 7) identified on each transect (Figure 308
3). This low synchronicity along all transects was, nevertheless, significantly higher than what 309
would be expected by a random process (Table 2). 310
Only three out of 18 YTY main pointer years (1927,1959 and 1974) were recorded 311
simultaneously on two transects, while no synchronous QTL main pointer year occurred 312
across transects (Figure 3). This level of synchronicity across transects was significantly 313
lower than would be expected by a random process (Table 2). 314
The occurrence of main pointer years was temporally irregular and transect-specific (Figure 315
3). QTL main pointer years did not reveal clear temporal patterns in any of the transects. YTY 316
main pointer years only occurred between 1920-1960 in East, precisely when they ceased 317
occurring in West. Along Central, YTY main pointer years only occurred between 1960-318
1980, except 1927. Regardless of the pointer year type, the number of positive and negative 319
main pointer years was identical in West and East. YTY main pointer years were more 320
numerous than QTL main pointer years on all transects (Figure 3). 321
322
Spatial frequency of main pointer years
323
The spatial distribution of sites recording either YTY or QTL main pointer years varied over 324
the study period along each transect (Figure 4). Nevertheless, a number of main pointer years 325
predominantly occurred at southern or northern sites, e.g., YTY 1924 in East and YTY 1927 326
in Central. Along West, both YTY and QTL main pointer years tended to occur more often in 327
the north. Along Central, all main pointer years before 1960 mostly occurred at northern sites, 328
their occurrence extending southward thereafter but disappearing from the central part of the 329
transect (C8-C12). Along East, main pointer years (both YTY and QTL) in the late 1950s had 330
a dominant northern occurrence. 331
The latitudinal range of sites recording YTY main pointer years was larger than those 332
recording QTL main pointer years, e.g., 1913 in West and 1943 in East (Figure 4). All or 333
almost all main pointer years occurred at some sites (W10-W12, C7 and E5) while, at other 334
sites, only few were observed (C1, E1) (Figure 4). 335
Climatic origin of pointer years
337
Regardless of their type, positive pointer years were mainly associated with climatic 338
anomalies during previous growing season while negative pointer years were mainly 339
associated with current year climatic anomalies. Significant associations observed with mean, 340
maximum and minimum temperature were mostly similar (Supplement S5). Few significant 341
associations with monthly oscillation indices were found, and these were site-specific 342
(Supplement S5). 343
Positive pointer years
344
There was a strong and spatially consistent association between both positive YTY and QTL 345
pointer years and below-average previous growing season mean temperatures (Junet-1 through 346
Augustt-1) (Figure 5). This overall strong association was also highlighted by relatively high 347
correlation and response function coefficients (Supplement S4). However, some differences 348
between the climatic origin of YTY and QTL pointer years were evident. For instance, the 349
association between positive pointer years and below-average Augustt-1 temperature was only 350
significant for YTY pointer years in Central and West and for QTL pointer years in East and 351
West. Positive YTY pointer years were also associated with below-average temperatures in 352
Mayt-1 and Decembert-1 in East, and positive QTL pointer years with below-average 353
temperatures in Octobert-1 through Novembert-1 in West and Central. 354
Significant associations between maximum temperature anomalies and positive pointer years 355
(both YTY and QTL) were mostly comparable to those observed for mean temperature. 356
However, associations observed with below-average mean temperature in Novembert-1 and 357
Decembert-1, were not longer observed with maximum temperature. In addition, associations 358
between QTL pointer years and above-average spring maximum temperature (Aprilt-Junet), 359
that were not observed for mean temperature, emerged in Central. 360
Associations between positive pointer years and precipitation were few but mainly linked to 361
above-average previous growing season anomalies. Positive YTY pointer years were 362
associated with higher Mayt-1-Junet-1 precipitation, and positive QTL pointer years were 363
linked to anomalously high Julyt-1-Augustt-1 precipitation (Figure 5). 364
Negative pointer years
365
Significant associations between the occurrence of negative pointer years and climatic 366
anomalies were less numerous as compared to positive (Figure 5). 367
Both negative YTY and QTL pointer years were associated with below-average Januaryt 368
mean temperature in all transects. A strong association between negative YTY pointer years 369
and below-average Aprilt temperature was found in West. 370
Significant associations between maximum temperature anomalies and negative pointer years 371
(both YTY and QTL) were largely comparable to those observed for mean temperature. 372
However, we noticed that associations with below-average Januaryt mean temperature in 373
Central and East were no longer observed for maximum temperature. In addition, significant 374
associations with below-average Aprilt maximum temperature were more numerous than for 375
mean temperature. 376
Significant associations with precipitation were rare and very site-specific (Figure 5). 377
However, both types of negative pointer years were significantly associated with above-378
average Mayt precipitation (Figure 5). 379
380
Temporal changes in the frequency of pointer years
381
We detected few significant changes in the frequency of YTY and QTL pointer years between
382
the early and late 20th century. The frequency of positive pointer years of both types remained 383
largely the same between these two periods, except in West. There, the frequency of positive 384
YTY pointer years increased in the southern region, while the frequency of positive QTL 385
pointer years decreased in the northern region (Figure 6). 386
Negative QTL pointer years became significantly more frequent in all six regions between the
387
early and late 20th century, whereas the frequency of negative YTY pointer years did not 388
change, except in the southern region of West where it increased (Figure 6). 389
390
Discussion
391Spatial synchronicity of pointer years
392
Few pointer years synchronized across boreal Quebec suggesting that, even if common 393
climatic forcing causing extreme tree growth occurs, these events are rare, particularly along 394
longitudinal gradients. This suggests that climatic forcing leading to the occurrence of 395
synchronous growth events, such as pointer years or frost rings (Plasse et al. 2015), occur 396
more easily along latitudinal climatic gradients in our study area. Longitudinal climatic 397
gradients in boreal Quebec, triggering differences in climate-growth relationships in black 398
spruce (Nicault et al. 2014), appear to prevent the formation of synchronous pointer years at 399
large scales. Pointer years occurring simultaneously over the entire study area would involve 400
large-scale climatic and biotic events, such as volcanic eruptions (Gennaretti et al. 2014), 401
anomalies in atmospheric circulation patterns (Schultz et al. 2009) and/or region-wide 402
synchronous insect outbreaks (Boulanger et al. 2012). However, our data did not suggest 403
occurrence of such events during the 20th century. 404
405
Climatic origin of pointer years
406
Positive pointer years in boreal Quebec, despite their site-specific occurrence, originated from 407
similar site-level climatic anomalies during the previous growing season. We hypothesize that 408
low temperature and high precipitation anomalies during the previous growing season 409
increase carbon accumulation before dormancy by lowering climatic stress, e.g., heat and 410
water limitation, which results in growth-promoting higher carbon stocks the following 411
growing season. Indeed, a recent study on black spruce growth across the entire boreal 412
Canada has shown that water limitation and heat stress negatively affected carbon 413
assimilation in black spruce the year preceding tree-ring formation and decrease growth 414
during the subsequent growing season (Girardin et al. 2015). A positive effects of moist 415
previous summers on black spruce growth during the subsequent growing season has also 416
been reported earlier for western Quebec (Hofgaard et al. 1999). 417
Negative pointer years of both types were not associated to any particular climatic conditions, 418
suggesting that negative pointer years might arise from complex and temporally inconsistent 419
combinations of climatic anomalies (Schultz et al. 2009). For example, repeated frost events 420
during June and July, a period with high cambium activity (Rossi et al. 2006), have been 421
shown to disturb growth and lead to the formation of negative pointer years (Plasse et al. 422
2015). The lack of consistent climatic signature in the occurrence of negative pointer years 423
might also suggest that their appearance is strongly modulated by site-level factors (Neuwirth 424
et al. 2004), e.g., topography (Desplanque et al. 1999) and/or ground vegetation (Plasse et al. 425
2015). 426
427
Temporal changes in the frequency of pointer years
428
The large-scale increase in the frequency of negative QTL pointer years between the early and
429
late 20th century echoes recent growth declines observed in boreal forests of North America 430
(Girardin et al. 2014; Girardin et al. 2015) and might, similarly to reported growth declines, 431
reflect negative effects of climate warming, e.g., heat stress, on multi-decadal growth patterns 432
(Girardin et al. 2015). The observed higher frequency of negative QTL pointer years does not 433
appear to be linked to a decrease in water availability since no significant changes in regional 434
precipitation patterns occurred in the study area during the 20th century (Wang et al. 2014). 435
The temporally stable frequency of YTY pointer years (both positive and negative) between
436
the early and late 20th century indicates that black spruce inter-annual growth variations, 437
contrarily to multi-decadal growth variations, do not appear to be affected by climate change. 438
This contradicts the fact that climate-change related phenomena, such as the decrease in 439
Arctic sea ice cover, have been reported to significantly co-vary with inter-annual growth 440
dynamics of black spruce in eastern North-America (Girardin et al. 2014). 441
442
Growth anomalies as signs of tree growth vulnerability to climate change
443
The observed large-scale increase in the frequency of negative QTL pointer years between the
444
early and late 20th century could reflect an increasing incapacity of trees to maintain stable 445
above-ground growth in the face of warming temperatures. Such an increase might also point 446
toward higher carbon allocation to roots to improve access to water and nutrients (Gifford and 447
Evans 1981; Lapenis et al. 2013) during warmer growing conditions. A continuous increase in 448
maximum tree ring density has been recently reported in eastern North America (Mannshardt 449
et al. 2012). These observations, along with the observed increase in the frequency negative 450
QTL pointer years, imply that trees more often produce dense and narrow rings characterized 451
by higher proportions of latewood cells. Since such cells increase hydraulic capacity (Pothier 452
et al. 1989), more frequent negative pointer years could indicate a mitigation mechanism 453
against heat stress and decreased water availability. Future studies need to investigate 454
synergies between below- and above-ground growth dynamics of adult black spruces, e.g., to 455
test whether declines in stem growth synchronize with increased root growth. 456
Conclusion
458Growth anomalies seldom synchronized across sites, highlighting the site-specific occurrence 459
of extreme growth events in black spruce forests of boreal Quebec. Despite their site-specific 460
occurrence, positive growth anomalies were mainly triggered by climatic anomalies during 461
the previous growing season. The lack of coherent climatic signature for negative growth 462
anomalies suggested that their origin was more complex and modulated to a higher degree by 463
non-climatic factors, e.g., site-level factors, as compared with positive growth anomalies. Our 464
results call for further analyses on the role of site conditions (altitude, topography) and stand 465
characteristics (tree age and density) in modulating tree responses to climate change. 466
Within the time frame of their definition, pointer years can bring important information on 467
past climate-growth interactions. Because, the time frame used to define growth anomaly 468
strongly affects the outcome of pointer year identification and subsequent analyses, we 469
generally advocate for the use of both short- and long-term time frame for more 470
comprehensive and objective analyses. 471
472
Acknowledgements
473This study was financed by the Natural Sciences and Engineering Research Council of 474
Canada (NSERC) through the project “Natural disturbances, forest resilience and forest 475
management: the study case of the Northern Limit for timber allocation in Quebec in a 476
climate change context”, by the Nordic Forest Research Cooperation Committee (SNS) 477
through the network project entitled “Understanding the impacts of future climate change on 478
boreal forests of Northern Europe and Eastern Canada” (grant no. 12262), and by support 479
from NINA’s core funding from the Research Council of Norway (project 160022/F40). We 480
acknowledge Sylvain Larouche and Simon Paradis for their precious help during fieldwork 481
and thank Jeanne Portier for providing us with additional tree-ring material.We also thank 482
Xiao Jing Guo from the Canadian Forest Service for statistical support and Linda Shiffrin for 483
language and grammar checking. Finally, we thank two anonymous reviewers for comments 484
and improvements on an earlier version of the paper. 485
References
Agriculture and Agri-Food Canada. 2014. Length of growing season in Quebec. Available from
http://www.agr.gc.ca/eng/science-and-innovation/agricultural- practices/climate/future-outlook/climate-change-scenarios/length-of-growing-season-in-quebec/?id=1363104198111 [accessed 2015-05-07].
Allen, C.D., Macalady, A.K., Chenchouni, H., Bachelet, D., McDowell, N., Vennetier, M., Kitzberger, T., Rigling, A., Breshears, D.D., Hogg, E.H., Gonzalez, P., Fensham, R., Zhang, Z., Castro, J., Demidova, N., Lim, J.H., Allard, G., Running, S.W., Semerci, A., and Cobb, N. 2010. A global overview of drought and heat-induced tree mortality reveals emerging climate change risks for forests. For. Ecol. Manage. 259(4): 660-684. doi: 10.1016/j.foreco.2009.09.001.
Bigler, C., and Veblen, T.T. 2009. Increased early growth rates decrease longevities of conifers in subalpine forests. Oikos 118(8): 1130-1138. doi: 10.1111/j.1600-0706.2009.17592.x.
Bijak, S. 2008. Various factors influencing the pointer year analysis. Tree Rings Archaeol. Climatol. Ecol 6: 77-82.
Boulanger, Y., and Arseneault, D. 2004. Spruce budworm outbreaks in eastern Quebec over the last 450 years. Can. J. For. Res. 34: 1035-1043. doi: 10.1139/X03-269.
Boulanger, Y., Arseneault, D., Morin, H., Jardon, Y., Bertrand, P., and Dagneau, C. 2012. Dendrochronological reconstruction of spruce budworm (Choristoneura fumiferana) outbreaks in southern Quebec for the last 400 years. Can. J. For. Res. 42(7): 1264-1276. doi: 10.1139/x2012-069.
Bunn, A.G. 2010. Statistical and visual crossdating in R using the dplR library. Dendrochronologia 28: 251–258. doi: 10.1016/j.dendro.2009.12.001.
Cook, E.R., and Peters, K. 1997. Calculating unbiased tree-ring indices for the study of climatic and environmental change. The Holocene 7(3): 361-370. doi:
10.1177/095968369700700314.
Crawley, M.J. 2005. Count Data. In Statistics. John Wiley & Sons, Inc. pp. 227-245. Cybis Elektronik & Data AB. 2015. CooRecorder.
Desplanque, C., Rolland, C., and Schweingruber, F.H. 1999. Influence of species and abiotic factors on extreme tree ring modulation: Picea abies and Abies alba in Tarentaise and Maurienne (French Alps). Trees 13: 218-227.
Drobyshev, I., Gewehr, S., Berninger, F., Bergeron, Y., and McGlone, M. 2013. Species specific growth responses of black spruce and trembling aspen may enhance resilience of boreal forest to climate change. J. Ecol. 101(1): 231-242. doi:
10.1111/1365-2745.12007.
Environment Canada. 2014. Climate historic data. Available from
http://climate.weather.gc.ca/advanceSearch/searchHistoricData_e.html - stnNameTab [accessed 2014-10-10].
Fonti, P., von Arx, G., Garcia-Gonzalez, I., Eilmann, B., Sass-Klaassen, U., Gartner, H., and Eckstein, D. 2010. Studying global change through investigation of the plastic responses of xylem anatomy in tree rings. New Phytol. 185(1): 42-53. doi: 10.1111/j.1469-8137.2009.03030.x.
Fritts, H.C. 1976. Tree Rings and Climate. Academic Press, London: 567pp.
Gennaretti, F., Arseneault, D., Nicault, A., Perreault, L., and Begin, Y. 2014. Volcano-induced regime shifts in millennial tree-ring chronologies from northeastern North America. Proc. Natl. Acad. Sci. U. S. A. 111(28): 10077-10082. doi:
10.1073/pnas.1324220111.
Gifford, R.M., and Evans, L.T. 1981. Photosynthesis, carbon partitioning, and yield. Annu. Rev. Plant Physiol. 32: 485-509.
Girardin, M.P., Guo, X.J., Bernier, P.Y., Raulier, F., and Gauthier, S. 2012. Changes in growth of pristine boreal North American forests from 1950 to 2005 driven by landscape demographics and species traits. Biogeosciences 9: 2523–2536. doi: 10.5194/bg-9-2523-2012.
Girardin, M.P., Guo, X.J., De Jong, R., Kinnard, C., Bernier, P., and Raulier, F. 2014. Unusual forest growth decline in boreal North America covaries with the retreat of Arctic sea ice. Glob. Chang. Biol. 20(3): 851-866. doi: 10.1111/gcb.12400.
Girardin, M.P., Hogg, E.H., Bernier, P.Y., Kurz, W.A., Guo, X.J., and Cyr, G. 2015. Negative impacts of high temperatures on growth of black spruce forests intensify with the anticipated climate warming. Global Change Biol.: n/a-n/a. doi: 10.1111/gcb.13072. Grissino-Mayer, H.D. 2001. Evaluating crossdating accuracy: A manual and tutorial for the
computer program COFECHA 57(2): 205-221.
Hansen, J., Ruedy, R., Sato, M., and Lo, K. 2010. Global Surface Temperature Change. Rev. Geophys. 48(4). doi: 10.1029/2010rg000345.
Harris, I., Jones, P.D., Osborn, T.J., and Lister, D.H. 2014. Updated high-resolution grids of monthly climatic observations - the CRU TS3.10 Dataset. Int. J. Climatol. 34(3): 623-642. doi: 10.1002/joc.3711.
Hofgaard, A., Tardif, J.C., and Bergeron, Y. 1999. Dendroclimatic response of Picea mariana and Pinus banksiana along a latitudinal gradient in the eastern Canadian boreal forest. Can. J. For. Res. 29: 1333-1346.
IPCC. 2014. IPCC Fifth Assessment Report Climate Change 2014: Synthesis report-Summary for Policymakers. 1-35.
Lapenis, A.G., Lawrence, G.B., Heim, A., Zheng, C., and Shortle, W. 2013. Climate warming shifts carbon allocation from stemwood to roots in calcium-depleted spruce forests. Glob. Biogeochem. Cycles 27(1): 101-107. doi: 10.1029/2011gb004268.
Levin, S.A. 1992. The problem of pattern and scale in Ecology: the Robert H. MacArthur Award Lecture. Ecology 73(6): 1943-1967.
Mannshardt, E., Craigmile, P.F., and Tingley, M.P. 2012. Statistical modeling of extreme value behavior in North American tree-ring density series. Clim. Chang. 117(4): 843-858. doi: 10.1007/s10584-012-0575-5.
Mérian, P. 2012. POINTER et DENDRO : deux applications sous R pour l’analyse de la réponse des arbres au climat par approche dendroécologique. Rev. for. fr. 6: 789-798. Ministère des Ressources naturelles du Québec. 2009. Norme d'inventaire écodendrométrique
nordique.
Ministère des Ressources naturelles du Québec. 2013. Rapport du Comité scientifique chargé d’examiner la limite nordique des forêts attribuables.
Neuwirth, B., Esper, J., Schweingruber, F.H., and Winiger, M. 2004. Site ecological differences to the climatic forcing of spruce pointer years from the Lötschental, Switzerland. Dendrochronologia 21(2): 69-78. doi:
http://dx.doi.org/10.1078/1125-7865-00040.
Neuwirth, B., Schweingruber, F.H., and Winiger, M. 2007. Spatial patterns of central European pointer years from 1901 to 1971. Dendrochronologia 24(2–3): 79-89. doi: http://dx.doi.org/10.1016/j.dendro.2006.05.004.
Nicault, A., Boucher, E., Tapsoba, D., Arseneault, D., Berninger, F., Bégin, C., DesGranges, J.L., Guiot, J., Marion, J., Wicha, S., and Bégin, Y. 2014. Spatial analysis of the black spruce (Picea mariana [MILL] B.S.P.) radial growth response to climate in northern Québec, Canada. Can. J. For. Res.
NOAA. 2014. Teleconnections indices. Available from
http://www.cpc.ncep.noaa.gov/products/precip/CWlink/daily_ao_index/telecon nections.shtml [accessed 2014-10-10].
Oksanen, J., Blanchet, F.G., Kindt, R., Legendre, P., Minchin, P.R., O'Hara, R.B., Simpson, G.L., Solymos, P., Stevens, M.H.H., and Wagner, H. 2015. vegan: Community Ecology Package.
Plasse, C., Payette, S., and Matlack, G. 2015. Frost hollows of the boreal forest: a
spatiotemporal perspective. J. Ecol. 103(3): 669-678. doi: 10.1111/1365-2745.12399. Pothier, D., Margolis, H.A., Poliquin, J., and Waring, R.H. 1989. Relation between the
permeability and the anatomy of jack pine sapwood with stand development. Canadian Journal of Forest Research 19(12): 1564-1570. doi: 10.1139/x89-238.
Renwick, K.M., and Rocca, M.E. 2015. Temporal context affects the observed rate of climate-driven range shifts in tree species. Glob. Ecol. Biogeogr. 24(1): 44-51. doi: 10.1111/geb.12240.
Rossi, S., Deslauriers, A., Anfodillo, T., Morin, H., Saracino, A., Motta, R., and Borghetti, M. 2006. Conifers in cold environments synchronize maximum growth rate of tree-ring formation with day length. New Phytol. 170(2): 301-310. doi: 10.1111/j.1469-8137.2006.01660.x.
Schultz, J., Neuwirth, B., Winiger, M., and Löffler, J. 2009. Negative pointer years from Central European tree-rings caused by circulation patterns. Tree Rings in
Archaeology, Climatology and Ecology 7: 78-84.
Schweingruber, F.H., Dieter, E., Serre-Bachet, F., and Bräker, O.U. 1990. Identification, presentation and interpretation of event years and pointer years in dendrochronology. Dendrochronologia 8: 9-38.
Sutinen, M.-L., Arora, R., Wisniewski, M., Ashworth, E., Strimbeck, R., and Palta, J. 2001. Mechanisms of Frost Survival and Freeze-Damage in Nature. In Conifer Cold Hardiness. Edited by F. Bigras and S. Colombo. Springer Netherlands. pp. 89-120. Visser, H., and Petersen, A.C. 2012. Inferences on weather extremes and weather-related
disasters: a review of statistical methods. Clim. Past 8(1): 265-286. doi: 10.5194/cp-8-265-2012.
Wang, Y., Hogg, E.H., Price, D.T., Edwards, J., and Williamson, T. 2014. Past and projected future changes in moisture conditions in the Canadian boreal forest. Forestry
WMO. 2015. What is Climate? Available from
http://www.wmo.int/pages/prog/wcp/ccl/faqs.php [accessed 2015-08-24]. Zang, C., and Biondi, F. 2013. Dendroclimatic calibration in R: The bootRes package for
response and correlation function analysis. Dendrochronologia 31(1): 68-74. doi: 10.1016/j.dendro.2012.08.001.
Zeppel, M.J.B., Wilks, J.V., and Lewis, J.D. 2014. Impacts of extreme precipitation and seasonal changes in precipitation on plants. Biogeosciences 11(11): 3083-3093. doi: 10.5194/bg-11-3083-2014.
Table 1. Characteristics of transects.
West Central East
Sampling
Sites 14 15 17
Series per site (range) 10-22 19-25 12-27
Series per transect 183 342 370
Site series length (range in years) 120-302 140-312 136-301
Climate*
Latitude [WGS84] [50.3N, 52.6N] [50N, 52.2N] [50.2N, 52.9N]
Longitude [WGS84] [-77.7E, -77.1E] [-74.1E, -72.1E] [-68.8E, -67.1E] Growing season late April-early Oct early May-early Oct early May-early Oct
Growing season [days] <100-120 <100-120 <100-120
Warmest month (min, max [°C]) July (11, 18) July (10, 19) July (10, 19) Coldest month (min, max [°C]) Jan (-29, -14) Jan (-30, -14) Jan (-29, -13)
Most Snow Dec-Jan Dec-Jan-Mar Dec-Jan-Mar
Most Rain Sept Jul (Sept) Jul (Sept)
Table 2. Pointer years’ synchronicity along and across transects. The table presents results of contingency analyses for YTY and QTL pointer years, respectively; only collapsed Chi-square statistics are presented in the table. Significant p-values (p < 0.05) are in bold.
Chi-square df p-value
YTY pointer years
Along transects West 33.0 4 <0.001 Central 44.4 4 <0.001 East 40.7 4 <0.001 Across transects 0.2 1 0.7 QTL pointer years Along transects West 9.9 3 0.02 Central 6.6 3 0.09 East 21.1 4 <0.001 Across transects 0.04 1 0.8
Fig.1. Location, bioclimatic domains (a, b) and climate (c) of the study area and study sites along the latitudinal West (black), Central (red) and East (blue) transects in northern Quebec. The median site latitude on each transect separates southern sites (circles) from northern sites (triangles). Mean temperature (°C) and precipitation (mm) along each transect are presented. Standard deviation for each climate variable is added in pale colors.
Fig. 2. Nonmetric multidimensional scaling of positive and negative YTY and QTL pointer year occurrence at site level between1901-2001. West, Central and East sites are plotted in black, red and blue, respectively. Latitude and longitude (arrows) significantly explained each ordination (p < 0.01). s values give the stress of the ordination. s values between 0.1 and 0.2 usually provide a good representation of multidimensional between-site distances.
Fig. 3. Transect-level frequency and occurrence of pointer years for 1901-2001. Results for YTY and QTL pointer years are respectively presented in the upper and lower section of the figures. Left Y axes show proportion of sites (%) recording a pointer year for each calendar year. Right Y axes show the number of sites included in the analyses through time (black horizontal lines). Positive and negative pointer years are plotted in black and grey,
respectively. Calendar years’ markers are given for main pointer years, i.e., years when more than 50% of the sites along a transect record the same pointer year.
Fig. 4. Spatial frequency of main pointer years along their respective transect (see Fig. 3 for identified main pointer years). Filled squares show site-level occurrence of transect-specific main pointer years. Negative and positive main pointer years are plotted in blue and red, respectively. Light and dark colors are used for YTY and QTL main pointer years, respectively. x stands for years when pointer year identification was not conceivable (i.e., when sites series were based on less than 10 trees). Panels are aligned using the median latitude of each transect (black horizontal line), representing the limit between southern and northern sites (West: 51.4°; Central: 51.5°; East: 51.3°).
Fig. 5. Significant associations between the occurrence of pointer years and monthly
temperature (Tmean and Tmax) and total precipitation (1901-2001) at site level, as revealed by superposed epoch analyses. Analyses were run from previous May (Mayt-1) to current August (Augustt) and for positive (upper section) and negative (lower section) pointer years. Empty and filled circles represent significant associations found for YTY and QTL pointer years, respectively. Filled circles with a black outline are sites at which associations were significant for both YTY and QTL pointer years. Blue and red circles stand for significant association with below- and above-average climate, respectively. Maps of the study area are only plotted when three or more sites along the same transect presented a significant
association (p < 0.05) to a specific monthly climate variable.
Fig. 6. Changes in the frequency of pointer years between the early and late 20th century.
Changes in the frequency of pointer years between the first (1901-1935) and last sub-period (1971-2001) were identified for each region using generalized linear models with either binomial or quasibinomial distribution according to overdispersion. Blue ‘-’ and red ‘+’ indicate significant (p < 0.05) decreases and increases in the frequency of pointer years, respectively, while white ‘0’ denote non-significant changes. W, C, E, N and S stand for West, Central, East, North and South, respectively.
Supplementary material
Supplement S1. Geographical characteristics of sampling sites
Site Latitude Longitude Forest domains Transect Region W1 50.253 -77.096 Spruce-moss West South W2 50.703 -77.689 Spruce-moss West South W3 50.725 -77.697 Spruce-moss West South W4 50.837 -77.637 Spruce-moss West South W5 50.969 -77.655 Spruce-moss West South W6 51.132 -77.52 Spruce-moss West South W7 51.312 -77.356 Spruce-moss West South W8 51.572 -77.428 Spruce-moss West North W9 51.764 -77.42 Spruce-moss West North W10 52.026 -77.26 Spruce-moss West North W11 52.027 -77.269 Spruce-moss West North W12 52.119 -77.216 Spruce-moss West North W13 52.261 -77.077 Spruce-moss West North W14 52.587 -77.357 Spruce-lichen West North C1 50.012 -74.142 Spruce-moss Central South C2 50.349 -73.676 Spruce-moss Central South C3 50.409 -73.729 Spruce-moss Central South C4 50.428 -73.669 Spruce-moss Central South C5 50.547 -73.52 Spruce-moss Central South C6 50.779 -73.27 Spruce-moss Central South C7 51.288 -72.542 Spruce-moss Central South C8 51.712 -72.273 Spruce-moss Central North C9 51.764 -72.253 Spruce-moss Central North C10 51.869 -72.216 Spruce-moss Central North C11 52.148 -72.168 Spruce-lichen Central North C12 52.154 -72.169 Spruce-lichen Central North C13 52.155 -72.162 Spruce-lichen Central North C14 52.18 -72.136 Spruce-lichen Central North C15 52.181 -72.131 Spruce-lichen Central North E1 50.177 -68.818 Spruce-moss East South E2 50.239 -68.789 Spruce-moss East South E3 50.248 -68.781 Spruce-moss East South E4 50.254 -68.777 Spruce-moss East South E5 50.342 -68.806 Spruce-moss East South E6 50.473 -68.811 Spruce-moss East South E7 50.615 -68.744 Spruce-moss East South E8 51.176 -68.266 Spruce-moss East South E9 51.306 -68.109 Spruce-moss East South E10 52.116 -68.005 Spruce-moss East North E11 52.245 -67.744 Spruce-moss East North E12 52.53 -67.438 Spruce-moss East North E13 52.587 -67.438 Spruce-moss East North E14 52.587 -67.437 Spruce-moss East North E15 52.738 -67.402 Spruce-lichen East North E16 52.779 -67.409 Spruce-lichen East North E17 52.864 -67.107 Spruce-lichen East North
Supplement S2. Raw and detrended site series characteristics and statistics.
Site Cores Cookies Samples Start End Length Ring width Raw Detrended (years) mean (SD) SNR1 EPS2 SNR1 EPS2
W1 10 0 10 1892 2012 120 0.789 (0.292) 6.188 0.861 0.629 0.386 W2 7 3 10 1831 2012 181 0.424 (0.243) 22.872 0.958 1.481 0.597 W3 10 0 10 1822 2012 190 0.380 (0.142) 1.591 0.614 1.569 0.611 W4 7 3 10 1763 2013 250 0.265 (0.078) 2.544 0.718 3.112 0.757 W5 7 4 11 1793 2012 219 0.327 (0.125) 1.157 0.536 0.59 0.371 W6 3 7 10 1738 2013 275 0.278 (0.062) 0.785 0.44 2.588 0.721 W7 12 7 19 1839 2014 175 0.352 (0.219) 25.428 0.962 1.998 0.666 W8 13 9 22 1779 2014 235 0.329 (0.120) 3.378 0.772 4.499 0.818 W9 0 13 13 1819 2009 190 0.539 (0.169) 5.342 0.842 2.706 0.73 W10 0 13 13 1710 2012 302 0.286 (0.090) 4.335 0.813 2.473 0.712 W11 0 11 11 1740 2013 273 0.305 (0.076) 1.145 0.534 2.372 0.703 W12 0 15 15 1723 2013 290 0.274 (0.067) 2.142 0.682 3.061 0.754 W13 14 1 15 1819 2014 195 0.326 (0.093) 2.781 0.736 1.971 0.663 W14 0 14 14 1800 2012 212 0.679 (0.312) 18.413 0.948 3.376 0.789 C1 15 4 19 1873 2013 140 0.950 (0.460) 21.215 0.955 3.718 0.788 C2 15 6 21 1859 2013 154 0.851 (0.236) 4.444 0.816 6.165 0.86 C3 15 10 25 1865 2013 148 0.795 (0.535) 45.375 0.978 8.66 0.896 C4 15 9 24 1869 2013 144 0.677 (0.329) 44.047 0.978 11.151 0.918 C5 15 10 25 1757 2013 256 0.606 (0.395) 22.607 0.958 4.604 0.822 C6 15 7 22 1866 2013 147 0.723 (0.269) 12.862 0.928 3.441 0.775 C7 15 10 25 1816 2013 197 0.493 (0.369) 54.357 0.982 6.929 0.874 C8 15 10 25 1701 2013 312 0.381 (0.120) 7.668 0.885 4.765 0.827 C9 15 8 23 1714 2013 299 0.390 (0.117) 7.36 0.88 3.529 0.779 C10 12 11 23 1758 2013 255 0.462 (0.139) 6.228 0.862 1.812 0.644 C11 14 8 22 1766 2013 247 0.463 (0.216) 13.197 0.93 3.009 0.751 C12 14 7 21 1754 2013 259 0.469 (0.211) 8.086 0.89 6.181 0.861 C13 14 10 24 1746 2013 267 0.566 (0.144) 1.434 0.589 2.912 0.744 C14 15 8 23 1796 2013 217 0.463 (0.282) 14.352 0.935 7.012 0.875 C15 14 6 20 1797 2013 216 0.395 (0.149) 3.594 0.782 2.675 0.728 E1 14 10 24 1872 2013 141 1.075 (0.447) 13.404 0.931 5.261 0.84 E2 14 7 21 1819 2013 194 0.642 (0.201) 3.045 0.753 2.147 0.682 E3 16 9 25 1771 2013 242 0.617 (0.273) 3.481 0.777 7.45 0.882 E4 15 8 23 1765 2013 248 0.539 (0.149) 3.117 0.757 3.553 0.78 E5 15 10 25 1768 2013 245 0.512 (0.150) 8.189 0.891 3.772 0.79 E6 15 7 22 1712 2013 301 0.336 (0.162) 8.913 0.899 1.6 0.615 E7 15 9 24 1877 2013 136 0.934 (0.437) 21.556 0.956 8.62 0.896 E8 16 11 27 1794 2013 219 0.655 (0.281) 21.436 0.955 4.881 0.83 E9 15 11 26 1819 2013 194 0.577 (0.227) 22.342 0.957 5.4 0.844 E10 10 6 16 1737 2013 276 0.394 (0.095) 1.978 0.664 2.253 0.693 E11 10 5 15 1792 2013 221 0.367 (0.102) 2.275 0.695 4.149 0.806 E12 9 3 12 1761 2013 252 0.516 (0.158) 1.787 0.641 3.093 0.756 E13 14 10 24 1831 2013 182 0.644 (0.286) 18.69 0.949 1.128 0.53 E14 15 11 26 1835 2013 178 0.609 (0.296) 33.118 0.971 2.798 0.737 E15 15 5 20 1799 2013 214 0.405 (0.112) 5.985 0.857 2.304 0.697 E16 14 6 20 1829 2013 184 0.477 (0.222) 4.48 0.818 1.748 0.636 E17 14 6 20 1800 2013 213 0.757 (0.328) 5.352 0.843 6.69 0.87
Supplement S3. List of meteorological stations used to verify the quality of grid climate data CRU TS 3.22. Identification numbers (ID) are given according to climat.meteo.gc.ca,
Government of Canada. Coordinates are in WGS84. “Monthly data” indicates periods for which monthly data were available.
STATION ID Latitude Longitude Altitude (m) Monthly data
Baie Comeau A 7040440 49.13 -68.20 21.60 1947-2004 Chapais 2 7091305 49.78 -74.85 396.20 1962-2004 Chibougamau 7091400 49.92 -74.37 378 1936-1975 Chibougamau Chapais A 7091404 49.77 -74.53 378.10 1982-1992 Chute-des-Passes 7061541 49.84 -71.17 398.20 1960-1976 Eastmain 7092305 52.25 -78.52 6.10 1960-1993 Fermont 704BC70 52.80 -67.08 594.40 1976-2004 Manicouagan A 7044470 50.65 -68.83 406.30 1961-1971 Matagami A 7094639 49.77 -77.82 281.30 1973-1991 Pentecote 7045910 49.73 -67.17 15 1971-2004 Poste Montagnais 7046212 51.88 -65.73 609.60 1973-2004
Supplement S4. Correlation (left panel) and response functions (right panel) between detrended transect series and monthly climate variables. Correlations and response functions were
calculated between 1901-2001 for monthly temperatures (Tmean, Tmax, Tmin) and precipitation (CRU TS 3.22) (a), and between 1950-2001 for monthly oscillation indices (NOAA) (b).
Monthly variables and indices go from previous May (m) to current August (A). Error bars are only displayed for significant correlations or response functions (p < 0.05).
Supplement S5. Significant associations between the occurrence of pointer years at site level and site-specific monthly temperature (Tmin) values (1901-2001) and the two monthly oscillation indices (1960-2001), as shown as superposed epoch analyses. Analyses were run from previous May (Mayt-1) to current August (Augustt) and for positive (upper figure section) and negative (lower figure section) pointer years. Maps are only plotted when three or more sites along the same transect presented significant association (p < 0.05) for the monthly climate variable. Empty and filled circles represent significant associations found for YTY and QTL pointer years, respectively. Filled circles with a black outline are sites at which associations were significant for both YTY and QTL pointer years. Blue and red circles stand for significant association with below- and above-average climate, respectively.