Publié dans : Journal of Performance of Constructed Facilities, Vol. 31, Issue 3 (Octobre 2016) https://doi.org/10.1061/(ASCE)CF.1943-5509.0000960
Methods for shear strengthening of thick concrete slabs
1
Mathieu Fiset1, Josée Bastien2 and Denis Mitchell3 2
Abstract:
3
This paper presents different strengthening techniques to improve the shear capacity of existing 4
thick concrete slab structures that were constructed without shear reinforcement. Reinforcing 5
bars are installed into vertical drilled holes and anchored with epoxy adhesive to increase the 6
shear capacity. Experiments on retrofitted beams, representing slab strips, showed that all of the 7
strengthening techniques investigated resulted in increased shear capacities. The shear failure 8
mechanisms of the strengthened beams showed that, as expected, current evaluation methods for 9
elements with conventional, well-anchored stirrups can lead to an overestimation of the shear 10
capacities. The efficiency of the strengthening techniques is strongly influenced by the 11
performance of the end anchorage of the drilled-in bars. The effectiveness of the epoxy-bonded 12
bars is a function of their embedded length and they can, in some cases, debond before they 13
reach their yield strength. By using the maximum bar spacing required by the Canadian Highway 14
Bridge Design Code or the AASHTO-LRFD design specifications, bonded shear reinforcing bars 15
may debond and offer poor performance. A maximum transverse reinforcement spacing criterion 16
is therefore suggested for the added bonded bars. 17
18
1 Ph. D. Candidate, Research Center on Concrete Infrastructures, Dept. of Civil Engineering, Université Laval.,
Quebec city, QC, Canada, G1V 0A6 (Corresponding author). E-mail: [email protected]
2 Professor, Research Center on Concrete Infrastructures, Dept. of Civil Engineering, Université Laval., Quebec city,
QC, Canada, G1V 0A6. E-mail: [email protected]
Introduction
19
Concrete thick slab bridges typically have spans ranging from 6 m to 25 m (20’ to 80’) with a 20
structural slab thickness of 300 mm to 1500 mm (12 in. to 60”). For this simple structural 21
system, the thick slab is designed to carry all loads and therefore no support beams (girders) are 22
required. For the design of thick concrete slabs, it is often assumed that the shear capacity 23
provided by the concrete is sufficient to resist the shear and therefore, no shear reinforcement is 24
required. On September 30th, 2006, the Concorde overpass (Laval, Quebec, Canada) collapsed, 25
killing five people and injuring six others (Fig. 1). Even though the original design complied 26
with standards at the time of construction, a shear failure in the cantilever region of the 27
supporting concrete thick slab led to collapse (Johnson et al. 2007; Mitchell et al. 2011). This 28
shear failure occurred in the 1200 mm (48 in.) thick slab that did not contain any shear 29
reinforcement. The shear failure was very brittle and lead to the sudden collapse of one-half of 30
the overpass structure. For the Concorde overpass collapse, the investigation has shown that 31
concrete degradation with time resulted in the propagation of inclined cracks, followed by a 32
brittle shear failure. That tragic event raised questions concerning the safety of many aging thick 33
concrete slab bridges without shear reinforcement. Moreover, the investigation showed that the 34
provision of the minimum amount of shear reinforcement recommended by the 2014 Canadian 35
Highway Bridge Design Code S6 (CHBDC) (CSA 2014a) would have prevented the Concorde 36
overpass collapse. Because of the deficiencies in shear of this type of construction, practical 37
methods incorporating shear reinforcing bars into thick concrete slabs have gained wide interest. 38
Some shear strengthening methods have already been studied on narrow beams. The addition of 39
near surface mounted rods (De Lorenzis and Nanni 2001; Dias and Barros 2008) and the addition 40
of external carbon fiber reinforced plastic (FRP) laminates (Adhikary and Mutsuyoshi 2006; 41
Teng et al. 2009) have been proven successful to increase shear capacity. However, the 42
anchorage of such shear reinforcement on either side of a concrete beam section raised question 43
of their efficiency on the full width of wide structural elements like thick slab bridges. On one 44
hand, thin slabs strengthened in shear with bonded inclined drilled-in rods have shown their 45
efficiency to increase punching shear capacity (Fernández Ruiz et al. 2010). On the other hand, 46
very few studies were performed on the strengthening of existing thick slabs where the well 47
known “size effect” (Godat et al. 2010; Collins et al. 2008) will influence the shear capacity. 48
This paper presents shear strengthening techniques that can be used on existing concrete thick 49
slab structures to improve the shear capacity (Fig. 2). The loading tests performed as well as the 50
comparison between shear capacities of concrete thick slab strips (beams) strengthened and 51
unstrengthened in shear are presented. The techniques investigated consist of placing reinforcing 52
bars into pre-drilled vertical holes with epoxy bonding. The performance of this system has been 53
examined through experimental tests. The responses of the strengthened beams are compared to 54
tested reference beams, with conventional stirrups and without stirrups. 55
Description of Post-Installed Shear Strengthening methods
56
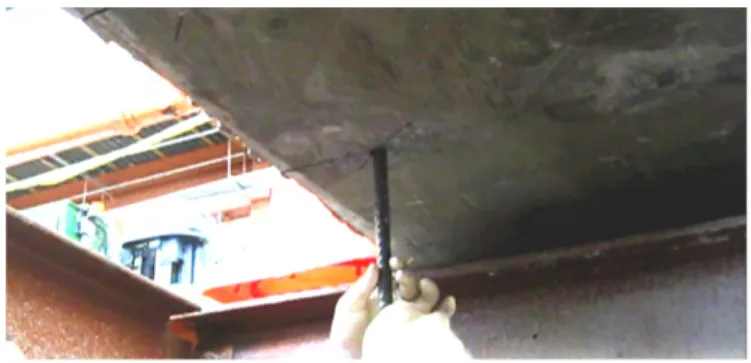
Fig. 2 shows the installation of two strengthening techniques. The first method (Fig. 2a) consists 57
of filling drilled holes with high-performance epoxy adhesive to bond the full length of steel bars 58
to the concrete. For this case, the holes are drilled from the top surface and the bars are inserted 59
into the epoxy-filled holes from the top. The alternative method (Fig. 2b) consists of introducing 60
the epoxy-bonded shear reinforcement from both the top and bottom slab faces, in order to 61
provide longer bar embedded lengths near the bottom surface. 62
Experimental Program
63
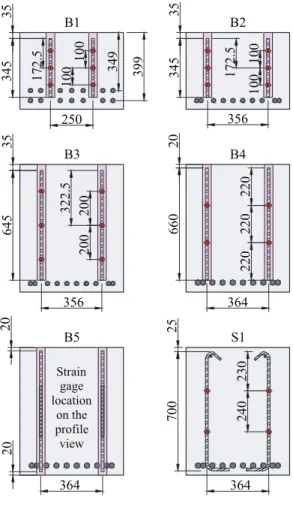
Two series of three point loading tests were performed for a total of 15 beams representing thick 64
slab strips (beams) which were designed to experience shear failures. All simply supported 65
beams (4000 mm span) have a rectangular cross section of 610 mm width, b , and constant w
66
heights, h , of 450 mm or 750 mm. Details of the beams are presented in Table 1 and Fig. 3. 67
Three reference specimens, (U1, U2, and U3), without shear reinforcement were also tested. 68
These beams are not shown in Fig. 3 but they have the same overall dimensions and flexural 69
reinforcement as the shear strengthened beams B1, B2 and B3. 70
Description of the 1st test series
71
Beam specimens U1, U2 and U3, and their companion beams with post-installed epoxy bonded 72
bars B1, B2 and B3 were designed to study the effectiveness of the bonded shear reinforcement 73
on the beam shear capacities. The spacing ratio, equal to the spacing of the bars, sv , divided by
74
the effective shear depth, dv, of the post-installed shear reinforcement is close to the maximum
75
allowed by North American Standards (kv max, sv max, /dv= 0.75 and 0.80 for CHBDC S6 (CSA 76
2014a) and AASHTO (2012) respectively). Beams B1 and B3 were strengthened using 15M 77
reinforcing bars whereas beam B2-1 and B2-2 were strengthened with 10M reinforcing bars 78
(refer to Table 2 for the bar area, A , and the bar diameter, b d ). These post-installed bars were b
79
introduced into 14.3 and 19.1 mm diameter holes for the 10M and 15M bars, respectively, and 80
bonded to the concrete with epoxy adhesive (Fig. 2a). The longitudinal reinforcement ratio is 81
presented in Table 1 and, for this first series of beams, 25M bars were used for longitudinal 82
tension reinforcement. 83
Description of the 2nd test series
84
Specimens of the second series, which were all strengthened in shear, provide results to compare 85
different reinforcing methods. Beams B4, B5 and S1 have transverse reinforcement spaced such 86
that the ratio kv sv/dvwas 0.61. Beam S1 is a typical reinforced concrete beam with 15M 87
conventional stirrups. Beams B4 and B5 were strengthened with vertical 15M epoxy-bonded 88
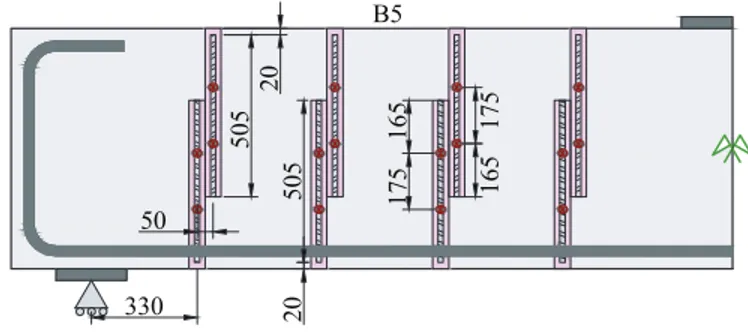
bars post-installed into 19.1 mm diameter holes. The post-installed bars in beam B4 were 89
installed from the top face of the beam, whereas they were installed from both top and bottom 90
faces for beam B5 (Fig. 3b). For this series, 30M bars were used for longitudinal tension 91
reinforcement in the beams. 92
Material Properties
93
The average compressive strengths of the concrete, fc', presented in Table 1 were determined at
94
an age at which the beams were tested. The maximum aggregate size of the concrete, ag, was 19 95
mm for all specimens and the concrete density, c, is presented in Table 1. The steel reinforcing 96
bars yielding strength, fy, and ultimate strength, f , are given in Table 2. For all bars, the u
97
Young modulus, E , was taken as 200 GPa. A commercially available epoxy adhesive was used s
98
for the bonded anchorage. The bond strength, b, of the epoxy adhesive was estimated as 99
(Fernández Ruiz et al 2010, ETA 2013): 100 0.1 ' 18.7 20 c b f in MPa units (1) 101
The development length, d, of the bonded bars with epoxy adhesive can therefore be evaluated 102
from Eq. (2). It varies between 90 and 97 mm for the 15M bars and is about 62 mm for the 10M 103
bars used for beam B2. 104 4 y b d b f d (2) 105
Testing procedure and measurements
106
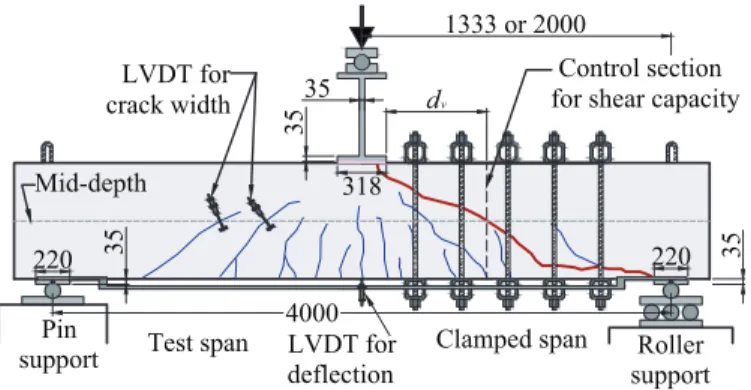
All beams were tested under three point loading. Fig. 4 shows the experimental setup for a 750 107
mm deep beam loaded at mid-span. For the 450 mm deep beams, the loading is applied at one-108
third of the span only (three point loading). The loading was applied at a rate of 10 mm/h and 109
beam deflections were measured at the loading location. Strain gages (red points in Fig. 3) were 110
used to measure strains in the shear and longitudinal reinforcing bars. LVDTs (Linear Variable 111
Differential Transformers) were installed on the side faces of the beams at mid-depth to measure 112
shear crack width development. A crack comparator was used to measure crack widths. After the 113
tests, concrete core samples were extracted from the beams and some beam sections were cut to 114
examine the anchorage quality of the bonded bars. 115
For the second test series, after the occurrence of shear failure, the beams were strengthened with 116
steel clamping devices as shown on the right hand side of Fig. 4. This allows the reloading of a 117
beam (40 mm/h) until the failure of the other half of the beam (left hand side of Fig. 4). To 118
distinguish between loading and reloading tests of the same beam, these reloaded beams are 119
identified as beams “R”, such as: B4-1R, B5-1R and S1-1R. 120
Test Results
121
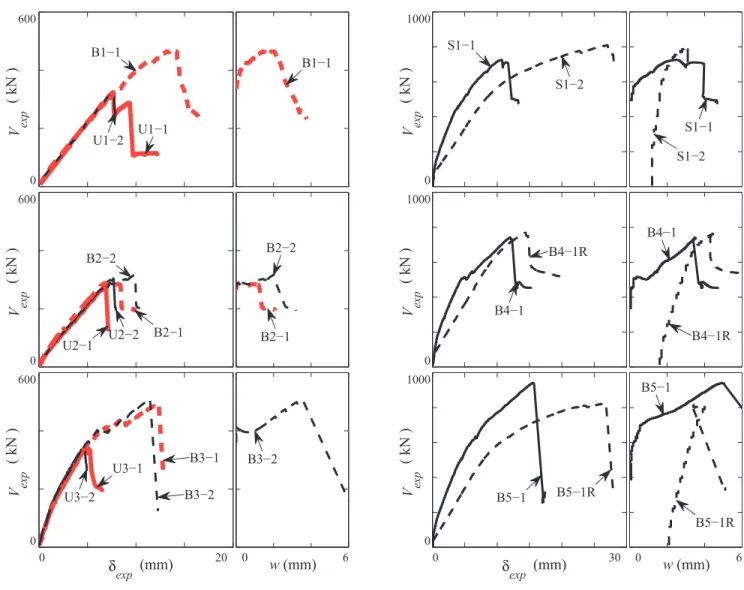
Table 1 provides a summary of the test results. In this table, the values of the experimental shear 122
force, Vexp, (including effects of beam self-weight) and the beam deflection, exp, measured at 123
the loading location (see Fig. 4) are given at failure. The applied shear versus expand the critical
124
crack width, w, are shown in Fig. 5. Due to failure of the data recording system, no data is 125
available for beam B1-2. Fig. 6 shows the cracking patterns for the half-portion of the beam 126
where the failure occurred. The critical failure cracks are shown with a bold line while the lighter 127
lines show other cracks having smaller crack widths. 128
Behavior of slab strips
129
Unstrengthened beams (Beams U1, U2 and U3)
130
As expected, beam specimens U1, U2 and U3 had only minor diagonal cracking up to the 131
maximum failure load. Shear failure occurred after the sudden formation of a critical inclined 132
crack and a horizontal splitting crack along the longitudinal reinforcement. These failures 133
occurred suddenly, with little or no warning. The shear strengths of beams U1, U2 and U3 were 134
324, 291 and 342 kN, respectively. The post-failure resistances were about 100 and 160 kN for 135
beam specimens U1 and U2, respectively. Beams U3 showed almost no post-failure resistance. 136
These tests demonstrate the danger associated with the sudden shear failure mode of concrete 137
thick slab structures without shear reinforcement. 138
Beam with conventional stirrups (Beam S1)
139
The main critical shear crack leading to failure was visible on both sides of beam S1 at a shear of 140
about 525 kN and this critical crack progressed slowly during the remaining loading. Beam S1-1 141
failed at a central deflection of 10.7 mm and a corresponding shear of 726 kN. With a post-142
failure resistance of 500 kN (decrease of 35%), beam S1-1 exhibited a larger residual shear 143
capacity than the other beams. The reloaded beam test S1-1R was stopped before the shear 144
failure because of the yielding of the steel clamped assemblies used on the other half span. The 145
shear capacity of the beam test S1-1R is therefore higher than 809 kN (see Table 1). 146
Beams with bonded shear reinforcing bars (Beams B1, B2, B3, B4)
147
The beams strengthened with drilled-in, bonded shear reinforcing bars exhibited rapid 148
propagation of a wide diagonal crack with a significant decrease of the beam stiffness. For 149
example, for beam B4-1, it can be observed in Fig. 5 that increasing the shear force by 34 kN 150
(508 to 542 kN) resulted in an increase in the central deflection by 1.9 mm (4.6 to 6.5 mm). For 151
this beam, a large crack of width 1.5 mm propagated from the support to the loading location, 152
crossing reinforcing bars R3 and R4 (see Fig. 6 for bar locations). For comparison, the diagonal 153
crack width in beam S1-1 at 525 kN was 0.3 mm and no cracking was visible crossing 154
reinforcing bars at location R3. For beams B1 and B3, a large critical diagonal crack appeared at 155
425 and 412 kN, respectively. Thereafter, new diagonal cracks appeared during the loading and 156
the maximum shear capacity of beams B1, B3 and B4 were 471, 498 and 756 kN, respectively. 157
By comparison with the unstrengthened beam specimens U1 and U3, the shear capacity of 158
strengthened beams B1 and B3 increased by about 45% and their deflections at failure increased 159
by 79% and 146%, respectively. 160
For beam B2-1, no shear crack was visible before the maximum shear capacity of 288 kN was 161
reached at a 6.8 mm deflection. At this load level, a diagonal crack appeared suddenly and the 162
shear force was maintained below the maximum capacity, at a shear of 285 kN, until a sudden 163
loss of the beam capacity, at a deflection of 8.4 mm. For beam B2-2, the shear force was 164
maintained after the propagation of the critical diagonal crack at a shear of 289 kN. The failure 165
of beam B2-2 occurred at a displacement of 9.8 mm and a shear of 315 kN. Compared with the 166
other beams with drilled-in bonded bars, beam B2 showed no additional shear cracking after the 167
propagation of the large diagonal crack. While the strengthening of this beam resulted in an 168
increase in shear capacity of only 4%, the maximum deflection is 25% higher than those 169
measured in the unstrengthened beams U2-1 and U2-2. 170
As expected, the failure modes of beams B1, B2 and B3, with bonded reinforcing bars, are less 171
brittle: beams B1, B2 and B3 showed signs of their pending failure with large diagonal cracks 172
and higher deformation and post failure capacities than their unstrengthened companion 173
specimens U1, U2 and U3. Likewise, beam B4 showed a similar post failure capacity of 450 kN 174
and a deflection capacity of 12.0 mm as beam S1 with conventional stirrups (500 kN and 10.7 175
mm). 176
Beam with overlapped bonded shear reinforcing bars (Beam B5)
Beam B5 with overlapped bonded bars shows more diagonal cracks than the other beams with 178
drilled-in bonded bars. Initially, the progression of most of the diagonal cracks was controlled in 179
the overlapped portion of the shear reinforcing bars. As the load increased, new diagonal cracks 180
appeared in this region. Before the failure, the development of a wide diagonal crack suggested 181
an imminent shear failure. The failure of beam B5-1 is very brittle and the concrete crushed in 182
the compression zone at a deflection of 15.6 mm and a shear of 942 kN. The reloaded beam B5-183
1R (tested after clamping the failed end) may have been weakened by the very brittle failure of 184
the beam B5-1 and the crushing of the compression zone resulting in a lower shear capacity of 185
823 kN. Therefore, the experimental capacity obtained for the reloaded beam B5-1R was not 186
used for comparison purposes. 187
Observation of internal cracking
188
After testing, the beams were dissected to enable inspection of the internal shear cracking and to 189
see the intersection of this cracking with the added shear reinforcing bars. Fig. 7 shows a view of 190
the inside of beam B5-1R that was strengthened with overlapping bars drilled-in from the top 191
and bottom and then bonded with epoxy. The gaps between the bottom end of bar R2t and the 192
top end of bars R3t and R4t indicate that slippage of the bars had occurred due to debonding. 193
This slippage was most apparent at locations where the shear crack resulted in short embedment 194
lengths of the drilled-in bars. 195
Behavior of shear reinforcing bars
196
Fig. 8 shows the average of the measured strain in two stirrup legs, sv, versus the central
197
deflection of the beams. The yield strain (y fy /Es) of the shear reinforcing bars is shown as a 198
dashed horizontal line. Table 3 shows the embedded lengths and the distance between the strain 199
gage and the main diagonal crack (L ). For beam S1-1, the values of L for stirrups R2, R3 and 200
R4 are 128, 30 and 133 mm, respectively. The bar embedded length e for the drilled-in bars is
201
taken as the shortest length between the main diagonal crack and the bar extremity. The 202
calculated bar development length, determined from Eq. (2), is shown. The maximum stress in 203
the bar layer fsv calc, is determined according to the bond strength determined from Eq. (1) and is 204
limited by the bar yielding strength. A linear stress-strain relationship, given by Eq. (4) is used to 205
determine the experimental bar stress fsv exp, . The maximum values are given in Table 3 according 206
to the maximum bar strain shown in Fig. 8. 207 , 4 b e sv calc y b f f d (3) 208 , sv exp s sv y f E f (4) 209
As seen in Fig. 8, strains in the bonded shear reinforcing bars only occurred after the shear 210
cracking load was reached. For beam B5-1 (Fig. 8), the propagation of two diagonal cracks 211
resulted in increased bar strains at a deflection of about 2.5 mm. The first diagonal crack 212
intercepted the bars at location R2b (see Fig. 6) and its propagation stopped, while the second 213
crack crossed the bars at locations R3b, R3t and R4t. Some beams with shear reinforcement 214
failed shortly after the yielding of one set of added reinforcing bars. The force that can be 215
developed in each bar is a function of the bar embedment length defined by the location of the 216
diagonal crack. When the diagonal crack intercepts a reinforcing bar close to one of its ends, the 217
resulting embedded length e could be shorter than d and therefore debonding would occur 218
without reaching fy. For example, it can be seen in Table 3 and Fig. 8 that the diagonal crack 219
occurred near the very end of the bar at location R2 of beam B1-1 resulting in a short embedded 220
length and consequently, this bar debonded. 221
In interpreting the strain readings, it is important to consider the fact that the reinforcing bar 222
strain will be at its highest at a crack location. Thus, even if e d , it can be seen in Fig. 8 and
223
Table 3 that some of the measured strains in the shear reinforcing bars were below y. However, 224
it can be expected that these bars had reached their yield strain at crack locations. 225
The debonding of some bonded bars can also be seen in Fig. 8. For example, the bars at location 226
R2 in beam B1-1 experienced increasing strains until a maximum of 1659 microstrain ( fsv exp, =
227
332 MPa) at exp= 9.9 mm. This was followed by decreasing strains until 652 microstrain (fsv exp, =
228
130 MPa) at the beam failure (exp= 13.7 mm). It can be seen in Table 3 that the maximum 229
predicted bar stress fsv calc, of 242 MPa from Eq. (3) underestimates the experimental value of 332
230
MPa. 231
For beam S1-1 with conventional stirrups, the bars at locations R2 and R3 reached their yield 232
strength at a central deflection of 5.7 mm. This is followed by a large increase in the strain of the 233
bars at location R4, reaching a maximum strain 2040 microstrain (408 MPa) at a deflection of 234
9.9 mm. While the strain gages on the bar at location R4 showed strains below the yield strain, it 235
is possible that this reinforcement yielded at the crack location. For this case, Ltc=133 mm and 236
hence these bars may have reached fy. Comparedwith beam B4, the conventional stirrup legs in
237
beam S1 are well anchored at both extremities. They cannot slip like the drilled-in bonded bars 238
and therefore, they offer better control of the diagonal cracking. Thus, if the diagonal crack 239
crosses a stirrup near the extremities of the stirrup legs, they are still capable of developing their 240
yield capacity. 241
Comparison with strength predictions and discussion
242
The predicted shear capacity Vcalc was determined at a distance d from the edge of the loading v
243
plate. The shear design provisions of the Canadian Standards Association (CSA) standard A23.3 244
(CSA 2014b), the Canadian Highway Bridge Design Code S6 (CSA 2014a) and the AASHTO 245
specifications (AASHTO 2012) are based on the Modified Compression Field Theory (Collins et 246
al. 1996; Bentz and Collins 2004). These requirements define the nominal shear strength 247
attributed to the concrete, V , and the shear resistance provided by the shear reinforcement, c V . s
248
The equations from CSA standard A23.3 (CSA 2014b), expressed in SI units, are given below 249
for the nominal shear resistance (i.e., material resistance factors c s 1). 250 ' c c w v V f b d in MPa units (5) 251 0.4 1300 1 1500 x 1000 sze mm (6) 252 cot v s v y v d V A f s (7) 253
Where Av is the area of transverse reinforcement within a distance s and v is the ability of the
254
diagonally cracked concrete to resist shear by tension stiffening and aggregate interlock (Eq. (6) 255
). It is a function of the longitudinal strain,x, at mid-depth of the beam and the equivalent
256
horizontal crack spacing, s . For concrete members without transverse reinforcement, ze
257
35 16
ze v g
s d a (mm units). For members containing at least the minimum amount of 258
transverse reinforcement, the equivalent crack spacing parameter s is taken as 300 mm (12 in). ze
259
This minimum amount of transverse reinforcement is determined from Eq. (8), where C = 0.060 260
for both the CSA S6 code (2014a) and the CSA standard A23.3 (2014b), while C = 0.083, in 261
MPa units for AASHTO specifications (2012). 262 ' c v v w y f A C s b f (8) 263
The angle of principal compression in the concrete, , with respect to the longitudinal member 264
axis can be used to determine the number of effective transverse reinforcing bars, n , resisting v
265 shear. 266 cot v v v d n s (9) 267
Unstrengthened beams (Beams U1, U2 and U3)
268
The calculated shear strength Vcalcand the experimental shear capacity Vexpare given in Table 1. 269
The concrete nominal shear stress at failure (vc Vexp/ (b dw v)) shows the size effect 270
phenomenon for beams without shear reinforcement. With an effective shear depth, d , of 333 v
271
mm and 359 mm respectively, beams U1 and U2 experienced a shear stress at failure of 1.59 272
MPa and 1.33 MPa, respectively, whereas the shear stress at failure of the deepest beam 273
specimens U3 (d = 629 mm) failed at a lower shear stress of 0.89 MPa. A good correlation v
274
between experimental results and calculated values is achieved with the calculated shear 275
capacity, Vcalc, for the beams without shear reinforcement being close to Vexp (average 276
/
calc exp
V V = 1.00). 277
Beam with conventional stirrups (Beam S1)
278
For both tests on the beams S1-1 (tests S1 for the first loading and S1-1R for the reloading) with 279
stirrups, the predictions are very close to the experimental shear capacities. The average ratio 280
/
calc exp
V V is 1.05 while the predicted amount of shear reinforcing bars crossed by the diagonal 281
crack n is 2.35. These results are in good agreement with the cracking patterns shown in Fig. 6, v
282
where the main diagonal crack crossed 3 and 2 bar locations for beams S1-1 and S1-1R, 283
respectively. 284
Beams with bonded shear reinforcing bars (Beams B1, B2, B3 and B4)
285
For the beam specimens with epoxy bonded shear reinforcing bars, the predicted shear strengths 286
provided by the bonded shear reinforcing bars are determined from Eq. (7). The experimental 287
cracking patterns showed that the main diagonal crack crossed 2 reinforcing bar locations for 288
beams B2, B3 and B4-1 and 3 locations for beams B1 and B4-1R. Comparing these observations 289
with the values of n indicates reasonable predictions of the amount of transverse reinforcement v
290
resisting shear. However, with the assumption that the added bars yield, the shear capacities of 291
beams B1, B2 and B3 are overestimated (Vcalc /Vexp= 1.28, 1.42 and 1.41, respectively) while for
292
beam B4 Vcalc /Vexp= 1.07. 293
Previous measurements showed that bonded bars can fail by debonding before reaching fy when 294
e d and hence some adjustments are necessary to account for this important effect. As shown
295
in Table 3, all the bonded shear reinforcing bars of beams B4 were able to fully develop their 296
yield strength and therefore, beam B4-1 and B4-1R had a similar behavior to the beam with 297
stirrups and the predicted shear capacity is close to the experimental shear capacity. For beams 298
B1, B2 and B3, a number of bonded bars have partially contributed to the shear capacity due to 299
the fact that a crack crossing a bar within d may lead to the debonding of the bar. As illustrated
300
in Fig. 9, the length y along a bar where a crossing diagonal crack would allow the
301
development of fy in the bar can be defined as:
302
2
y bar d (10)
303
Where baris the bar length and d is the bar development length defined by Eq. (2). A diagonal 304
crack is more likely to cross within y for small spacings and for long bonded bars. The bar
efficiency ratio in shear can be defined as follows: 306 y v d (11) 307
By comparing beams with similar bar development lengths, the bars used for beam B1 and B2 308
( bar= 345 mm) are shorter than the bars used for beams B3 ( bar= 645 mm) and B4 ( bar= 660 309
mm). According to the d values presented in Table 3, the bar efficiency ratio of these beams 310
are 0.45, 0.64, 0.72 and 0.77, respectively. The longer bars used for beams B3 and B4 are 311
therefore more efficient than the bars used for beams B1 and B2. 312
A small shear reinforcement spacing ratio kvsv/dvalso enables the diagonal crack to cross a 313
larger number of shear reinforcing bars within the yielding length, y. For beams B1, B2 and
314
B3, the sv/d values were close to the maximum allowed by standards (0.75 for the S6 code v
315
(CSA 2014a) and 0.80 for AASHTO (2012)). Consequently, the main shear cracks intercepted 316
two bar locations near their extremities. However, for beam B4, the smaller ratio k of 0.61 v
317
allowed the main diagonal crack to cross two bar locations within y, with one being intercepted
318
at its mid-height. 319
Beam with overlapped bonded shear reinforcing bars (Beam B5)
320
For the shear capacity of beam B5, the overlapped area of shear reinforcing bars is neglected 321
(Av 400 mm²). The experimental cracking patterns showed that the main diagonal crack 322
crossed 2 reinforcing bar locations, which is similar to the prediction of n = 2.35. However, the v
323
prediction underestimates the shear capacity for beam B5-1 (Vcalc/Vexp= 0.85). This 324
underestimation can be explained by the overlapping of the bonded bars. The lap length of 300 325
mm is longer than twice the development length ( 2 d=182 mm in the epoxy-filled hole). The bar 326
efficiency ratio is 1.03 for each pair of overlapped bars and hence the effective bar capacity is 327
higher than A fv y. As shown in Table 3 for beam B5-1, the yield force of bars R3b was fully
328
developed while the bars R3t reached a maximum stress of 192 MPa (0.426A fv y) (Table 3). 329
Thus, the two bars R3t and R3b are able to carry a total of 256 kN (1.426A fv y) instead of 179 kN 330
(A fv y) assuming Av 400 mm². In addition, beam B5 has shown a larger number of diagonal 331
cracks in the overlapped bar region than the other beams. The reduction of the crack spacing in 332
the lapped region would likely increase V for beam B5. c
333
Maximum spacing of added bonded bars
334
The experimental results of the beams with added bonded shear reinforcing bars have shown that 335
the maximum bar spacing needs to be smaller than that required in current codes for stirrups. 336
According to current codes (CSA S6 (2014a), CSA A23.3 (2014b) and AASHTO (2012)), 337
stirrups shall be spaced so that every line inclined at an angle to the axis of the member and 338
extending toward the reaction from mid-depth to the member longitudinal flexural tension 339
reinforcement shall be crossed by at least one line of effective shear reinforcement. Over the full 340
shear depth, d , of the beam, a minimum of two stirrups intercepting the inclined compression v
341
field are therefore required. This enables the development of the compression field between two 342
transverse bars carrying tension. The maximum spacing ratio kv max, and the maximum spacing 343
,
v max
s of transverse reinforcement can therefore be determined as follow: 344 , , 1 2 tan v max v max v s k d (12) 345
For example, for an angle of 34°, kv max, = 0.75 as defined by the Canadian Highway Bridge 346
Design Code S6 (CSA 2014a). For bonded bars, the location of the crack determines the bar 347
embedded length and the bar capacity. For a diagonal crack crossing within the bar yielding 348
length y, the transverse reinforcement can reach its yield strength. For cracks crossing within 349
length d, partial contribution of the bar is expected. By assuming a constant bond strength 350
along the development length of the bars, the tensile stress f that can be developed in the sv
351
transverse bonded reinforcement can be determined by Eq. (13), where y is the smallest 352
distance measured from the bar extremity (see Fig. 9). 353 4 b sv y b y f f d (13) 354
The resulting tensile stress distribution in the bonded bars is illustrated in Fig. 9. To meet the 355
maximum spacing requirement, this figure shows how the bonded bars can develop A fv y in both 356
lower and upper parts of the beam. The maximum spacing of transverse bonded reinforcement 357
can therefore be determined by Eq. (14). 358
, , ,
v max v max y v max v
s k k d (14)
359
Note that using kv max, y svkv max, bar results in partial development of the vertical bars. By 360
taking into account the efficiency ratio from Eq. (11), the maximum spacing ratio of bonded 361
transverse reinforcement can be rewritten as: 362 , , v max v max v s k d (15) 363
Where is defined by Eq.(11) and is not greater than 1. Because d is a constant for a given 364
bonded bar, its efficiency ratio increases as the depth of the slab increases. For shallower slabs, it 365
would be required to use mechanical anchorages at the extremities of the added bars to avoid 366
debonding, or to use inclined bonded bars to increase their embedded length. 367
From Eq. (15) and kv sv y, k = 1.60, 1.18, 1.04, 0.79 and 0.61 for beams B1, B2, B3, B4 and v
368
B5 respectively. Beams B4 and B5 are the only ones meeting the standards requirement (kv max, = 369
0.75 and 0.80 for the CSA S6 code (2014a) and AASHTO specifications (2012), respectively) 370
while, the transverse bar spacing of the other beams enables partial development of the bonded 371
bars (kv max, y sv kv max, bar). Consequently, the responses of beams B4 and B5 were similar to 372
the beam with stirrups while the shear capacities of the other beams were lower than the ones 373
predicted based on specifications for members with conventional stirrups. 374
Conclusions
375
Experiments were carried out on thick concrete slab strips (beams) to evaluate the efficiency of 376
different shear strengthening techniques. The shear capacities were compared to the predictions 377
using current design provisions for elements with or without conventional transverse 378
reinforcements (stirrups). The experimental results showed that: 379
1. The strengthening techniques resulted in increased shear and deflection capacities 380
compared to beams without shear reinforcement. 381
2. The beams with added epoxy-bonded bars experienced a rapid propagation of the critical 382
diagonal crack. This resulted in a decrease of stiffness compared with the beams 383
reinforced with conventional stirrups. 384
3. Short embedded bonded bars ( e d ) failed by debonding at the ends of the bars before 385
reaching fy and hence adjustments are needed to accurately predict the strength by using
386
current code provisions that assume yielding of the transverse reinforcement. 387
4. Closely spaced longer bonded bars are more likely to result in yielding of the added 388
epoxy-bonded bars. In such cases, beams exhibit a similar behavior to beams with 389
stirrups and the predictions using current code provisions accurately predict the shear 390
strength. 391
5. For added epoxy bonded bars, the maximum spacing required by the current codes for 392
conventional stirrups can result in an overestimation of the shear capacity of up to 48%. 393
Therefore, a maximum spacing requirement for transverse bonded bars has been 394
proposed. 395
6. The predicted shear capacities using current code provisions for the beams respecting the 396
proposed maximum spacing requirement of the transverse bonded reinforcement (Eq. 397
(15)) agree well with the experimental results. 398
Acknowledgments
399
The research reported in this paper was made possible by funding from the Natural Sciences and 400
Engineering Research Council of Canada (NSERC, CREATE-INFRA) and the “Fonds de 401
Recherche du Québec – Nature et Technologies” (FRQNT). The authors also acknowledge the 402
contributions of Philippe Provencher and Benoit Cusson who performed the beam tests. The 403
experiments were carried out in the structures laboratory at Université Laval. 404
Notation
406
The following symbols are used in this paper: 407
s
A = area of longitudinal reinforcement on the flexural tension side; 408
v
A = area of shear reinforcement within a distance s ; v
409
w
b = beam web width; 410
d = effective depth to the main tension reinforcement; 411
b
d = reinforcing bar diameter; 412
v
d = effective shear depth, taken as the greater of 0.9d and 0.72h; 413
s
E = modulus of elasticity of steel; 414
'
c
f = concrete cylinder compressive strength; 415
sv
f = stress in transverse reinforcement; 416
y
f = yield strength of reinforcement; 417
v
k = spacing ratio of transverse reinforcement; 418
bar = length of added shear reinforcing bar;
419
d = bar tension development length;
420
e = bar embedded length;
421
y = bar yielding length, equal to bar2 d;
422
v
n = number of effective transverse reinforcing bars; 423
v
s = spacing of transverse reinforcement taken along the member longitudinal axis; 424
ze
s = equivalent longitudinal crack spacing; 425
c
V = shear resistance attributed to the concrete; 426
s
V = shear resistance provided by shear reinforcement; 427
= factor accounting for shear resistance of cracked concrete; 428
c
= concrete density (kN/m³); 429
sv
= strain in transverse reinforcement; 430
x
= longitudinal strain at mid-depth of the member; 431
= bonded bar efficiency ratio in shear; 432
= angle of diagonal compressive stresses to the longitudinal axis of the member; 433
= longitudinal reinforcement ratio, equal to As/b d for a rectangular beam; and w
434
b
= bond strength of the adhesive (MPa). 435
References
437
Adhikary, B. B., and Mutsuyoshi, H. (2006). “Shear strengthening of reinforced concrete beams 438
using various techniques.” Constr. Build. Mater., 20(6), 366-373. 439
American Association of State Highway and Transportation Officials (AASHTO). (2012). 440
“AASHTO-LRFD bridge design specifications.” Washington, D.C. 441
Bentz, E.C. and Collins, M.P., “Development of the 2004 CSA A23.3 Shear provisions for 442
reinforced concrete,” Can. J. Civ. Eng., 33(5), 521-534. 443
Canadian Standards Association (CSA). (2014a). “Canadian highway bridge design code.” CSA 444
S6-14, Mississauga, ON, Canada.
445
Canadian Standards Association (CSA). (2014b). “Design of concrete structures.” CSA A23.3-446
14, Mississauga, ON, Canada.
447
Collins, M. P., Bentz, E. C., and Sherwood, E. G. (2008). “Where is shear reinforcement 448
required? Review of research results and design procedures.” ACI Struct. J., 105(5), 590-599. 449
Collins, M.P., Mitchell, D., Adebar, P. and Vecchio, F.J. (1996), “A general shear design 450
method”, ACI Struct. J., 93 (1), 36-45. 451
De Lorenzis, L., and Nanni, A. (2001). “Shear strengthening of reinforced concrete beams with 452
near-surface mounted fiber-reinforced polymer rods.” ACI Struct. J., 98(1), 60-68. 453
Dias, S. J. E., and Barros, J. A. O. (2008). “Shear strengthening of T cross section reinforced 454
concrete beams by near-surface mounted technique.” J. Compos. Constr., 10.1061/(ASCE) 1090-455
0268. (2008)12:3(300). 456
European Technical Approval (ETA). (2013). “Injection system hilti HIT-RE 500.” ETA-457
04/0027, Deutsches Institut für Bautechnik, Berlin, Germany.
458
Fernández Ruiz, M., Muttoni, A., and Kunz, J. (2010). “Strengthening of flat slabs against 459
punching shear using post-installed shear reinforcement.” ACI Struct. J., 107(4), 434-442. 460
Godat, A., Qu, Z., Lu, X. Z., Labossière, P., Ye, L. P., and Neale, K.W. (2010). “Size effects for 461
reinforced concrete beams strengthened in shear with CFRP strips.” J. Compos. Const., 462
10.1061/(ASCE)CC.1943-5614.0000072. 463
Johnson, P. M., Couture, A., and Nicolet, R. (2007). “Commission of inquiry into the collapse of 464
a portion of the de la Concorde overpass.” Library and National Archives of Quebec. 465
〈http://www.cevc.gouv.qc.ca/UserFiles/File/Rapport/report_eng.pdf〉 (Jan. 2015). 466
Mitchell, D., Marchand, J., Croteau, P., and Cook, W. D. (2011). “Concorde overpass collapse: 467
structural aspects.” J. Perform. Constr. Facil., 10.1061/(ASCE)CF.1943-5509.0000183. 468
Teng, J. G., Chen, G. M., Chen, J. F., Rosenboom, O. A., and Lam, L. (2009). “Behavior of RC 469
beams shear strengthened with bonded or unbonded FRP wraps.” J. Compos. Const., 470
10.1061/(ASCE) CC.1943-5614.0000040. 471
Table 1. Main properties of tested specimens and comparison to the predicted shear capacities.
Beam designation
Strengthening technique
h d d v A v s v s d v v c f c Vexp exp V c nv V s Vcalc calc
exp V V mm mm % mm mm2 mm kN/m³ MPa kN mm kN kN Strengthened slabs B1 1 Bonded 450 370 3.10 333 400 240 0.72 22.3 31.7 471 13.7 212 2.03 390 602 1.28 2 22.3 33.5 - - 217 2.03 389 606 - B2 1 Bonded 450 399 2.05 359 200 260 0.72 22.5 34.3 288 8.4 248 2.05 179 426 1.48 2 22.6 35.5 315 9.8 251 2.05 179 429 1.36 B3 1 Bonded 750 699 1.17 629 400 470 0.75 22.7 34.0 491 12.3 349 1.82 350 699 1.42 2 22.4 37.2 505 11.4 361 1.82 349 710 1.40 B4 1 Bonded 750 694 1.65 625 400 380 0.61 22.6 34.5 743 12.0 389 2.34 420 809 1.09 1R 769 14.4 389 2.34 420 809 1.05 B5 1 Overlapped 750 694 1.65 625 400 380 0.61 22.6 32.6 942 15.6 380 2.35 421 801 0.85 1R Bonded 823 26.3 380 2.35 421 801 0.97 S1 1 Stirrups 750 694 1.65 625 400 380 0.61 22.2 33.3 726 10.7 383 2.35 421 804 1.11 1R 809 27.1 383 2.35 421 804 0.99 Unstrengthened slabs Average 1.22 CoV 0.17 U1 1 none 450 370 3.10 333 - - - 22.3 31.1 324 7.6 285 - - 285 0.88 2 22.3 33.7 324 7.7 293 293 0.90 U2 1 none 450 399 2.05 359 - - - 22.5 34.9 278 6.9 287 - - 287 1.03 2 22.6 35.7 304 7.7 289 289 0.95 U3 1 none 750 699 1.17 629 - - - 22.4 35.8 343 5.0 389 - - 389 1.13 2 22.7 33.2 341 4.6 379 379 1.11 Average 1.00 CoV 0.11 Note: beams U1, U2, B1 and B2 are loaded at one-third span, while other beams are loaded at mid-span. To distinguish between loading and reloading tests of the same beam, reloaded beams are identified “R”. For all beams, width bw = 610 mm
aThis beam did not experience shear failure. The capacity was limited by the steel clamped assemblies used to strengthen beam S1-1
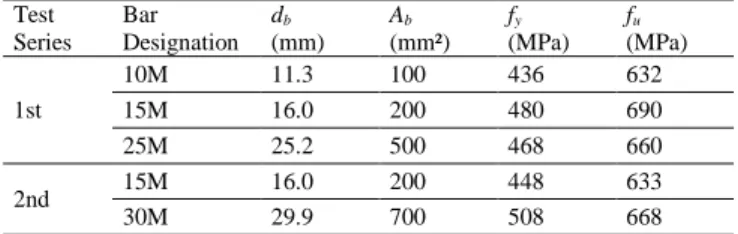
Table 2. Steel reinforcing bars properties Test Series Bar Designation db (mm) Ab (mm²) fy (MPa) fu (MPa) 1st 10M 11.3 100 436 632 15M 16.0 200 480 690 25M 25.2 500 468 660 2nd 15M 16.0 200 448 633 30M 29.9 700 508 668
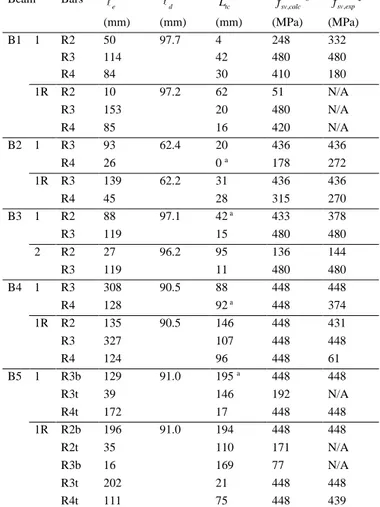
Table 3. Bonded bars embedded length and bar stress Beam Bars e d L tc fsv calc, b , sv exp f c (mm) (mm) (mm) (MPa) (MPa) B1 1 R2 50 97.7 4 248 332 R3 114 42 480 480 R4 84 30 410 180 1R R2 10 97.2 62 51 N/A R3 153 20 480 N/A R4 85 16 420 N/A B2 1 R3 93 62.4 20 436 436 R4 26 0 a 178 272 1R R3 139 62.2 31 436 436 R4 45 28 315 270 B3 1 R2 88 97.1 42 a 433 378 R3 119 15 480 480 2 R2 27 96.2 95 136 144 R3 119 11 480 480 B4 1 R3 308 90.5 88 448 448 R4 128 92 a 448 374 1R R2 135 90.5 146 448 431 R3 327 107 448 448 R4 124 96 448 61 B5 1 R3b 129 91.0 195 a 448 448 R3t 39 146 192 N/A R4t 172 17 448 448 1R R2b 196 91.0 194 448 448 R2t 35 110 171 N/A R3b 16 169 77 N/A R3t 202 21 448 448 R4t 111 75 448 439
a Several cracks cross the transverse reinforcing bar. The bar embedded length
and the relative distance to the strain gage are not measured with the same crack.
b Determined with Eq. 3.
c Determined with Eq. 4 and the maximum measured bar strain in Fig. 8.
364 364 364 356 660 35 345 645 20 B5 100 172.5 100 200 200 322.5 B4 B3 230 240 S1 B2 B1 Strain gage location on the profile view 356 250 20 345 35 20 35 700 100 100 220 220 172.5 220 25 349 399
505 505 20 20 165 165 175 175 330 50 B5
35
35
220 318
Test span Clamped span
35 LVDT for crack width Pin support Mid-depth Roller support LVDT for deflection 220 35 4000 Control section for shear capacity
dv
1333 or 2000
( kN ) V exp 0 600 ( kN ) V exp 0 1000 ( kN ) V exp 0 600 ( kN ) V exp 0 1000 ( kN ) V exp 0 600 0 20 δexp (mm) 0 w (mm) 6 ( kN ) V exp 0 1000 0 30 δexp (mm) 0 w (mm) 6 U1−1 U1−2 B1−1 B1−1 S1−1 S1−1 S1−2 S1−2 U2−1 U2−2 B2−1 B2−1 B2−2 B2−2 B4−1 B4−1 B4−1R B4−1R U3−1 U3−2 B3−1 B3−2 B3−2 B5−1 B5−1 B5−1R B5−1R
U1-1 U1-2 B1-1 B1-2 U2-1 U2-2 B2-1 B2-2 U3-1 B3-2 U3-2 B3-1 B4-1 B5-1 S1-1 S1-1R B5-1R B4-1R R1 R4 R4b R1 R2 R3 R4 R1 R2 R3 R4 R1 R2 R3 R1 R2 R3 R4 R1t R2t R3t R4t R2 R3 R1b R2b R3b R1 R2 R3 R4 R1 R2 R3 R4 R1 R2 R3 R1 R2 R3 R4 R1 R2 R3 R4 R1t R2t R3t R4t R4b R1b R2b R3b
R3t
R4t
R2t
R3t
R4t
( × 10 −6 ) ε sv 0 2500 ( kN ) V exp 0 1000 ( × 10 −6 ) ε sv 0 2500 0 δ 20 exp ( mm ) 0 δexp ( mm ) 20 ( kN ) V exp 0 1000 0 δ 20 exp ( mm ) R2 R3 R4 Bar strain εy B1−1 Load B2−1 B3−1 B4−1 B5−1 S1−1
θ Bonded bar Bond strength fsv=fy τb ld ly fsv ld dv 2 sv,max sv,max ld tan(θ) M V fsv<fy y y
Figure caption list
1
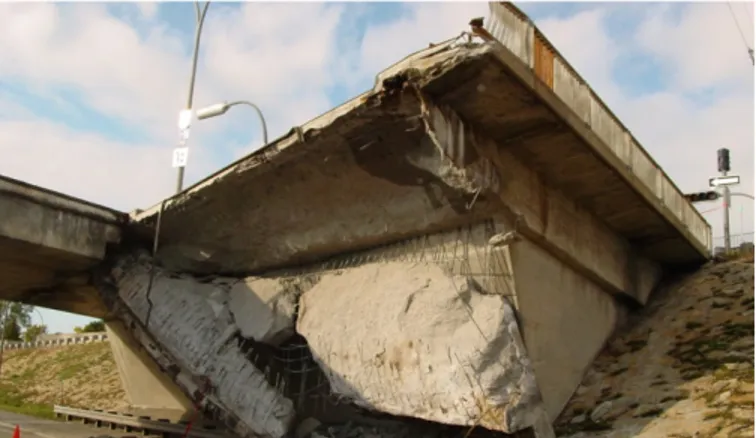
Fig. 1. Partial collapse of south portion of Concorde Overpass due to shear failure of thick slab
2
(a) Aerial view of south portion (with permission Johnson et al. 2007) and (b) Shear failure of 3
thick slab that started near southeast corner (image by D. Mitchell) 4
Fig. 2. Installation of the epoxy bonded bars (a) from the top beam surface and (b) from the
5
bottom beam surface (image by J. Bastien) 6
Fig. 3. (a) Tested strengthened slab slices specimens (b) Profile view of beam B5 (dimensions in
7
mm) 8
Fig. 4. Experimental setup for reloading (R) stage (dimensions in mm)
9
Fig. 5. Load Vexp and critical shear crack width w vs beam deflection curves δexp
10
Fig. 6. Cracking pattern of tested beam
11
Fig. 7. Profile cut section of beam test B5-1R (a) Overall view of internal shear crack (b)
Close-12
up of shear failure crack (image by J. Bastien) 13
Fig. 8. Strain of shear reinforcing bars near the main shear crack and applied load vs beam
14
deflection (for beam B5-1, bars R2, R3 and R4 refer to R2b, R3b and R4t) 15
Fig. 9. Maximum bar spacing for beam with bonded shear reinforcing bars
16 17 Figure Caption List