HAL Id: hal-01911631
https://hal.archives-ouvertes.fr/hal-01911631
Submitted on 2 Nov 2018
HAL is a multi-disciplinary open access
archive for the deposit and dissemination of
sci-entific research documents, whether they are
pub-lished or not. The documents may come from
teaching and research institutions in France or
abroad, or from public or private research centers.
L’archive ouverte pluridisciplinaire HAL, est
destinée au dépôt et à la diffusion de documents
scientifiques de niveau recherche, publiés ou non,
émanant des établissements d’enseignement et de
recherche français ou étrangers, des laboratoires
publics ou privés.
Big Data: An incoming challenge for vehicular ad-hoc
networking
Emilien Bourdy, Kandaraj Piamrat, Michel Herbin
To cite this version:
Emilien Bourdy, Kandaraj Piamrat, Michel Herbin. Big Data: An incoming challenge for vehicular
ad-hoc networking. Internet Technology Letters, Wiley, 2019, 2 (2), pp.e82. �10.1002/itl2.82�.
�hal-01911631�
DOI: xxx/xxxx
ARTICLE TYPE
Big Data: an incoming challenge for VANET
Emilien Bourdy*
1| Kandaraj Piamrat
2| Michel Herbin
11CReSTIC, Université de Reims
Champagne-Ardenne, Reims, France
2LS2N, Université de Nantes, Nantes, France
Correspondence
Present Address
CReSTIC, UFR Sciences Exactes et Naturelles, Moulin de la Housse, 51867 Reims, France
Summary
Big Data is gaining lots of attentions from various research communities as massive data are becoming real issues and processing such data is now possible thanks to available high-computation capacity of today’s equipment. This paper focuses espe-cially on the network community where currently huge amount of data have to be processed in real time. In the meanwhile, it is also the beginning of Vehicular Ad-hoc Networking (VANET) era. Connected vehicles are being manufactured and will become an important part of vehicle market. Topology in this type of network is in constant evolution, accompanied by massive data coming from increasing volume of connected vehicles in the network. Therefore, we will handle this interesting topic by providing backgrounds on Big Data concerning vehicular networks. Key aspects of Big Data related to VANET (e.g., data generation, preprocessing, and communi-cation) are discussed. Finally, we will also illustrate how to analyze data in VANET by presenting a real experimentation and some representatives results.
KEYWORDS:
Big Data, VANET, ITS, IoT
1
INTRODUCTION
Over the past few years, the volume of data has increased tremendously and in a very large scale within various domains, particularly, in vehicles with cooperative Intelligent Transport Systems (ITS). We can observe the emergence of connected vehicles, which will generate a huge amount of data in the near future1,2. In Vehicular Ad-hoc Network (VANET), the data are
generated either from the infrastructure by the Road Side Unit (RSU), or from the vehicles themselves by the On-Board Unit (OBU). RSU and OBU communicate with each other using IEEE 802.11p (vehicular Wi-Fi)3standard, which is called ITS-G5
in Europe. With a prediction of 35 % of market share among vehicles that will be marketed in 2022 along with revenues of around 113 billion euros4,5, ITS data volume is becoming massive in such a way that they can generally be considered as Big
Data6,7, and they will have the same problematic. The VANET topology is a highly dynamic topology, which is an important
challenge for the underlying mechanisms and algorithms, and so, classical algorithms may be inefficient.
Big Data comes generally with the 4 V (see the Fig. 1 ): Variety, Velocity, Veracity and Volume8. Variety means that generated
data change from a station to another. Velocity means that data from a station change quickly. Veracity means that data are coherent with the situation (for example, a vehicle located in Paris will not indicate in position in New York). Finally, Volume means that there is a huge amount of data, so they cannot be analyzed by classical computers. Big Data analysis consists in four main steps8: 1-data generation (section 2); 2-preprocessing to reduce volume of data (section 3); 3-communication of the
data to the infrastructure (section 4); 4-storage and analysis in the data-centers, which is not the focus in this paper, because it is very closed to “classical” Big Data mechanisms. We will also illustrate a practical example of using Big Data methodology with VANET in section 5 before concluding in section 6.
2 Emilien BourdyET AL
• Data collection and analysis must be rapidly and timely conducted • Forms • Diversity of collected points • Data format • Bots • Heterogeneity of data including structured and semi-/ unstructured data
• Data scale becomes increasingly big
Velocity
Volume
Veracity
Variety
FIGURE 1 The 4V of Big Data
• 10 messages per second
• Values change for each message
• Needs of coherent values • Options • Number of brands • 10 messages per vehicle per second
Velocity
Volume
Veracity
Variety
FIGURE 2 The 4V of VANET
2
DATA GENERATION
In general, there are two types of data in VANET: message data and sensor data (e.g. raw data from camera, radar, etc.). Message data are deployed for cooperative driving and sensor data for helping driver to make a decision or to analyze driver’s behavior within a specific situation. If a vehicle hidden by an obstacle makes an emergency braking, the other vehicles will receive the event (through a Decentralized Environmental Notification Message (DENM9)) sent by the braking vehicle and brake
automatically before the driver reacts. Message data also enable drivers to be aware of invisible information like transportation of specific objects (i.e. eggs, animals, baby, etc.). A simple example is a truck carrying dangerous goods that will be displayed in Cooperative Awareness Messages (CAM9, an application layer beacon used to inform neighbors about the ITS station
(ITS-S) position). These are few examples among so many others of VANET’s usage. Automatic Breaking System (AB(ITS-S) and cruise control are examples of driving assistance systems that can be activated in this situation. As for sensor data, if a vehicle knows that the road is slippery by noticing that the braking is not efficient or by observing high level of humidity, this vehicle can send a message to other vehicles that do not have this information, and hence all the neighborhoods can be aware of the situation.
Data generation from VANET according to the 4V is summarized in Fig. 2 :
1. Variety: Different ITS manufacturers implement standard in different ways (e.g. some manufacturers have access to CAN bus and some others not).
2. Velocity: With a frequency of 1 to 10 messages per second for each vehicle, and for each message, some data will change from one message to another like position, timestamp, speed, etc.
3. Veracity: All data need to be coherent with the situation to have an efficient cooperative ITS.
4. Volume: With all data generated from messages and sensors and the number of vehicles, data volume increases fast. In4,5, the authors predict that connected vehicle market will grow from 5 million units to 35 % of the vehicle marketed in 2022 along with revenues of around 113 billion euros.
3
PREPROCESSING
• Message preprocessing
According to CAM and DENM Structure, there are two ways that we can eliminate redundancy and make aggregations of data. First, we can make an aggregation of CAM data by creating a lighter CAM that contains only average data (speed, heading, acceleration, length, etc.) in a given observation interval and transmit only these aggregated data to the Big Data platforms. Second, we can also select the predefined useful data in the DENM, because some information (e.g. height and position of the longitudinal career left or right) are here to improve the impact reduction in pre- and post-crash use cases, but are a priori not useful for other statistics.
Emilien Bourdy
• Sensor preprocessing
In order to prevent Internet of Things (IoT), where many sensors are deployed, from sending useless data or too much amount of data too often, the preprocessing can be set to send data only when significant changes occur. For example, a temperature sensor does not need to communicate engine temperature every second, but only when it is hot enough to become dangerous or to prove that it is still alive. If the sensor does not send other data than “alive data”, it means that data has not evolved. Some types of thresholds can be set for this.
• Implicit preprocessing
Fortunately, some preprocessing is implicitly made by many duplicate packet detection (DPD)9in the VANET communi-cation protocol: if a message is sent many times by multi-hop broadcasting or by sending many times the same event when new neighbors appears, the protocol discards these messages, and reduce the redundancy. The preprocessing is necessary when we have a huge volume of data. For the moment, there is not enough OBU, RSU, and sensors deployed; however, it will be necessary in very near future.
The preprocessing raises issues in Volume and Veracity.
4
COMMUNICATION
Fig. 3 presents the communication in VANET, there exist two types of communications called commonly V2X (Vehicle to X): 1) Vehicle to Vehicle (V2V): data are sent from a vehicle to another in order to cooperate or to warn of an event; 2) Vehicle to Infrastructure (V2I/I2V): data are sent from a vehicle to an RSU (and vice-versa) in order to share information about events. The V2X communication operates using the ITS-G5 (the vehicular Wi-Fi) technology, but if needed, the cellular network can be used to ensure the QoS. On backbone, we use classical wired communication between the different architectural elements.
According to10, there are three layers in a Big Data network architecture:
1. Access Network. It is the user side, where devices communicate with the network infrastructure. This is our V2X communication.
2. Internet Backbone. It is where data is transported to the data center. This means the communications from RSU to data center (and vice versa).
3. Inter- and intra- data center network. It is the network formed by the data centers. Intra-data center when data center is inside the same building or farms and inter-data center when data center is situated in different locations.
V2V
V2
I
intra-inter-DCN PKI Road manager plate-forme G5 WiredFIGURE 3 VANET communication
In VANET communication, there are two types of dissemination: single and multi-hop. Single hop is used to communicate with the neighborhood and multi-hop to send messages to a destination (can be both an ITS-S or a geographic area)9. Because
of multi-hop mechanism, ITS-S will forward these messages, and they can become redundant for the observer. As mentioned before in 3, this known messages of an ITS-S will not be forwarded again thanks to the implicit preprocessing. For example, in Fig. 3 , the left car sends a message, the right car forwards it to the left car and infrastructure, and the left car will not forward the message again, because it already knows this message.
4 Emilien BourdyET AL
When we use multi-hop dissemination, the denser is the traffic, faster is the dissemination. In11, they send an echo to a
pre-defined distance from a traffic light. Vehicles receive the echo and reply with multi-hop dissemination. Traffic light, then waits for the response. The traffic light will then estimate traffic density with the delay of reply (shorter is the delay, heavier is the traffic density).
Since we are in a cooperative environment, messages sent by ITS-Ss are not encrypted. However, this raises security chal-lenges: everyone can be tracked, and everyone can send what he wants. To overcome these problematic, ITS-Ss add their certificate and sign the messages. By doing this, we ensure the authenticity and the integrity of the message. For the privacy, ITS-Ss use pseudonyms which are periodically changed, and so, we can not track them. To perform these security mechanisms, we use a Public Key Infrastructure (PKI) to manage all certificates and pseudonyms of ITS-Ss, and is responsible for the revocation list to blacklist malicious ITS-Ss. However, this security mechanism may triple the size of packet in case of small CAM.
Therefore, VANET communication raises issues in Volume (with the number of interconnections), Veracity (due to privacy, authenticity, and integrity challenges), and Velocity (by the topography).
5
EXPERIMENTATION OF BIG DATA WITH VANET
From the 23rdto the 26thof April 2018, the University of Reims Champagne-Ardenne (URCA), in France, organized the second
InterCor TestFest event1. During this week, 18 European brands tested their connected vehicles on a 30 km track inside the city
of Reims and on roadway around the city. Unlike the first event in Dordrecht in The Netherlands, the security layer was added. We took advantage of this event to collect real VANET data, and try to extract driver’s behavior. To do that, we provided 9 tablets to 9 drivers from the InterCor project. These tablets saved periodically the vehicular position using the GPS.
At the end of the event, we got back the tablets, and preprocessed the data, by selecting 24 strategic points on the track: the dangerous positions where a deceleration is needed. By doing this, we want to see if drivers react in the same way with dangerous situations. For each point, we took the timestamp from the beginning of the track, the vehicle speed, acceleration, and heading from the North. Since the first point is the start of track, its timestamp is set to 0, we did not use it, and we had 24 × 4 − 1 = 95 variables per record. With these 9 drivers, we got 303 observations, which correspond to 303 records with the distribution of records per driver as follows (21, 8, 10, 12, 28, 36, 56, 15, 117).
We applied our methodology12with these data. The methodology uses local density to extract samples from dataset. Samples
are representative data, and so, with our methodology, we extract these samples and their neighborhood (i.e. the represented data by this sample). The methodology uses a 𝑘 value, which corresponds to the selected density to compute the samples. the higher is the value of 𝑘, the fewer we have samples, because they gather more data.
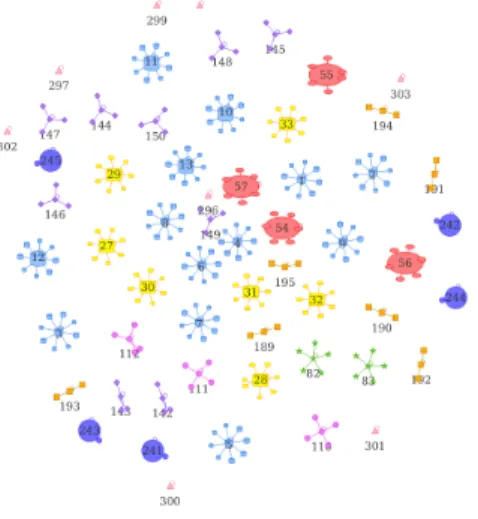
FIGURE 4 Exemplar neighborhood
𝑘 Number of exemplars Sampling distribution Class mixing
40 57 (7, 7, 5, 2, 4, 9, 7, 3, 13) No 50 75 100 53 (7, 6, 5, 2, 4, 9, 7, 2, 11) Yes 150 44 (7, 6, 4, 2, 3, 7, 5, 1, 9) 200 41 (5, 6, 4, 1, 3, 6, 5, 1, 10) 250 35 (7, 4, 3, 0, 3, 6, 4, 2, 6)
TABLE 1 Different values of 𝑘 with Intercor TestFest data
In Fig. 4 , we present the resulting sample selection and their neighborhood for a 𝑘 value of 75. Each node shape corresponds to a driver, and each driver has its own color, so we can see that there is no sample which gather other drivers (i.e. drivers have different behaviors). In the Table 1 , we can see different values of 𝑘. When 𝑘 ⩾ 100, samples gather too many data, and so drivers are mixed together; and with 𝑘 ⩾ 250 some drivers are not represented (0 value in the distribution).
Emilien Bourdy
If we can extract driver’s behavior, it can raises privacy problem. Because even if the ITS-S changes its pseudonym along the journey, the driver still keeps his behavior, and it would still be possible to track him.
6
CONCLUSION
In this paper, we have seen that data in VANET can be considered as Big Data because VANET complies with the 4V: Variety, with the number of stations that uses different data; Velocity, with data that evolve quickly; Veracity, to ensure a good cooperative ITS; and Volume, with the number of stations that produces a lot of data. Some Big Data preprocessing mechanisms need to be used to improve data quality and utility.
We have presented a practical example of using Big Data mechanisms with VANET data from an urban and roadway exper-imentation from the InterCor TestFest event. The methodology made sampling by selecting the exemplars with the highest neighborhood. With this experimentation, we can retrieve driver behavior, and we can see that they are well distinguished. This raises the questions on privacy, because even if the ITS-S pseudonym can evolve during the time, the driver’s behavior will not, and so they are still potentially traceable. Finally, we can conclude that autonomous car needs VANET in addition to their sen-sors, and Big Data mechanisms are needed to extract common or specific pattern of behavior in order to improve car’s predictions and recommendations.
Apart from data analysis, there are also many challenging issues raised from VANET. In order to provide a good solution, issues such as regulations and law need to be addressed along with VANET evolution to ensure anonymity and responsibility for each usage. Anonymity concerns essentially Europe where there is a strong culture of privacy. Each country has its own definition and ways to ensure privacy and so they will need a consortium to decide these issues together.
ACKNOWLEDGMENTS
This work was made possible by EC Grant No. INEA/CEF/TRAN/A2014/1042281 from the INEA Agency for the SCOOP project. The statements made herein are solely the responsibility of the authors.
References
1. Liu Yunshu, Chen Xuanyu, Chen Cailian, Guan Xingping. Traffic big data analysis supporting vehicular network access recommendation. In: Communications (ICC), 2016 IEEE International Conference on:1–6IEEE; 2016.
2. Cheng Nan, Lyu Feng, Chen Jiayin, et al. Big data driven vehicular networks. IEEE Network. 2018;(99):1–8.
3. IEEE . IEEE Draft Standard for Information Technology - Telecommunications and Information Exchange Between Systems
- Local and Metropolitan Area Networks - Specific Requirements - Part 11: Wireless LAN Medium Access Control (MAC) and Physical Layer (PHY) Specifications (November 2011).: IEEE; 2011.
4. Reportlinker . Connected Car Market by Hardware, Application, and Geography - Global Forecast to 2022, March 2017 . 5. Richard Viereckl Christian Radüge. The bright future of connected cars. Strategy&. 2014;.
6. Oteafy Sharief MA, Hassanein Hossam S. Big Sensed Data: Evolution, Challenges, and a Progressive Framework. IEEE
Communications Magazine.2018;56(7):108–114.
7. Contreras-Castillo Juan, Zeadally Sherali, Ibañez Juan Antonio Guerrero. Solving vehicular ad hoc network challenges with big data solutions. IET Networks. 2016;5(4):81–84.
8. Chen Min, Mao Shiwen, Liu Yunhao. Big data: a survey. Mobile Networks and Applications. 2014;19(2):171–209. 9. ETSI . ETSI EN 302 636-4-1/637-2/637-3: Intelligent Transport Systems (ITS); Vehicular Communications. European
Standard: ETSI; 2014.
10. Yi Xiaomeng, Liu Fangming, Liu Jiangchuan, Jin Hai. Building a network highway for big data: architecture and challenges.
IEEE Network.2014;28(4):5–13.
11. Gashaw S., Härri J.. V2X data dissemination delay for vehicular traffic density estimations. In: 2015 IEEE 16th International Symposium on A World of Wireless, Mobile and Multimedia Networks (WoWMoM):1-6; 2015.
12. Bourdy Emilien, Piamrat Kandaraj, Herbin Michel, Fouchal Hacène. New Method for Selecting Exemplars Application to Roadway Experimentation. In: International Conference on Innovations for Community Services:75–84Springer; 2018.