HAL Id: hal-03103730
https://hal.archives-ouvertes.fr/hal-03103730
Submitted on 8 Jan 2021
HAL is a multi-disciplinary open access
archive for the deposit and dissemination of
sci-entific research documents, whether they are
pub-lished or not. The documents may come from
teaching and research institutions in France or
abroad, or from public or private research centers.
L’archive ouverte pluridisciplinaire HAL, est
destinée au dépôt et à la diffusion de documents
scientifiques de niveau recherche, publiés ou non,
émanant des établissements d’enseignement et de
recherche français ou étrangers, des laboratoires
publics ou privés.
Inverse approach for flax yarns mechanical properties
identification from statistical mechanical
characterization of the fabric
Marwa Abida, Ahmad Baklouti, Florian Gehring, Alexandre Vivet,
Christophe Bouvet
To cite this version:
Marwa Abida, Ahmad Baklouti, Florian Gehring, Alexandre Vivet, Christophe Bouvet.
In-verse approach for flax yarns mechanical properties identification from statistical
mechani-cal characterization of the fabric.
Mechanics of Materials, Elsevier, 2020, 151, pp.103638.
an author's
https://oatao.univ-toulouse.fr/27251
https://doi.org/10.1016/j.mechmat.2020.103638
Abida, Marwa and Baklouti, Ahmad and Gehring, Florian and Vivet, Alexandre and Bouvet, Christophe Inverse
approach for flax yarns mechanical properties identification from statistical mechanical characterization of the
fabric. (2020) Mechanics of Materials, 151. 103638. ISSN 0167-6636
Inverse approach for flax yarns mechanical properties identification from
statistical mechanical characterization of the fabric
Marwa Abida
a,*, Ahmad Baklouti
a, Florian Gehring
a, Alexandre Vivet
a, Christophe Bouvet
baNormandie Univ, ENSICAEN, UNICAEN, CEA, CNRS, CIMAP, 14000, Caen, France
bInstitut Cl´ement Ader (ICA), Universit´e de Toulouse, CNRS UMR 5312-INSA-ISAE-Mines Albi-UPS, Toulouse, France
Keywords: Fabric Yarns Vegetal fibers Mechanical properties Multiscale modeling Multi-objective algorithm Statistical properties A B S T R A C T
Plant fiber properties, such as morphological and mechanical, are characterized by a large dispersion. Thereby, a statistical analysis is needed to obtain consistent results. An experimental study, conducted on 50 flax yarns, shows that the flax yarn properties (Young’s modulus, tensile strength and diameter) follow Gaussian distri-butions. This approach is obviously reliable, however time-consuming, to get relevant information. An alter-native could be the identification of the yarn mechanical properties using an inverse approach, based on tensile tests conducted on flax fabric reinforcement. The aim of this study is to develop a numerical method that allows to identify the statistical distributions of flax yarn properties based on tensile tests conducted on fabric speci-mens. The proposed strategy relies on two assumptions. On the one hand, fabric is constituted of several yarns acting like springs in parallel. On the other hand, yarns are considered as brittle-elastic materials. Hence, a yarn breaks when the load reaches its failure strength, leading to a loading redistribution to the intact yarns. A comparison of the numerical and experimental results of flax fabric tensile behavior, and of the flax property statistical distributions allows to confirm the performance of this strategy. The results show that the flax fabric tensile behavior is correctly described by the proposed modeling strategy. The average and the standard devi-ation of the Young’s modulus, the tensile strength and the diameter of flax yarns identified from fabric tensile tests via inverse approach are close to those obtained experimentally on individual yarns. Indeed, the measured average diameter of unitary yarns are 244.4 ± 19.2μm and the fitted one is 2474.8 ± 17.4μm, the fitting failure strength 292.3 ± 33.4 MPa are close to the experimental 271.2 ± 47.5 MPa. The identified Young’s modulus is 9.4 ± 0.9 GPa is lower than the experimental 10.8 ± 1.3 GPa.
1. Introduction
Natural fibers reinforced polymer either synthetic or bio-based ma-trix are attractive to develop high-performance composite materials (Mohanty et al., 2018; Ramesh et al., 2017). Among all natural fibers, those derived from plants, such as hemp, flax, jute and alfa fibers, appear to be suitable as reinforcing materials for polymers for many industrial applications (Gurunathan et al., 2015) due to their high specific prop-erties, especially when compared to those of glass fibers (Bledzki and Gassan, 1999; Faruk et al., 2012). At the European scale, among plant fibers, flax and hemp are the most widely used for composite applica-tions (Bourmaud et al., 2018).
Vegetal fibers generally have a hydrophilic behavior due to the presence of cellulose and hemicellulose with opened structures con-taining hydroxyl (OH) and acetyl (C2H3O) groups (Fotouh et al., 2014).
The behavior of plant fibers and their associated composites is strongly affected by their water content and therefore by the external conditions (e.g. temperature, relative humidity) (Abida et al., 2020). Cadu et al. (2019) showed that the morphology, the microstructure and the chemical composition of flax fiber bundles change with cyclic hygro-thermal ageing (between relative humidity (RH) of 90% and RH of 40%). These modifications could be responsible for the mechanical behavior change according to water content (Abida et al., 2019; C´elino et al., 2014; Perrier et al., 2017).
The fiber reinforced polymer matrix composite performance is gov-erned by a variety of factors including the fiber and the polymer matrix properties, the quality of their interface and fiber dispersion (Perrier et al., 2016). Understanding the behavior of composite materials re-quires, as first step, a good knowledge of the reinforcing material and of the matrix behavior. In plant fiber reinforced polymer composite * Corresponding author.
E-mail address: marwa.abida@univ-lorraine.fr (M. Abida).
science, the characterization of the plant reinforcement behavior could be conducted at different scales (fabric, yarn, fiber bundle and elementary fiber). In this study, the behavior analysis at the fabric scale is considered as the macro-scale (Abida et al., 2019). In a scaling down approach, the behavior characterization at the yarn scale (Omrani et al., 2017), is referred to as meso-scale. At a lower scale, called micro-scale, the behavior of elementary fibers or fiber bundles could be analyzed (Bourmaud et al., 2016).
The experimental characterization of plant fiber or yarn properties needs to overcome some experimental concerns such as a high precision measurement of the load and the diameter, a control of the external conditions and the water content in the materials. As for all fibers, synthetic or natural, plant fiber properties are characterized by a large dispersion (Andersons et al., 2009; Baley, 2002; Belaadi et al., 2016;
Placet, 2009). The level of dispersion depends on the fiber nature and the characterization methods used. For instance, Belaadi et al. (2014)
showed that the mechanical properties of sisal fibers depend on the number of tests (ranging from 15 to 40 tests). Hence, the mechanical properties of plant fiber should be obtained using a statistical approach. Depending on the analyzed properties and the fiber type, the statistical distribution of properties could be described using a Weibull, a Log-normal or a Gaussian probability distribution (Virk et al., 2009;
Zafeiropoulos et al., 2007). Foray et al. (2012) investigated glass fiber flaw size distributions by developing an approach based on tensile tests on multifilament bundles and examination of the fiber surface. These results were used by Lamon and R’Mili (2014) to predict the durability of composites under fatigue loading. These strategies are often time-consuming and require a large number of tests to obtain relevant information.
An alternative could be to conduct tests at a macro-scale (fabric scale) (woven: twill, satin weaves, non-woven: unidirectional). How-ever, as far as the authors’ knowledge is concerned, most of the works focus on the characterization of fabric properties or behavior. Sinoimeri and Dr´ean (1997) studied fabric uniaxial extension using energy methods. Dolatabadi and Kovar (2012), and Kovar and Gupta (2009)
studied experimentally and theoretically the tensile and the rupture properties of plain weave fabric, respectively. More recently, Abida et al. (2019) conducted an experimental investigation on the influence of water content on the mechanical behavior of a quasi-unidirectional flax fabric and showed a low dispersion of the flax properties at the fabric scale. Kovar and Gupta (2009) proposed an analytical model to predict failure of plain woven fabric based on strain failure criterion and on fabric geometry changes with loading (orientation and length of yarns). Homogenization approaches are used to compute properties of textile composites or fabrics depending on yarn behavior and fabric geometry (El Mourid et al., 2013; Udhayaraman and Mulay, 2017). The theoretical fabric behavior is usually investigated using finite element modeling based on the geometry of textile structures. The geometry of fabric structures could be obtained by parametric modeling of the real geom-etry (Chu and Chen, 2018; Wu and Li, 2019) or by computed X-ray to-mography observation (Naouar et al., 2015).
The aim of this study is to develop a numerical method that allows to identify the statistical distributions of flax yarn properties based on tensile tests conducted on fabric specimens. The proposed strategy relies on two assumptions. On the one hand, fabric is composed of several yarns acting like springs in parallel. On the other hand, yarns are considered as brittle-elastic materials. Hence, a yarn breaks when the load reaches its failure strength, leading to a loading redistribution to the intact yarns. This paper proposes, at first, a description of the ma-terials and the methods used during this study (section 2). Then, in section 3, the properties of the yarns (diameter, Young’s modulus, fail-ure strength and failfail-ure strain) are identified from tensile tests on in-dividual flax yarns and described by a statistical probability density. The mechanical behavior of fabric sample made of about a hundred of yarns is also experimentally defined. In the modeling, fabric behavior is assumed to be composed of several yarns that act like parallel springs. A
yarn breaks when the applied load reaches its failure strength, which will lead to a loading redistribution transfer to the other intact yarns. The modeling of the fabric behavior is detailed in section 4. The fabric failure is obtained when all yarns break. The last section of this paper is devoted to the validation of the inverse approach strategy developed to determine the statistical properties of individual yarns from tensile tests on fabrics.
2. Material and methods
2.1. Materials
2.1.1. Macro-scale specimens: flax fabric
The studied material is a quasi-unidirectional flax fabric Flaxply FUD 180 supplied by LINEO NV. The abbreviation “FUD” corresponds to quasi-unidirectional reinforcement. The associated number is the theo-retical specific mass of the fabric. On our sample batch, a specific mass of 207 ± 0.5 g/m2 is measured. This reinforcement is characterized by few
yarns in weft direction to facilitate its handling (Fig. 1 (a)). A 3D reconstruction of the fabric using TexGen software (“TexGen,” n.d.) is shown in Fig. 1 (b). The warp yarns are characterized by a pick count of 4068 yarns/m, while the weft yarns pick count is 304 yarns/m. These technical data lead to a fabric with a balancing coefficient of 0.93. The balancing coefficient KG is defined as the warp yarns pick count divided
by the total pick count.
2.1.2. Meso-scale specimens: flax yarns
Warp yarns are randomly and carefully extracted from the fabric in order to be studied. The warp yarns are characterized by a titration of 48 mg/m. SEM image of the studied flax yarns is given in Fig. 2. It is clearly shown that flax yarns are constituted of twisted fibers. The measured twist angle is 15 ± 5◦.
2.2. Specimen manufacturing and conditioning 2.2.1. Macro-scale specimen manufacturing
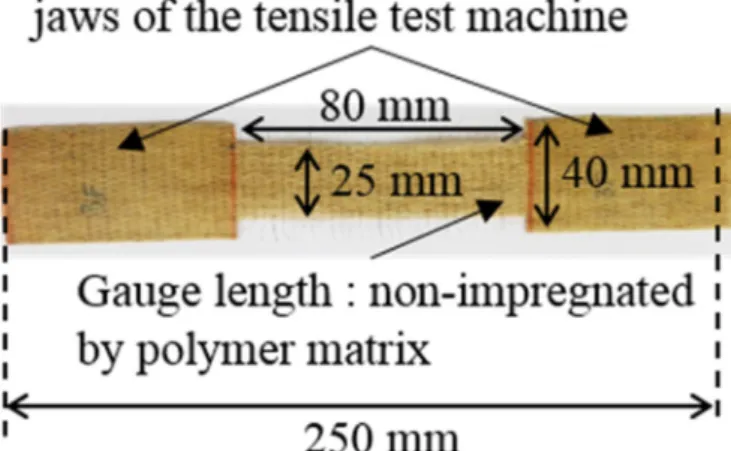
Non-impregnated by polymer matrix quasi-unidirectional flax fabric specimens are prepared according to the standard ISO4606. According to this standard, a proper preparation of the fabric specimen ends is required to avoid damage and stress concentration in fixing jaws of the tensile test machine. Only the ends of the fabric specimens are impregnated with epoxy resin (Araldite LY 1546 resin and Aradur 3487 hardener). The central gauge is non-impregnated. Fabric bands of 330 × 250 mm2 are firstly cut and then dried at 110◦C for 1 h to promote resin
impregnation.
During manual impregnation of the specimen ends, the non- impregnated gauge length is ensured to be 80 mm. These samples are then cured at 100◦C for 2 h to respect the curing cycle of the resin
recommended by the manufacturer. The fabric bands are then cut into tapes of 40 mm width and 250 mm length. The gauge width of the specimens is reduced to 25 mm so as to have a useful area centered in the middle of the specimen. Therefore, samples have a non-impregnated central zone of 80 × 25 mm2 and impregnated ends of 85 × 40 mm2
to fix them in the jaws (Fig. 3).
2.2.2. Meso-scale specimen manufacturing
In order to have a yarn gauge length of 80 mm as fabric sample, yarn specimens of 100 mm total length are prepared. The specific grip jaws for yarn tensile test require 10 mm at each side of the yarn to fix it. 2.2.3. Flax fabric and yarn specimens conditioning
All the studied fabric and yarn samples are conditioned, before being tested, in a climatic chamber with a controlled relative humidity and temperature (RH = 48%, T = 20◦C) until mass stabilization.
2.3. Diameter measurement
An optical method is used to determine the apparent diameter of the yarns. The measurement is conducted using a Baty Venture 2512CN machine of 1μm precision. This method consists in illuminating the
yarns by back-lighting, which allows, with the use of a camera, to measure the width of the projected profile (Fig. 4). This distance is assumed to be the apparent diameter, which makes it possible to determine the mean diameter for each yarn. At least 10 measurements
along the specimens are carried out. The cylindrical section of yarns is checked by performing measurements in two orthogonal directions at each measurement.
2.4. Tensile test
2.4.1. Macro-scale: flax fabric specimen
The tensile properties of flax fabric specimens are measured on a MTS Criterion test machine equipped with a 5 KN load cell, at a tem-perature of 20◦C and RH = 50% with a strain rate of around 10−3s−1.
The elongation is measured via the machine head displacement. 2 specimens are tested to identify the flax fabric behavior.
2.4.2. Meso-scale: flax yarn specimen
For flax yarn samples, tensile tests are conducted under the same atmosphere conditions, on the same test machine using a load cell of 10 N. According to the standard NF T25-501, a strain rate of around 10−3s−1 is used, which is the same used for fabric tensile testing. The
yarn specimen strain is computed using the machine head displacement. 50 yarns are tested in order to ensure a statistical study of their behavior.
3. Experimental mechanical behavior of flax fabric and yarns
3.1. Tensile behavior of flax fabric
The tensile behavior of flax fabric is shown in Fig. 5. Flax fabric behavior is characterized by a few dispersion. The required number of tests needed to identify their mechanical properties is therefore much less than what is needed for flax yarns. The properties of flax fabric, which are the stiffness, the maximal load and elongation, are given in
Table 1. The stiffness is assessed in the linear part between 20% and 80% of the maximal elongation.
Fig. 1. Quasi-unidirectional flax fabric Flaxply FUD 180.
Fig. 2. Scanning Electronic Microscopy image of a flax yarn.
Fig. 3. An example of a fabric specimen.
3.2. Tensile behavior of flax yarns
Fig. 6 shows that flax yarn behavior appears to be linear prior to failure. Nevertheless, non-linear phenomena could be observed experi-mentally on flax behavior. A softening phenomenon could occur on the tensile behavior of some yarns. Other yarns could show a rigidification phenomenon at high stresses (Del Masto et al., 2017). Due to the large
dispersion observed in Fig. 6, a statistical study, on at least 50 yarns, is required in order to determine the tensile properties of the yarns.
Belaadi et al. (2016) pointed out the same conclusions in a study on sisal fibers and yarns.
3.3. Statistical distribution of flax yarn properties
The experimental histograms of D, σmax, εmax, and E are given in
Fig. 7. Following the standard guidelines, the histogram class number is fixed using the square root of the number of the values. Among all sta-tistical distributions available, Normal, Lognormal, Gamma and Weibull laws are the most used in material sciences. For instance, Weibull dis-tribution is usually used to describe the material brittle failure. The Lognormal distribution is used to describe the particle size distribution in reinforced composites. The Normal law is used to describe random phenomena. In order to select the statistical distribution that could best describe the experimental dispersions, several information are used. Firstly, the modified Kolmogorov-Smirnov test is applied. This test is a hypothesis test used to reject the assumption that the experimental distribution follows a given law known by its continuous distribution function (Normal, Lognormal, Gamma, Weibull) depending on the probability-value (P-value). The P-value is the probability for a given statistical model of obtaining the same distribution as observed. Sec-ondly, a descriptive statistic property of the experimental dispersions is used. The skewness parameter allows to judge the symmetry of the dispersion about its mean.
The test results show that the P-value of the Normal, Lognormal and Gamma laws are higher than 0.15 and that the P-value of the Weibull law is higher than 0.1. Even though the P-value should be inferior to 0.1 to reject a distribution law, the P-value found for the Weibull law implies that it is not as efficient as the other laws. So, the properties dispersion could be described by a Normal, Lognormal or Gamma law. The skew-ness parameter of the experimental data, given in Table 2, is close to zero, which makes it possible to consider that the statistical distributions are symmetric about their mean. Since the Lognormal and Gamma laws are asymmetrical, it is concluded that the variation of the yarn proper-ties is best described by a Normal law. A good agreement is found be-tween the experimental histograms and the theoretical Normal distributions (Fig. 7). These results are confirmed by comparing the experimental data (average and standard deviation) with the fitting values of Normal law (Table 3).
3.4. Correlation between yarn properties
In this section, an analysis of the correlation between the yarn properties is conducted. This study is required to determine if there is a relationship between the properties, which will be needed in section 4 to reduce the model parameter number.
In order to verify whether two properties are linearly related, their correlation coefficient should be assessed by equation (1).
R(X, Y) =cov(X, Y)
σxσy (1)
where cov(X, Y) is the covariance and σ is the standard deviation.
The correlation coefficients between the yarn properties are given in
Table 4. When the correlation coefficient is close to 1 or to − 1, a cor-relation between the properties could be detected. Thus, no linear relationship is found between (εmax; D), (εmax; E) (σmax; D), (D; E). For (E;
σmax) and (σmax; εmax), the correlation coefficient is not high enough to
confirm the existence of a linear relationship but it is not low enough to reject this hypothesis. The evolution of Young’s modulus with failure strength (E; σmax) and failure strength with failure strain (σmax; εmax) are
shown in Fig. 8. Obviously, the scatter is high. Several studies on natural fibers in general highlighted the high dispersion of their properties. This dispersion was attributed, among others factors, to the meteorological
Fig. 5. Tensile behavior of flax fabric at RH = 48% at 10−3s−1 (initial gauge
length of 80 mm).
Table 1
Mechanical properties of flax fabric (initial gauge length of 80 mm). Properties stiffness (N/mm) Maximal load (N) Maximal elongation (mm)
497 ± 75 1059 ± 62 2.40 ± 0.22
conditions during growth (Baley et al., 2019). Even if a linear tendency could be noticed, it remains difficult to confirm the existence of a linear relationship between (E; σmax) and (σmax; εmax). That’s why, in the
modeling, flax yarn properties are considered as non-correlated.
4. Theoretical approach
4.1. Model description
In this section, a detailed description of the modeling strategy is given. Tensile test at the fabric scale allows to examine multiple yarns at the same time. Hence, fabric behavior modeling should take into ac-count the yarn variability, which follows a Normal distribution.
The proposed model is based on two hypotheses. On the one hand, fabric is constituted of a yarn assembly acting like springs in parallel. Consequently, the fabric initial stiffness is the sum of every yarn stiffness ki (equation (2)). The contribution of the weft yarns on the longitudinal
Fig. 7. Experimental histogram of flax yarn properties. Table 2
Summary table of Normal law selection criteria. Diameter D
(μm) Failure strength σmax (MPa) Failure strain εmax (%) Young’s modulus E (GPa) P-value for normality test >0.15 >0.15 >0.15 >0.15 Skewness parameter 0.27 −2⋅10−5 0.03 0.24 Table 3
Comparison between experimental data and normal law fitting values of flax yarn properties. Diameter D (μm) Failure strength σmax (MPa) Failure strain εmax (%) Young’s modulus E (GPa) Experimental
data Mean Standard 244.4 271.2 2.69 10.8
deviation 19.2 47.0 0.32 1.2
Fitting values Mean 244.4 271.2 2.69 10.8
Standard
deviation 19.4 47.5 0.32 1.3
Table 4
Correlation coefficient between two properties. Diameter Young’s
modulus Failure strength Failure strain
Diameter – −0.672 −0.489 − 0.055
Young’s
modulus – 0.728 0.099
Failure strength – 0.739
fabric stiffness is neglected. Kfabric=
∑
ki (2)
On the other hand, yarns are considered as brittle and elastic. Maximum stress failure criterion better describes brittle failure than strain criterion. Hence, the failure strain is not taken into account in the following. A yarn behavior is therefore described by its modulus and its failure strength (σmax).
The properties of the yarn i (Young’s modulus Ei, diameter Di and
failure strength σmaxi) are assigned randomly according to a normal
distribution as proven experimentally (section 3).
The yarn stiffness depends on the yarn Young’s modulus Ei, section Si
and initial length l0 according to (3).
ki=
Ei⋅Si
l0 (3)
The model assumes a linear evolution of the elongation because the experiments were strain controlled. The overall elongation of the fabric is the same as each individual yarn (springs in parallel). In this case, the load on each yarn is computed according to equation (4).
Fi=kiΔl (4)
where Δl is the imposed elongation. The stress applied on each yarn (σi)
is computed via the force Fi and the diameter Di.
Then, the applied stress σi is compared to the failure strength σmaxi.
When one of the yarns breaks, its contribution to the fabric stiffness is canceled. In other terms, the overall load on fabric is the sum of the loads on active yarns, and the fabric stiffness becomes the sum of the active yarns stiffness (equation (5)). An explanatory illustration of the modeling strategy is given in Fig. 9.
F =∑Fi\ {failed yarns} → Kfabric=
∑
ki\{failed yarns} (5)
5. Inverse approach
5.1. Description of the optimization method
The aim of this part is to determine the yarn properties (D, E, σmax)
from experimental tensile tests on fabric specimens using an inverse approach based on the model described in section 4. For that purpose, a multi-objective analysis is conducted by defining two groups of objec-tive functions. This approach corresponds to an optimization problem where the first objective is to minimize the difference between the measured and the computed fabric tensile curve. Consequently, the first objective function is defined by a least squares method, and computed
according to equation (6). g1(θ) = ∑nk i=1 |Fc(θ, Δl) − Fm(Δl)| nk⋅Fmaxk (6) where.
− θ is the vector that contains the parameters to be identified. This vector contains the mean and the standard deviation of all statistical distributions of the yarn properties to be identified. As a reminder, the yarn properties required are the diameter, the modulus and the failure strength;
− nk is the number of points measured experimentally; − Fc is the load computed by the model;
− Fm is the load measured experimentally for an elongation of Δl;
− Fmax is the maximum failure load of the fabric.
The method robustness is improved by adding a second objective function, based on the fact that the equivalent fabric stiffness is the sum of each individual yarn rigidities. The second objective function tends to minimize the difference between the computed fabric stiffness, given by Fig. 8. Scatter plots of yarn properties.
the sum of individual yarn rigidities, and the experimental linear slope of the fabric tensile curve (equation (7)).
g2(θ) =
∑ni
n=1
kn− Kfabric (7)
where ni is the number of yarns of the fabric specimen; kn is the yarn
stiffness and Kfabric is the fabric experimental initial stiffness.
Two fabric tensile tests are used in the inverse approach to increase the physical information, and the two objective functions (equation (6)
and (7)) are used for each test. 5.2. Model parameters identification
The identification is performed using a genetic algorithm available in Matlab. The basic idea of the method is to generate a population of several solutions at each iteration. Over successive generations, the population “evolves” towards an optimal solution. In this case, the so-lution generation consists in generating the Gaussian distribution pa-rameters (mean and standard deviation) of yarn properties (D, E, σmax),
that allows to minimize the objective functions.
A description of the genetic algorithm principles is given in the following:
1. The algorithm begins by creating a random initial population. Each member of the population corresponds to a fabric load-elongation curve.
2. Then, the algorithm creates a sequence of new populations called generations. At each step, the algorithm uses the members in the current generation to create the next population. To create a new population, the algorithm performs the following steps.
a. Scores each member of the current population by computing its fitness value according to equations (6) and (7).
b. Ranks all members according to their fitness values. Members with the best fitness values in the current generation are guar-anteed to survive to the next generation. Only 5% of the popu-lation size could directly pass to the next generation.
c. Selects members, called parents, based on their ranking using a stochastic uniform selection to produce their children. Children are produced by crossing over the vector parameters (mean and standard deviation of the statistical distributions of the yarn properties) of a pair of parents.
3. The algorithm repeats the step 2 until convergence is reached. Standard stopping criteria are used. The algorithm terminates when the maximal generation is reached or when average relative change in the best fitness function is less than or equal to the function tolerance.
For this algorithm, a maximum generation number of 100 and a population size per generation of 100 are used.
5.3. Results and discussion
An example of the convergence curve is provided in Fig. 10. Less than 20 generations are needed to get the same optimal solution. The stability and convergence of the algorithm are verified by running it several times. The algorithm quickly converges to a stable and repeatable optimal solution for each run.
The robustness of the proposed approach is verified by comparing the predicted and the experimental fabric tensile curves as well as the flax yarn properties.
The model correctly describes the overall flax fabric behavior (Fig. 11). A good agreement is found between the experimental and the predicted initial stiffness as well as the maximal load of the fabric. However, discrepancies are detected in the description of the fabric failure. The experimental fabric tensile curve shows some load
variations close to the peak load, which corresponds to the failure of some yarns. Then, a sudden drop in fabric load is observed, which cor-responds to the failure of all remaining yarns (Figs. 5 and 12), unlike the numerical curves which exhibit a more progressive failure. Fig. 12
shows the predicted yarn failure kinetics given by the number of intact yarns at each level of elongation. The intact yarn count curve shows 3 regions. The first region corresponds to an elastic region where no yarn fails. The second region corresponds to a transition zone where yarns fail followed by an increase of fabric stress. The last part of the curve shows a softening due to cumulative yarns failure. The modeling does not correctly describe the experimental yarn failure kinetics. Actually, even though in the modeling, several yarns could fail at the same time, the successive yarn failure in the predicted fabric behavior is less brutal than the observed one (Fig. 12). This deviation could be explained by an overstress phenomenon that could appear on yarns close to the failed ones. However, the quantification of this overstress phenomenon re-mains complicated that’s why it is not taken into account in the
Fig. 10. Example of a convergence curve.
Fig. 11. Comparison between experimental and theoretical flax fabric
modeling.
The identification strategy performance is also verified by comparing the experimental and the numerical results of the average value and standard deviation of the normal distribution function. Table 5 shows a comparison between the identified flax yarn properties with experi-mental data obtained from tensile tests on 50 individual yarns. The morphological property (diameter) of the yarns is correctly identified by the proposed strategy. The identified normal distribution parameters of the diameter are 247.8 ± 17.4 μm. The error between the identified
average value compared to the experimental one is 1.4%. However, the error on the identified mechanical properties is higher. The average value of the Young modulus is identified with an error of 13%. The failure strength is overestimated with an error of almost 8% compared to the experimentally characterized one. This deviation could be explained by the particular behavior of the flax yarns. Indeed, the model supposes a linear behavior prior to the first yarn failure. Nonetheless, non-linear behavior appears on some yarn tensile curves leading to misestimating the mechanical properties.
Despite the error between the experimental data and the model values, the strategy of the yarn properties identification, from tensile tests on fabric, is reliable.
Using the identified parameters of normal distributions from Table 5, the average behavior of yarns is computed and plotted on Fig. 13. The 95% confidence level prediction of yarn behavior is also plotted on
Fig. 13. The 95% confidence level prediction interval is having 95% probability for a yarn behavior to be located in this interval. These ranges are compared to those obtained experimentally on Fig. 13. The comparison shows that the model succeeds in predicting the experi-mental behavior of the flax yarns. However, the model does not take into consideration the non-linear phenomena of flax yarns, observed exper-imentally, which could explain the discrepancy found for the low stresses.
6. Conclusion
The purpose of this study is to develop a numerical strategy in order to characterize the statistical distributions of flax yarn properties from tests conducted on flax fabric. As a first step, experimental analyzes of morphological property (diameter) and mechanical properties (Young modulus, tensile strength) of flax yarns reveal that the distributions of the three properties follow a Normal law. The proposed model assumes that the fabric is constituted of several yarns acting like springs in par-allel and that flax yarns are brittle and elastic material. Following the experimental findings, all the properties of the flax yarns in the fabric follow a Gaussian law in the proposed model. In order to determine the yarn properties (D, E, σmax) from experimental tensile tests on fabric
specimens, a genetic algorithm is used to solve this inverse problem. The genetic algorithm is based on a multi-objective analysis where two objective functions are defined. The strategy correctly identifies the distributions of flax yarn properties from only two tests on fabric spec-imens. One key point of the proposed method is that it requires 2 fabric specimens testing instead of at least 50 tests on yarns to get relevant results. The robustness of the proposed approach is verified by comparing the predicted and the experimental fabric tensile curves as well as the flax yarn properties. A good agreement is found between the experimental and the predicted results. The model correctly describes the fabric tensile behavior. However, the numerical fabric failure ki-netics are overestimated compared to the experimental ones. These discrepancies were attributed to an overstress phenomenon that appears on the yarns close to the failed ones. Despite these discrepancies, the proposed strategy is reliable to identify the yarns behavior and the properties statistical distributions from tensile tests on fabric. Indeed, the identified mean and the standard deviations of yarn properties are close to the experimental ones. The most probable numerical yarn behavior obtained from the numerically identified statistical distribu-tions of yarn properties show a good agreement with the experimentally observed yarn behavior range.
Author statement
Marwa Abida: Conceptualization, Methodology, Investigation, Data curation, Formal analysis, Validation, Writing - Original Draft, Writing- Review and Editing, Ahmad Baklouti: Conceptualization, Methodology, Software, Writing- Review and Editing, Florian Gehring: Conceptuali-zation, Methodology, Formal analysis, Validation, Writing- Original draft, Writing- Review and Editing, Alexandre Vivet: Supervision, Fig. 12. Predicted yarn failure kinetics during flax fabric tensile test.
Table 5
Comparison between experimental data and model predictions. Diameter D
(μm) Failure strength σmax (MPa)
Young’s modulus E (GPa) Experimental
fitting values Mean Standard 244.4 271.2 10.8
deviation 19.4 47.5 1.3
Identified model
values Mean Standard 247.8 292.3 9.4
deviation 17.4 33.4 0.9
Fig. 13. Comparison between experimental and the predicted flax yarn
Writing - Review & Editing, Christophe Bouvet: Conceptualization, Writing - Review & Editing.
Funding
This research received no specific grant from any funding agency in the public, commercial, or not-for-profit sectors.
Declaration of competing interest
The authors declare that they have no known competing financial interests or personal relationships that could have appeared to influence the work reported in this paper.
References
Abida, M., Gehring, F., Mars, J., Vivet, A., Dammak, F., Haddar, M., 2020. A viscoelastic–viscoplastic model with hygromechanical coupling for flax fibre reinforced polymer composites. Compos. Sci. Technol. 189, 108018. https://doi.org/ 10.1016/j.compscitech.2020.108018.
Abida, M., Gehring, F., Mars, J., Vivet, A., Dammak, F., Haddar, M., 2019. Effect of hygroscopy on non-impregnated quasi-unidirectional flax reinforcement behaviour. Ind. Crop. Prod. 128, 315–322. https://doi.org/10.1016/j.indcrop.2018.11.008. Andersons, J., Sp¯arnin¸ˇs, E., Porik¸e, E., 2009. Strength and damage of elementary flax
fibers extracted from tow and long line flax. J. Compos. Mater. 43 (22), 2653–2664.
https://doi.org/10.1177/0021998309345035.
Baley, C., 2002. Analysis of the flax fibres tensile behaviour and analysis of the tensile stiffness increase. Compos. - Part A Appl. Sci. Manuf. 33, 939–948. https://doi.org/ 10.1016/S1359-835X(02)00040-4.
Baley, C., Gomina, M., Breard, J., Bourmaud, A., Davies, P., 2019. Variability of mechanical properties of flax fibres for composite reinforcement. A review. Ind. Crop. Prod. 111984. https://doi.org/10.1016/j.indcrop.2019.111984. Belaadi, A., Bezazi, A., Bourchak, M., Scarpa, F., Zhu, C., 2014. Thermochemical and
statistical mechanical properties of natural sisal fibres. Compos. B Eng. 67, 481–489.
https://doi.org/10.1016/j.compositesb.2014.07.029.
Belaadi, A., Bourchak, M., Aouici, H., 2016. Mechanical properties of vegetal yarn: statistical approach. Compos. B Eng. 106, 139–153. https://doi.org/10.1016/j. compositesb.2016.09.033.
Bledzki, A.K., Gassan, J., 1999. Composites reinforced with cellulose based fibre. Prog. Polym. Sci. 24, 221–274.
Bourmaud, A., Beaugrand, J., Shah, D.U., Placet, V., Baley, C., 2018. Towards the design of high-performance plant fibre composites. Prog. Mater. Sci. 97, 347–408. https:// doi.org/10.1016/j.pmatsci.2018.05.005.
Bourmaud, A., Gibaud, M., Baley, C., 2016. Impact of the seeding rate on flax stem stability and the mechanical properties of elementary fibres. Ind. Crop. Prod. 80, 17–25. https://doi.org/10.1016/j.indcrop.2015.10.053.
Cadu, T., Van Schoors, L., Sicot, O., Moscardelli, S., Divet, L., Fontaine, S., 2019. Cyclic hygrothermal ageing of flax fibers’ bundles and unidirectional flax/epoxy composite. Are bio-based reinforced composites so sensitive? Ind. Crop. Prod. 141, 111730.
https://doi.org/10.1016/j.indcrop.2019.111730.
C´elino, A., Fr´eour, S., Jacquemin, F., Casari, P., 2014. The hygroscopic behavior of plant fibers: a review. Front. Chem. 1, 1–12. https://doi.org/10.3389/fchem.2013.00043. Chu, Y., Chen, X., 2018. Finite element modelling effects of inter-yarn friction on the
single-layer high-performance fabrics subject to ballistic impact. Mech. Mater. 126, 99–110. https://doi.org/10.1016/j.mechmat.2018.08.003.
Del Masto, A., Trivaudey, F., Guicheret-Retel, V., Placet, V., Boubakar, L., 2017. Nonlinear tensile behaviour of elementary hemp fibres: a numerical investigation of the relationships between 3D geometry and tensile behaviour. J. Mater. Sci. 52, 6591–6610. https://doi.org/10.1007/s10853-017-0896-x.
Dolatabadi, M.K., Kovar, R., 2012. Anisotropy in tensile properties of plain weave fabric – Part I: the meso-scale model. Textil. Res. J. 82, 1666–1676. https://doi.org/ 10.1177/0040517511435003.
El Mourid, A., Ganesan, R., L´evesque, M., 2013. Comparison between analytical and numerical predictions for the linearly viscoelastic behavior of textile composites. Mech. Mater. 58, 69–83. https://doi.org/10.1016/j.mechmat.2012.11.003. Faruk, O., Bledzki, A.K., Fink, H.P., Sain, M., 2012. Biocomposites reinforced with
natural fibers: 2000-2010. Prog. Polym. Sci. 37, 1552–1596. https://doi.org/ 10.1016/j.progpolymsci.2012.04.003.
Foray, G., Descamps-Mandine, A., R’Mili, M., Lamon, J., 2012. Statistical flaw strength distributions for glass fibres: correlation between bundle test and AFM-derived flaw size density functions. Acta Mater. 60, 3711–3718. https://doi.org/10.1016/j. actamat.2012.03.019.
Fotouh, A., Wolodko, J., Lipsett, M.G., 2014. Isotherm moisture absorption kinetics in natural-fiber-reinforced polymer under immersion conditions. J. Compos. Mater. 49, 1301–1314. https://doi.org/10.1177/0021998314533366.
Gurunathan, T., Mohanty, S., Nayak, S.K., 2015. A review of the recent developments in biocomposites based on natural fibres and their application perspectives. Compos. Part A Appl. Sci. Manuf. 77, 1–25. https://doi.org/10.1016/j.
compositesa.2015.06.007.
Kovar, R., Gupta, B.S., 2009. Study of the anisotropic nature of the rupture properties of a plain woven fabric. Textil. Res. J. 79, 506–516. https://doi.org/10.1177/ 0040517508094095.
Lamon, J., R’Mili, M., 2014. Investigation of the residual tensile behavior of fiber bundles after static fatigue: implications for the prediction of durability of composites. Compos. Part A Appl. Sci. Manuf. 67, 149–156. https://doi.org/10.1016/j. compositesa.2014.08.014.
Mohanty, A.K., Vivekanandhan, S., Pin, J.M., Misra, M., 2018. Composites from renewable and sustainable resources: challenges and innovations. Science 80 (362), 536–542. https://doi.org/10.1126/science.aat9072.
Naouar, N., Vidal-Salle, E., Schneider, J., Maire, E., Boisse, P., 2015. 3D composite reinforcement meso F.E. analyses based on X-ray computed tomography. Compos. Struct. 132, 1094–1104. https://doi.org/10.1016/j.compstruct.2015.07.005. Omrani, F., Wang, P., Soulat, D., Ferreira, M., 2017. Mechanical properties of flax-fibre-
reinforced preforms and composites: influence of the type of yarns on multi-scale characterisations. Compos. Part A Appl. Sci. Manuf. 93, 72–81. https://doi.org/ 10.1016/j.compositesa.2016.11.013.
Perrier, A., Touchard, F., Chocinski-Arnault, L., Mellier, D., 2017. Influence of water on damage and mechanical behaviour of single hemp yarn composites. Polym. Test. 57, 17–25. https://doi.org/10.1016/j.polymertesting.2016.10.035.
Perrier, A., Touchard, F., Chocinski-Arnault, L., Mellier, D., 2016. Mechanical behaviour analysis of the interface in single hemp yarn composites: DIC measurements and FEM calculations. Polym. Test. 52, 1–8. https://doi.org/10.1016/j.
polymertesting.2016.03.019.
Placet, V., 2009. Characterization of the thermo-mechanical behaviour of Hemp fibres intended for the manufacturing of high performance composites. Compos. Part A Appl. Sci. Manuf. 40, 1111–1118. https://doi.org/10.1016/j.
compositesa.2009.04.031.
Ramesh, M., Palanikumar, K., Reddy, K.H., 2017. Plant fibre based bio-composites: sustainable and renewable green materials. Renew. Sustain. Energy Rev. 79, 558–584. https://doi.org/10.1016/j.rser.2017.05.094.
Sinoimeri, A., Dr´ean, J.Y., 1997. Mechanical behavior of the plain weave structure using energy methods: fabric uniaxial extension. Textil. Res. J. 67, 370–378. https://doi. org/10.1177/004051759706700510.
TexGen [WWW Document]. http://texgen.sourceforge.net/index.php/Main_Page. URL. Udhayaraman, R., Mulay, S.S., 2017. Multi-scale approach based constitutive modelling
of plain woven textile composites. Mech. Mater. 112, 172–192. https://doi.org/ 10.1016/j.mechmat.2017.06.007.
Virk, A.S., Hall, W., Summerscales, J., 2009. Multiple Data Set (MDS) weak-link scaling analysis of jute fibres. Compos. Part A Appl. Sci. Manuf. 40, 1764–1771. https://doi. org/10.1016/j.compositesa.2009.08.022.
Wu, W., Li, W., 2019. Parametric modeling based on the real geometry of glass fiber unidirectional non-crimp fabric. Textil. Res. J. 89, 3949–3959. https://doi.org/ 10.1177/0040517518824846.
Zafeiropoulos, N.E., Dijon, G.G., Baillie, C.A., 2007. A study of the effect of surface treatments on the tensile strength of flax fibres: Part I. Application of Gaussian statistics. Compos. Part A Appl. Sci. Manuf. 38, 621–628. https://doi.org/10.1016/j. compositesa.2006.02.004.