HAL Id: hal-01006845
https://hal.archives-ouvertes.fr/hal-01006845
Submitted on 8 Dec 2017
HAL is a multi-disciplinary open access
archive for the deposit and dissemination of
sci-entific research documents, whether they are
pub-lished or not. The documents may come from
teaching and research institutions in France or
abroad, or from public or private research centers.
L’archive ouverte pluridisciplinaire HAL, est
destinée au dépôt et à la diffusion de documents
scientifiques de niveau recherche, publiés ou non,
émanant des établissements d’enseignement et de
recherche français ou étrangers, des laboratoires
publics ou privés.
Experimental investigation of rubber ball impacts on
aluminium plates
Pierrick Guégan, Ramzi Othman, Daniel Lebreton, Franck Pasco, Nicolas
Swiergiel, Pascal Thevenet
To cite this version:
Pierrick Guégan, Ramzi Othman, Daniel Lebreton, Franck Pasco, Nicolas Swiergiel, et al..
Experimen-tal investigation of rubber ball impacts on aluminium plates. International Journal of Crashworthiness,
Taylor & Francis, 2010, 15 (4), pp.391-399. �10.1080/13588260903504044�. �hal-01006845�
Experimental investigation of rubber ball impacts on aluminium plates
Pierrick Gu´egana, Ramzi Othmana∗, Daniel LeBretona, Franck Pascoa, Nicolas Swiergielband Pascal Thevenetb
aInstitut de Recherche en G´enie Civil et M´ecanique (GeM), Ecole Centrale de Nantes, 1 Rue de la No¨e BP 92101, F-44321 Nantes cedex 3, France;bEADS IW, 12 rue Pasteur, BP 76, F-92152 Suresnes cedex, France
Aircraft structures should endure tyre debris impacts. Therefore, numerical simulations which are able to predict such phenomena are highly appreciated for the aircraft structures design. However, these simulations had to be checked by means of experimental data. In this paper, a new experimental set-up, with well-known boundary conditions, has been developed for numerical model validation. This new set-up allows for impacts with angles ranging from 20◦to 90◦by a step of 5◦. In this study, rubber balls, which are 42 mm in diameter, are launched against 500× 500 mm2 aluminium alloy plates. The
impact velocities are in the range of 130 m/s.
Keywords: tyre debris; low velocity impact; aluminium; rubber; elastomer
1. Introduction
Aircraft structures may endure the impact of objects of several natures [24] such as tyre debris [19, 28] and bird strikes [21, 25, 26]. Therefore, they should be designed to withstand crash and impact loads. Consequently, nu-merical models for these phenomena are in great demand nowadays [1, 16, 23, 39]. However, these models have to be validated to check their accuracy. Hence, experimen-tal set-ups which can reproduce structural problems are highly valuable. These facilities are as important as tech-niques which characterize the strain-rate sensitivity of ma-terials [3, 4, 13, 32, 38].
One of the most dangerous impacts that can occur with aircraft structures is tyre debris [19,28]. The accident of the Concorde, which happened on 25 July 2000, is an illustra-tive example. Indeed, the most likely onset of the accident is a tyre debris impact on the fuel tank lower panel. Con-sequently, the design of aircraft structures, in order to bear tyre debris impacts, is of crucial importance.
Several works considered structural effects from an ex-perimental point of view. Jackson [17] and Meng et al. [27] studied the crash response of aircraft fuselage by drop weight techniques. On the other hand, many authors were interested in the impact of metallic projectiles on metal-lic [6, 12, 14, 15, 36] or composite plates [2, 5, 8, 10, 24, 29]. On the contrary, the impact of rubber-like projectiles on metallic or composite plates is understudied. To the best knowledge of the authors, only Mines et al. published on this subject [19, 28]. Precisely, Mines et al. [28] investi-gated experimentally the response of aluminium plates to projectiles taken from a Concorde tyre tread. The
projec-∗Corresponding author. Email: ramzi.othman@ec-nantes.fr
tiles were parallelepiped or cube-shaped. They investigated three impact angles: 30◦, 60◦and 90◦. The impact velocities range from 75 to 135 m/s. The targets were clamped 300× 300 mm aluminium alloy plates. In continuation with this work, Karagiozova and Mines [19] made numerical simu-lations of theses experiments with LS-DYNA. In addition to Mines et al. [19, 28], Nguyen et al. [30] also proposed a model of the lofting of runway debris by aircraft tyres.
In this paper, we propose a new set-up which allows impact tests with angles ranging from 20◦to 90◦by a step of 5◦. Only angles 20◦, 45◦and 90◦are actually tested in this work. The 500× 500 mm aluminium alloy plates are fired by rubber balls which have a diameter of 42 mm. The new set-up ensures a simple contact at the target boundaries.
2. Experimental set-up
In this section, we present the experimental set-up. In sec-tion 2.1, we give details about the projectile and the launch-ing system. Then, in section 2.2, we present the target and its positioning frame. This frame manages the boundary conditions of the target. Recall that these boundary condi-tions should be mastered at best in order to be reproduced in numerical models. Next, we present in section 2.3 the bearing system. It is up to this system to manage the impact angle. Furthermore, it must be stiff enough to respond elas-tically to the strike of the projectile. Finally, we describe the instrumentation of the set-up in section 2.4.
2.1. Projectile and launching system
In this work, we used the gas launcher facility of the Institut de Recherche en G´enie Civil et M´ecanique (GeM) which
Figure 1. Overview of the gas launcher.
is shown in Figure 1. This launcher works with nitrogen. The high pressure chamber has a volume of 33 litres and a maximum inflate pressure of 1000 bar. The canon measures 9 m in length and has an inner diameter of 100 mm. The maximal velocity obtained is 600 m/s with a 500 g heavy aluminium projectile.
The used projectiles are rubber balls. Their diameter should be about one-tenth of the target’s dimension. This is the observed ratio between tyre fragments and aircraft panels. As the target is 500× 500 mm2, the rubber should be about 50 mm in diameter. In our case, the rubber ball diameter is chosen to be 42 mm. Indeed, we yet to have a mould with this diameter.
In order to guide the projectile in the canon, a sabot is realised from polyurethane foam (Figure 2). One of the two sabot sides includes a conical centred hollow in order to house the projectile. The sabot is manufactured in our laboratory (GeM), by injection into a specific mould.
An anvil is used at the exit side of the canon to stop the sabot. Indeed, the sabot guides the projectiles through the nine meter canon after firing. At the exit side, the sabot impacts the anvil and blows up and let the rubber ball go its way. As the debris of adapter is lightweight, its possible impact on the target has almost no influence. Furthermore, it is highly decelerated and strikes the target rather belatedly.
2.2. Target and its positioning frame
In this work, we are interested in firing 5- and 10-mm thick aluminium square plates. Their length is 500 mm. In order to maintain this target, we have conceived what will be called below the positioning frame. It is worth to recall here that the positioning frame should realise simple target boundary conditions that can be reproduced with finite-element analysis. Furthermore, any point of the mounting frame should not intersect with the trajectory of the rubber
Figure 3. Positioning frame.
balls neither before nor after the impact and this holds for all impact angles.
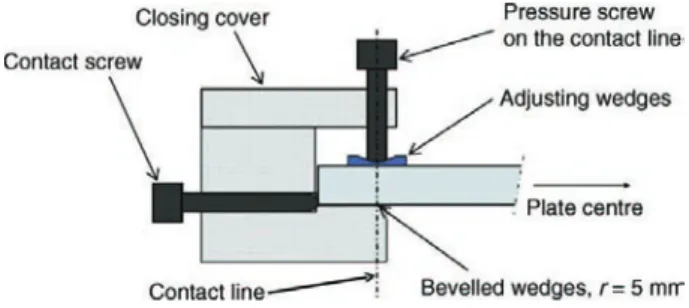
In order to fulfil these requirements, we have chosen the use of adjusting wedges and pressure screw. Thus, the position holding of the target is ensured (Figure 3). More-over, the pressure screws are deported at the right side of the frame’s internal contact line. This allows us to lock the pos-sible plate rotation on its support during the impact. Finally, a 5 mm-radius bevelled edge protects the target during its rotation around the internal contact line (Figure 3).
The target is centred, in the positioning frame, by con-tact screws (Figure 3). This frame has a square form. Under non-normal impact (the impact angle α in Figure 4(a) is lower than 90◦), and considering rubbings, the action of the projectile on the target generates in-plan efforts which can induce downward displacements. These efforts are maxi-mum for an impact at α= 20◦. To avoid any risk of having a target stamping which can be induced by the punctual bearing of the contact screws, the plate is held directly in its lower part by the positioning frame (i.e., without con-tact screws). Furthermore, under non-normal impacts (α < 90◦), the projectile leads to a slip down on the target sur-face. In order to make free the projectile’s after-impact dis-placement, the positioning frame is chamfered on a local level and does not include pressure to screw its lower part. The designed positioning frame can house 500× 500 mm metallic as well as composite plates. The admissible plate thickness ranges from 2 to 10 mm.
2.3. Bearing system
The adopted methodology allows the positioning of the plate so that the projectile strikes the target centre. First, the target is supported by a square positioning frame (detailed in section 2.2). Then, four rigid cells link the positioning frame to the bearing system. The cells have identical geom-etry as possibly-added force sensors. The bearing system is constituted by two half-squares (for back fixing) and two lateral elliptical support (for front fixing). The latter are pro-vided with indexations in order to allow impact angles from 20◦to 90◦ by a step of 5◦ (Figure 4). Spindle links fix the four corners of the positioning frame to the rigid cells. All spindles are locked by clamping. Furthermore, the middle
of assemblage is clear to allow the projectile impact. The rear plate faces are also cleared to increase the visibility of the target by cameras. The back sensors (side squares) are oriented to measure an effort in compression, whereas the front sensors (side elliptical support) are dedicated to tensile efforts. The principal schema and the general view of the bearing system are shown in Figure 4.
2.4. Instrumentation
The objective of the present experimental set-up is to pro-vide experimental data in order to validate numerical mod-els. Therefore, instrumentation is very important to give quantitative and qualitative outputs that can be compared to numerical simulations. The developed set-up is instru-mented by:
r
Two laser barriers: Two laser barriers, as shown inFigure 2(b), are used to measure the projectile velocity before impact. Precisely, when the projectile comes in front of the first barrier, a step signal is generated. The same thing happens when the projectile comes in front of the second barrier. Knowing the delay between the two signals and the distance between the two laser barriers, it is easy to recover the projectile velocity. Cost-effective optoelectronic systems are also proposed to measure the projectile velocity for these kind of applications [37]. High-speed photography can also be used for this purpose. This method will be used to measure the residual velocity (velocity after impact).
r
Eleven strain-gauge stations: In order to validatenumerical simulations, strain measurements are very useful. Therefore, we instrumented the experimental set-up by strain gauges. The number of strain gauges had to be determined and adapted to each study. Further-more, redundant measurements are necessary to reduce noise [7, 31]. For this work, we choose to cement eleven strain gauges: two are cemented on the positioning frame and nine are cemented on the rear face of the aluminium plates (Figure 5). The positioning frame is instrumented by one-directional strain gauges referenced below as JC1 and JC2. Nine strain gauges are cemented on the rear face of the target: eight measure the strain in one direc-tion and one is bi-direcdirec-tional. This one is cemented at the centre. The two signals produced by this gauge are ref-erenced J9A and J9C. The eight other strain gauges are distributed on two circles of radii 50 and 100 mm. These gauges are referenced J1 to J8 as shown in Figure 5. The gauges are connected to twelve 2210 VISHAY conditioners. Their signals are recorded by a NICOLET digital oscilloscope at a sampling rate of 1 MHz. In this work, we used only strain gauges and no force sensors. However, it is possible to instrument this set-up by these sensors. Indeed, the positioning frame is linked to bearing system by four rigid cells; each one is housed
Figure 4. Bearing system. (a) Schema and (b) overview of the bearing system.
in a corner. The rigid cells can be changed by force sensors of the same geometry. Alternatively to force cells, Ritt et al. [35] suggested the use of long elastic bars instrumented by a strain gauge. The idea should be investigated. However, careful attention should be given to the multiple reflections of the wave in the bar. Indeed the test duration is largely higher than the time that takes the wave to go through the bar. Consequently,
wave separation techniques should be used to recover the force [7, 9, 18, 31–33]. Alternative impact force measurements can be found in [11, 22].
r
Two high-speed-video cameras: The impact zone isfilmed by two high-speed video cameras. The first cam-era (PHOTRON SA1) films the latcam-eral side whereas the second (PHOTRON APX) records images from the top. This second camera follows the projectile before, during
Figure 5. Gauge positions on the rear face of the target.
and after the impact even if it would perforate the target. The two cameras are controlled by the same trigger in or-der to be synchronised. Images are taken at a frequency of 6000 image/s. The cameras are used for two purposes. The first one is to measure the residual velocity (velocity after impact) of the rubber ball. The second is to have a qualitative representation of the impact. The images obtained by the two cameras can also be used to make stereo-DIC (stereo digital image correlation) [20, 34]. This would yield the out-of-plane displacement of plate for example. However, this work is not undertaken here.
3. Results
3.1. Parameters of the realised experiments
In this work six experiments were carried out. The tar-gets were cut in 2000 × 1000 mm plates of 5754 H111 aluminium alloy. The elastic limit of this alloy is about 110 MPa and the maximum elastic strain is 0.2%. Two thicknesses and three impact angles were considered. The projectiles were 42 mm rubber balls. Their mass was about 45 g. For each test a new ball was used. The impact velocity was in the range of 130 m/s. Table 1 details the parameters of the realised tests.
3.2. Permanent after-impact deflection
After impact, the permanent deflection of the plate is ex-amined. By permanent deflection we mean the residual out-of-plane displacement. Indeed, the projectile impact in-duces bending deformation and out-of-plane displacements
Table 1. Parameters of the experimental tests.
Plate Impact Impact Normal Test thickness angle velocity impact velocity label e (mm) α (◦) V0(m/s) V0n= V0sin α (m/s) T1090 10 90 131.5 131.5 T1045 10 45 129.9 91.8 T1020 10 20 122.8 42.0 T0590 5 90 127.1 127.1 T0545 5 45 131.4 92.9 T0520 5 20 134.4 45.9
of the target. If the induced deformations are in the elastic range, the out-of-plane displacement is recovered and then no permanent deflection is observed. In the case of impacts inducing stresses higher than the yield stress a residual out-of-plane displacement is observed. This is the permanent deflection of the plate.
For the 10-mm thick plates (tests T1090, T1045 and T1020), no visible deflection is observed after impact. The rubber ball strike induces no plastic deformation in the target. This is also the case of the 5-mm thick plate when impacted at an angle of 20◦(test T0520).
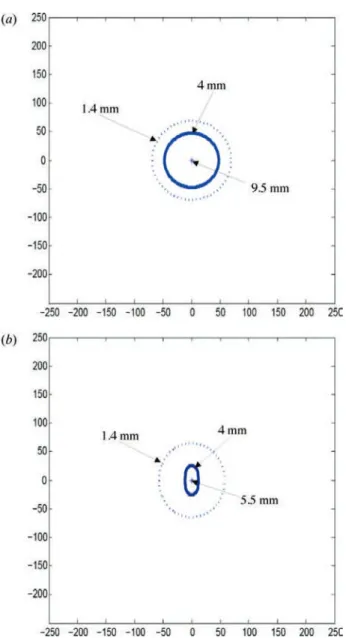
However, for 45◦or 90◦impact angles (tests T0545 and T0590), the 5-mm thick targets are plastically deformed. A permanent deflection is obtained after the strike. In Figure 6, we show some iso-value contours of this perma-nent deflection. An iso-value contour is the set of target’s points that have the same residual out-of-plane displace-ment. In the case of a 90◦impact angle, the iso-value con-tours are circular. However, they are rather elliptical in the case of a 45◦ impact. The long axe of the ellipse is in the direction of the tangential velocity. As expected, the normal impact velocity V0n= V0sin(α) (V0is the impact velocity) is the parameter which influences the damage of the target. Let V0n,c(e) be the function that gives the lowest normal im-pact velocity which yields a permanent deflection on the tar-get in terms of the plate thickness e. We can conclude from the above observations that V0n,c(10 mm) > 131.5 m/s and 45.9 < V0n,c(5 mm) < 92.9 m/s.
3.3. Maximum induced strain
The rubber ball impact of the ball generates an incident bending wave which propagates till the plate boundary and reflects back. In Figure 7, we plot the maximum strain induced by this incident wave. These measurements are obtained by the strain-gauge signals as the first maximum of each strain-gauge output. In the case of the 10 mm-thick plate (Figure 7(b)), the maximum strain for all gauges is below 0.25%. Almost no plastic deformation happens in these plates. This observation is in line with the after-impact visual analysis made in section 3.2. Recall that no permanent deflection is observed on 10-mm thick plates.
Figure 6. After-impact permanent deflection: iso-value coun-tours. (a) Plate thickness: 5 mm, impact velocity: 127.1 m/s, im-pact angle: 90◦; (b) Plate thickness: 5 mm, impact velocity: 131.4 m/s, impact angle: 45◦.
In the same way, the conclusions from Figure 7(a) are also in line with the observations made in section 3.2. Precisely, in the case of a 20◦impact angle, the maximum strain is below 0.2% and no plastic deformation occurs. However, for 45◦ and 90◦ impact angles, the maximum strain is about 1% and 2.5%, respectively. Therefore, the plate is deformed plastically. Consequently, a permanent deflection can be observed. As expected, the maximum strain is observed on the gauge J9C which is in target centre.
To check this affirmation, we plot in Figure 8, the strain-gauge signals of the test T0545, i.e., an impact on a 5-mm thick plate with an angle of 45◦. We can observe, for
Figure 7. Maximum strain induced after the impact. (a) Plate thickness: 5 mm; (b) Plate thickness: 10 mm.
Figure 8. The strain recorded by the central gauge (J9C, plate thickness: 5 mm, impact angle: 45◦).
example on Figure 8, a strain of 0.74% on gauge J9C by the end of the recording (after 42 ms). This strain is the plastic strain induced in the plate. Recall that maximum strain induced on gauge J9C is about 0.93%. The difference between the two values is 0.19% which corresponds to the maximum elastic strain. It is worth recalling here that the maximum elastic strain of the 5754 H111 aluminium alloy, which is determined by tensile tests, is about 0.2% (section 3.1). Therefore, the two values are coherent.
3.4. Loss of the ball kinetic energy
In this section, we are interested in kinetic energy lost af-ter the impact. Before the impact, the projectile had some kinetic energy which is defined by
K0=
mV2 0
2 , (1)
where m is the projectile mass (recall that V0is the impact velocity). After the impact, this energy is split in three parts: residual kinetic energy of the projectile Kr, mechanical
energy transmitted to the target W and heat dissipation Q. In other terms,
K0= Kr+ W + Q. (2)
Note that the deformation energy of the projectile is ne-glected because it recovers its initial shape after the impact. The heat dissipation is mainly due to friction between the target and the projectile.
Let ρK be the ratio between the residual and initial
kinetic energy of the rubber ball. It can be written as
ρK = Kr K0 = Vr2 V2 0 . (3)
Recall that Vr is the projectile residual velocity. This
ve-locity is measured by the analysis of images obtained by high-speed video cameras. More details, on this measure-ment technique, are given in section 3.5. The values of Vr
for each test are given in Table 2.
We can anticipate that the normal impact velocity V0n=
V0sin (α) (α is the impact angle) is a pertinent parameter that influences the kinetic energy ratio ρK. That’s why we
plot in Figure 9 this ratio in terms of the normal impact velocity and not in terms of the impact velocity V0. From this figure, it comes out that V0nhighly influences the kinetic energy ratio. Indeed, ρKdrops from 0.45 to 0.05 when V0n
increases from 40 to 130 m/s. In other words, 55% of the kinetic energy is lost at normal impact velocity of about 40 m/s. This energy loss raises to 95% when normal impact velocity is about 130 m/s.
Table 2. Velocity of the rubber ball before and after impact. Test label T1090 T1045 T1020 T0590 T0545 T0520 Impact velocity (m/s) 131.5 129.9 122.8 127.1 131.4 134.4 Residual velocity (m/s) 28.9 52.6 82 20.2 52.5 90.1 3.5. Video observations
Some qualitative and quantitative information can be in-ferred from video observations. Firstly, it can be checked that the projectile recovers its initial shape after the impact. This observation is in line with the assumption made in section 3.4. To be convinced, we can compare the images (a) and (i) of Figure 10. In the two images, the spherical shape of the projectile can be distinguished. Furthermore, we can observe on the image (d) of the same figure that the projectile is highly deformed during the impact. Indeed, the projectile, with an initial spherical shape, takes the shape of a disk. The nominal strain in the projectile is higher than 90%. The video sequences (Figure 10) are also important to have an idea of the impact duration. Precisely, the contact between the target and the projectile lasts less than 1 ms (images b–h).
Video observations can be used also to measure pro-jectile velocity before and after the impact. Precisely, we consider the position of the projectile centre in two images. This position is expressed in terms of pixels and then in mm. Therefore, we can deduce the distance δ travelled by the projectile during the time τ separating the two images. The velocity is simply δ/τ . The accuracy of this method depends on the camera resolution and the acquiring rate. This method was compared to the laser barrier method. The difference between the two methods in measuring the impact velocity is in the range of±5 m/s.
Figure 9. Kinetic energy ratio in terms of the normal impact velocity.
Figure 10. Video sequence of test T1090 (plate thickness: 10 mm, impact angle: 90◦).
4. Conclusion
In this paper, we presented an experimental set-up which is able to investigate rubber ball impacts on aluminium plates. The experimental data are necessary to understand the physics of such problems, to propose models and to validate numerical simulations. In this work, we developed experimental set-up allowing impact angles ranging from 20◦to 90◦with a step of 5◦. The projectiles are rubber balls with a diameter of 42 mm. They are launched against 500× 500 mm aluminium alloy plates. The impact velocities are about 130 m/s. Multiple experimental data were obtained and can be used to validate numerical models. Precisely, we carried out six experiments: three impacts angles× two plate thicknesses. For these experiments, we evaluated the permanent after-impact deflection of the target. Further-more, we recorded strain at several positions on the plate and its support. These measurements were used to evaluate the maximum strain induced in the plate and to check if the plate is deformed plastically or not. We also quantified the loss of kinetic energy after the impact. Finally, several qualitative conclusions are inferred from high-speed video cameras. This experimental methodology was developed in order to make up for the lack of experimental data in this field. Indeed, only one paper, which studied such prob-lems experimentally, is found in literature. The developed
methodology can also be applied to study rubber ball im-pacts on composite plates as the use of composite materials is increasing in aircraft structures.
Acknowledgements
AIRBUS is highly acknowledged for the financial support of this research.
References
[1] A. Adams and H.M. Lankarani, A modern aerospace
mod-eling approach for evaluation of aircraft fuselage crashwor-thiness, Int. J. Crashworthiness 8 (2003), pp. 401–413.
[2] A.A. Almohandes, M.S. Abdel-Kader, and A.M. Eleiche,
Experimental investigation of the ballistic resistance of steel-fiberglass reinforced polyester laminated plates,
Com-posites B (1996), pp. 447–458.
[3] S. Aloui, R. Othman, P. Gu´egan, A. Poitou, and S. ElBorgi,
Non-parametric identification of the non-homogeneous stress in high strain-rate uni-axial experiments, Mech. Res.
Comm. 35 (2008), pp. 392–397.
[4] I. BenNaceur, R. Othman, P. Gu´egan, A. Dhieb, and F. Dammek, Sensitivity of the flow stress of Nylon 6 and
Ny-lon 66 to strain-rate, Int. J. Modern Phys. B 22 (2007), pp.
1249–1254.
[5] P.W. Bland and J.P. Dear, Observations on the impact
be-haviour of carbon-fibre reinforced polymers for the qualita-tive validation models Composites A Appl. Sci. Manuf. 32
[6] T. Borvik, A.H. Clausen, M. Eriksson, T. Berstad, O.S. Hopperstad, and M. Langseth, Experimental and
numeri-cal study on the perforation of AA6005-T6 panels Int. J.
Impact Eng. 32 (2005), pp. 35–64.
[7] M.N. Bussac, P. Collet, G. Gary, and R. Othman, An
optimisation method for separating and rebuilding one-dimensional dispersive waves from multi-point measure-ments: Application to elastic or viscoelastic bars, J. Mech.
Phys. Solids 50 (2002), pp. 321–349.
[8] W.J. Cantwell and J. Morton, Comparison of low and high
velocity impact response of CFRP, Composites 20 (1989),
pp. 545–551.
[9] D.T. Casem, W. Fourney, and P. Chang, Wave separation in
viscoelastic pressure bar using single-point measurements of strain and velocity, Polymer Testing 22 (2003), pp. 155–
164.
[10] J. Christopherson, M. Mahinfalah, G. Nakhaie Jazar, and M. Rastgaar Aagaah, An investigation on the effect of a
small mass impact on sandwich composite plates,
Compos-ites Struct. 67 (2005), pp. 299–306.
[11] B. Galpin, V. Grolleau, S. Umiastowski, G. Rio, and L. Mah´eo L, Design and application of an instrumented
pro-jectile for load measurements during impact, Int. J.
Crash-worthiness 13 (2008), pp. 139–148.
[12] F. Grytten, T. Borvik, O.S. Hopperstad, and M. Langseth,
Experimental and numerical study on the perforation of AA6005-T6 panels, Int. J. Impact Eng. 32 (2005), pp. 35–64.
[13] B. Gu and F.K. Chang, Energy absorption features of 3-D
braided rectangular composite under different strain rates compressive loading, Aero. Sci. Tecnol. 11 (2007), pp. 535–
545.
[14] N.K. Gupta, M.A. Iqbal, and G.S. Sekhon, Experimental and
numerical studies on the behaviour of thin aluminium plates subjected to impact by blunt- and hemispherical-nosed pro-jectiles, Int. J. Impact Eng. 32 (2006), pp. 1921–1944.
[15] N.K. Gupta and V. Madhu, An experimental study of normal
and oblique impact of hardcore projectile on single and layered plates, Int. J. Impact Eng. 19 (1997), pp. 395–414.
[16] S. Heimbs, D. Vogt, R. Hartnack, J. Schlattmann, and M. Maier, Numerical simulation of aircraft interior components
under crash loads, Int. J. Crashworthiness 13 (2008), pp.
511–521.
[17] K.E. Jackson, Impact testing and simulation of a
crashwor-thy composite fuselage concept, Int. J. Crashworthiness 6
(2001), pp. 107–121.
[18] E. Jacquelin and P. Hamelin, Force recovered from three
recorded strains, Int. J. Solids Struct. 40 (2003), pp. 73–88.
[19] D. Karagiozova and R.A.W. Mines, Impact of aircraft
rub-ber tyre fragments on aluminium alloy plates: II-Numerical simulation using LS-DYNA, Int. J. Impact Eng. 34 (2007),
pp. 647–667.
[20] X. Ke, M.A. Sutton, S.M. Lessner, and M. Yost, Robust
stereo vision and calibration methodology for accurate three-dimensional digital image correlation measurements on submerged objects, J. Strain Anal. Eng. Design 43 (2008),
pp. 689–704.
[21] T. Kermanidis, G. Labeas, M. Sunaric, A.F. Johnson, and M. Holzapfel, Bird strike simulation on a novel composite
leading edge design, Int. J. Crashworthiness 11 (2006), pp.
189–201.
[22] J. Knapp, E. Altmann, J. Niemann, and K.D. Werner,
Mea-surement of shock events by means of strain gauges and accelerometers, Measurement 24 (1998), pp. 87–96.
[23] D. Lawver, L. Nikodym, D. Tennant, and H. Levine,
Non-linear numerical modelling of aircraft impact, Int. J.
Crash-worthiness 6 (2001), pp. 451–469.
[24] J. L´opez-Puente, R. Zaera, and C. Navarro, Experimental
and numerical analysis of normal and oblique ballistic im-pacts on thin/epoxy woven laminates, Composites A Appl.
Sci. Manuf. 39 (2008), pp. 374–387.
[25] M.A. McCarthy, J.R. Xiao, C.T. McCarthy, A. Kamoulakos, J. Ramos, J.P. Gallard, and V. Melito, Modelling bird impacts
on an aircraft wing. Part 2: Modelling the impact with an SPH bird model, Int. J. Crashworthiness 10 (2005), pp. 51–
59.
[26] M.A. McCarthy, J.R. Xiao, N. Petrinic, A. Kamoulakos, and V. Melito, Modelling bird impacts on an aircraft wing. Part
1: Material modelling of the fibre metal laminate leading edge material with continuum damage mechanics, Int. J.
Crashworthiness 10 (2005), pp. 41–49.
[27] F.X. Meng, Q. Zhou, and J.L. Yang, Improvement of
crash-worthiness behaviour for simplified structural models of air-craft fuselage, Int. J. Crashworthiness 14 (2009), pp. 83–97.
[28] R.A.W. Mines, S. McKown, and R.S. Birch, Impact of
air-craft rubber tyre fragments on aluminium alloy plates: I-Experimental, Int. J. Impact Eng. 34 (2007), pp. 627–646.
[29] R.A.W. Mines, C.M. Worral, and A.G. Gibson, Low
veloc-ity perforation behaviour of polymer composite sandwich panels, Int. J. Impact Eng. 21 (1998), pp. 855–879.
[30] S.N. Nguyen, E.S. Greenhalgh, R. Olsson R, L. Iannucci, and P.T. Curtis, Modeling the lofting of runway debris by
aircraft tires, J. Aircraft 45 (2008), pp. 1701–1714.
[31] R. Othman, M.N. Bussac, P. Collet, and G. Gary, S´eparation
et reconstruction des ondes dans les barres ´elastiques et visco´elastiques partir de mesures Redondantes, C. R. Acad
Sci S´er IIb 329 (2001), pp. 369–376.
[32] R. Othman and G. Gary, Testing aluminium alloy from
quasi-static to dynamic strain-rates with a modified split Hopkin-son bar method, Exp. Mech. 47 (2007), pp. 295–299.
[33] R. Othman, P. Gu´egan, G. Challita, D. LeBreton, and F. Pasco, A modified servo-hydraulic machine for testing at
intermediate strain-rates, Int. J. Impact Eng. 36 (2009), pp.
460–467.
[34] P.L. Reu and T.J. Miller, The application of high-speed
digi-tal image correlation, J. Strain Anal. Eng. Design 43 (2008),
pp. 673–688.
[35] S.A. Ritt and A.F. Johnson, Load pulse determination in gas
gun impact tests, Proceeding of the 5th International
Con-ference on Advances in Experimental Mechanics, Applied Mechanics and Materials, Vol. 7–8 (2007), pp. 259–264. [36] T. Saburia, S. Kubotaa, M. Yoshidab, Y. Wadaa, and Y.
Ogataa, Experimental impact study using an explosive
driven projectile accelerator and numerical simulation, Int.
J. Impact Eng. 35 (2008), pp. 1764–1769.
[37] J.M. S´anchez-Pena, C. Marcos, M.Y. Fern´andez, and R. Zaera, Cost-effective optoelectronic system to measure the
projectile velocity in high-velocity impact testing of aircraft and spacecraft structural elements, Opt. Eng. 46 (2007),
051014, doi:10.1117/1.2740771.
[38] R.P. Singh and V. Parameswaran, An experimental
investi-gation of dynamic crack propainvesti-gation in a brittle material reinforced with a ductile layer, Measurement 40 (2003), pp.
289–306.
[39] R. Vignjevic and M. Meo,A new concept for a helicopter
sub-floor structure crashworthy in impacts on water and rigid surfaces, Int. J. Crashworthiness 7 (2002), pp. 321–330.