S E Biotechnol. Agron. Soc. Environ. 1998 2 (4), 227–233
Studies on the value of incorporating the effect of
dominance in genetic evaluations of dairy cattle, beef
cattle and swine
Ignacy Misztal
(1), Luis Varona
(1), Matthew Culbertson
(1), (2)J. Keith Bertrand
(1),
John Mabry
(1), Thomas J. Lawlor
(3), Curtis P. Van Tassel
(4), Nicolas Gengler
(5)(1) University of Georgia. Athens (USA). (2)Cotswold USA. Alden, IA (USA).
(3) Holstein Association of America. Brattleboro, VT (USA).
(4) Animal Improvement Programs Laboratory. Agricultural Research Service, USDA. Beltsville, MD (USA).
(5) Unité de Zootechnie. Faculté universitaire des Sciences agronomiques de Gembloux. Passage des Déportés, 2. B–5030
Gembloux (Belgique). E-mail : gengler.n@fsagx.ac.be Submitted 3 April 1997, accepted 29 June 1998.
Nonadditive genetic effects are currently ignored in national genetic evaluations of farm animals because of ignorance of the level of dominance variance for traits of interest and the difficult computational problems involved. Potential gains from including the effects of dominance in genetic evaluations include “purification” of additive values and availability of predictions of specific combining abilities for each pair of prospective parents. This study focused on making evaluation with dominance effects feasible computationally and on ascertaining benefits of such an evaluation for dairy cattle, beef cattle, and swine. Using iteration on data, computing costs for evaluation with dominance effects included costs could be less than twice expensive as with only an additive model. With Method ℜ, variance components could be estimated for problems involving up to 10 millions equations. Dominance effects accounted for up to 10% of phenotypic variance; estimates were larger for growth traits. As a percentage of additive variance, the estimate of dominance variance reached 78% for 21-d litter weight of swine and 47% for post weaning weight of beef cattle. When dominance effects are ignored, additive evaluations are “contaminated”; effects are greatest for evaluations of dams in a single large family. These changes in ranking were important for dairy cattle, especially for dams of full-sibs, but were less important for swine. Specific combining abilities cannot be included in sire evaluations and need to be computed separately for each set of parents. The predictions of specific combining abilities could be used in computerized mating programs via the Internet. Gains from including the dominance effect in genetic evaluations would be moderate but would outweigh expenditures to produce those evaluations. K e y w o r d s . Livestock, dominance, variance components, Method ℜ, genetic evaluation, computerized mating system, Internet. Étude de l’intérêt de l’incorporation de l’effet de dominance dans l’évaluation génétique des bovins laitiers, des bovins viandeux et des porcs. Les effets génétiques non additifs ne sont pas considérés dans les évaluations génétiques pour les animaux domestiques ; ceci est dû à notre ignorance de l’importance de cet effet pour les caractères d’intérêt zootechnique et à la difficulté des calculs. Les avantages potentiels de la prise en compte des effets de dominance dans des évaluations génétiques sont, entre autres, le “nettoyage” des valeurs génétiques additives et la disponibilité d’estimation d’effets de combinaisons spécifiques pour chaque couple de parents potentiels. Nos études se sont focalisées sur la faisabilité d’évaluations génétiques incluant les effets de dominance et sur les avantages de telles évaluations. En utilisant des itérations sur les données, l’évaluation avec les effets de dominance est moins que deux fois plus complexe qu’un modèle uniquement additif. Avec la Méthode ℜ, les composantes de la variance ont pu être estimées pour des systèmes comprenant jusqu’à 10 millions d’équations et ceci pour bovins laitiers, bovins viandeux et porcs. Les effets de dominance ont été estimés à des valeur d’environ 10 % de la variance phénotypique ; les valeurs les plus élevées ont été observées pour des caractères de croissance. Exprimées en pourcentage de la variance additive, les estimations de la variance de dominance ont atteint 78 % pour le poids de la portée à 21 jours chez les porcs et 47 % pour la croissance post-sevrage chez les bovins à viande. Si on ignore les effets de dominance, les évaluations additives sont “contaminées” ; cette contamination est plus grande pour les évaluations de femelles issues d’une grande famille. Les changements de rang ont été très importants chez les bovins laitiers pour les mères de grands groupes de plein-frères, et moins importants chez les porcs. Les effets de combinaisons spécifiques ne peuvent évidemment pas être inclus dans un catalogue, mais doivent être calculés pour chaque couple de parents. Les
INTRODUCTION
The total genotypic value of an animal including additive, dominance, and epistatic effects is (Cockerham, 1954)
g = a + d + aa + ad + dd ...
where g is the genotypic value of an animal, a is the additive genetic effect, d is the dominance genetic effect, and aa, ad, ..., are epistatic genetic effects. The model can also include the effects of inbreeding (De Boer, Hoeschele, 1993) as
g = a + d + aa + ad + dd ... + ∆b
where ∆ is the inbreeding depression per unit of inbreeding and b is an inbreeding coefficient.
The above equations can also be presented in a form that can be understood better by breeders: T B VX= A B VX+ S C Asire, dam=
A B Vs i r e+ A B Vd a m
+ SCAsire, dam
2
where TBVx is the total breeding value, ABVxis the estimated additive breeding value for a prospective animal x, and SCA is the specific combining ability between parents of animal x, sometimes called nicking effect. Thus, the components of nicking are the effects of dominance, epistasis, and inbreeding. Incorporation of inbreeding in the genetic evaluation is simple, but incorporation of epistatic information may be impossible (VanRaden et al., 1992). This study will concentrate on incorporating the effect of dominance in genetic evaluations and will extend results presented by Misztal et al. (1998).
MATERIALAND METHODS Dominance and genetic evaluation
Genetic evaluations currently ignore effects other than additive genetic effects. Consequently, ABV’s could be “contaminated”, and nicking effects are not used. The exact loss due to ignoring dominance is a function of the variance of nonadditive effects and the number of animals with dominance relationships. Issues in nonadditive evaluation were reviewed by Misztal et al. (1995).
Dominance has not been considered in current genetic evaluations for several reasons. First, in the past, computations with dominance effects included were restricted to problems for which the dominance relationship matrix could be inverted explicitly, i.e. to a few thousand animals (Henderson, 1985). Second, the importance of dominance as measured by the proportion of dominance variance to the phenotypic variance was not well known. Accurate estimates of variances due to dominance effects with an animal model require those estimates to be derived from data sets with at least 30,000 to 100,000 animals for populations with many full-sibs and from even larger data sets for cattle populations. Computing limitations necessitated the use of smaller populations, and, as a result, estimates of dominance variance were imprecise (e.g. Gengler et al., 1997b). Third, optimal use of dominance would require efficient mating systems with on-line access to all evaluations and pedigrees. Such systems were unavailable.
Hoeschele and VanRaden (1991) developed rules to create the inverse of the dominance relationship matrix at a much lower cost. Although those rules greatly increased the size of models with dominance effects, the computing costs were still high compared with costs for additive evaluations. For example, their procedures allowed evaluations with an animal model for a data set containing over 400,000 animals; processing cost, however, was approximately 40 times greater than for the model with only additive effects.
Estimation of variance components from larger data sets using the rules of Hoeschele and VanRaden (1991) (e.g., VanRaden et al., 1992) used a sire model, which considers only about one-fourth of the dominance information because full-sibs are treated as quarter sibs and three of the four types of three-quarter sibs are ignored. Therefore, estimates of dominance variance with a sire model have inflated standard errors and are potentially biased.
Dominance project
A project was undertaken to explore the feasibility of adding dominance effects into genetic evaluation systems. Specific project goals were:
– manageable computation of solutions for a model with dominance effects included;
prédictions d’effet de combinaisons spécifiques peuvent être utilisées dans les programmes d’accouplement par ordinateur par le réseau Internet. Les gains obtenus par l’inclusion des effets de dominance dans les évaluations sont limités, mais restent plus importants que les coûts estimés nécessaires pour produire de telles évaluations.
Mots-clés. Bétail, dominance, composantes de la variance, Méthode ℜ, évaluation génétique, système d’accouplements assistés par ordinateur, Internet.
– estimation of variance due to dominance effects for many traits of many species;
– determination of the level of contamination in ABV’s when dominance effects are ignored;
– development of a prediction system for calculation of specific combining abilities for arbitrary pairs of parents; and
– determination of the potential of additional gain when dominance effects are used in a mating system.
Computations
Addition of the inverse of the dominance relationship matrix to mixed model equations results in a large increase in the number of equations and in the number of nonzero elements in the coefficient matrix. To minimize the number of extra equations, the use of the recurrence rules of Hoeschele and VanRaden (1991) can be restricted to a single level of recursion. The influence of nonzero elements in the coefficient matrix on memory requirements can be minimized by the use of iteration on data (Misztal, Gianola, 1987). Method
ℜ (Reverter et al., 1994) allows for estimation of variance components with very large data sets while seeming to be able to account for selection bias. Misztal (1997) described the application of Method ℜ to estimation of dominance variance, and those results will not be duplicated here. If all these measures were combined, calculation of genetic evaluations using a dominance model was found to be less than twice as expensive as with use of an additive model. Therefore, estimation of variance of dominance effects using an animal model and Methodℜ could be applied to complete national data sets (Misztal, 1995).
Model and data for variance component estimation
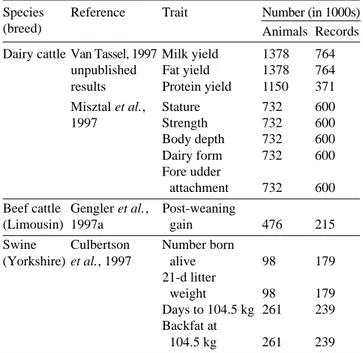
Data used in these studies included records of first-lactation yield (Van Tassell, 1997, unpublished results) and conformation (Misztal et al., 1997) of Holsteins (dairy cattle), post weaning gain of Limousins (Gengler et al., 1997a) (beef cattle), and reproduction and growth traits of Yorkshires (Culbertson et al., 1997) (swine). Table 1 gives details on the size of the data sets, which were all large (approximately 100,000 to 1.4 millions of animals and 200,000 to 800,000 records) compared with the data sets usually used.
All computations used the following type of model:
y = Xβ+ Zb∆+ Za + ZWf + ... + e,
where y is a vector of records, β is a vector of management and possibly other fixed effects, b is a vector of inbreeding coefficients, ∆is a coefficient of
inbreeding depression, a is a vector of animal additive genetic effects, f is a vector of parental dominance genetic effects, e is a vector of residual effects, and W,
X, and Z are appropriately dimensioned incidence
matrices. Models for specific traits and species also included effects of permanent environment, mate, or litter. All traits were analyzed independently as single traits.
Estimates with Method ℜused 50% subsets of the data selected randomly. Each analysis involved six subsets (three for yield traits of Holsteins). Sampling variance of the estimates was approximated as the variance of estimates obtained from different subsets.
Changes in ABV when dominance is ignored
To determine the influence of dominance effects on additive genetic evaluations, differences were examined between ABV from the dominance model and an additive model (the dominance model without f). Theoretical changes between the models were analyzed for four groups of animals:
– full-sibs with one record each, – parents of one full-sib family,
– parents of half-sibs with one record each, and – animals without records, with dam known, and with a sire with an evaluation of high reliability.
Parents had neither records nor pedigree information, and changes were analyzed as functions of size of full-sib groups. Theoretical changes in ABV for selected animal groups are in table 2.
Table 1. Size of data sets used to estimate dominance variance for several traits and species — Tailles de jeux de données pour estimer la variance d’effets de dominance pour plusieurs caractères et espèces.
Species Reference Trait Number (in 1000s)
(breed) Animals Records
Dairy cattle Van Tassel, 1997 Milk yield 1378 764 unpublished Fat yield 1378 764 results Protein yield 1150 371 Misztal et al., Stature 732 600 1997 Strength 732 600 Body depth 732 600 Dairy form 732 600 Fore udder
attachment 732 600 Beef cattle Gengler et al., Post-weaning
(Limousin) 1997a gain 476 215 Swine Culbertson Number born
(Yorkshire) et al., 1997 alive 98 179 21-d litter
weight 98 179 Days to 104.5 kg 261 239 Backfat at
Mating system
Nicking (or specific combining ability) must be calculated separately for each pair of parents. Equivalently, each sire can have multiple estimates of genetic merit: one for each potential mate. Assuming that the populations contains 1000 sires that each are evaluated for 20 traits and that can be mated to 1 million of cows, the total number of special combining effects to compute would be 20 billions. Such a huge volume obviously would not fit into a sire catalog and, furthermore, would be impossible to store except at installations with large computers.
An obvious but imperfect solution would be to select animals based only on additive effects with the hope that the presence of the nonadditive effects in the model for genetic evaluation would increase the accuracy of the solutions for the additive effects. Uimari and Kennedy (1990) have shown that such a practice leads to inflated predictions of genetic gain. S i m i l a r l y, correction for inbreeding in the model favours highly inbred sires and inflates predictions of the additive effect (Lawlor et al., 1993).
Complete use of nonadditive evaluations would require the use of a mating system (DeStefano, Hoeschele, 1992) as shown in figure 1. This system would be computerized and could be located at data processing centers, national research sites, or at breed associations. Predictions for each mating could be obtained through the Internet. On input, such a system would accept a list of cows to be mated and selection criteria specified by the breeder, such as weights for individual traits and maximum costs of semen. Then the system would consider mating each cow to a number of sires with all effects computed as necessary in the process and would select a combination with the highest overall index. To compute nonadditive adjustments for each potential mating, the mating system would need access to complete results of the recent evaluation and to a complete pedigree. Selection on combining abilities requires calculation of a prediction of the parental combination for all possible pairs of individuals in the population.
However, with the current procedures of evaluation, only parental combinations directly related with data are available (Hoeschele, Van Raden, 1991; Misztal, 1997). The aim of this study also was to develop a procedure that allows prediction of the value of any parental combination from the solution vector of the previously solved mixed model equations and to evaluate potential increase in genetic response under the conditions of a simulation study.
RESULTS AND DISCUSSION
Estimation of additive and dominance variances
Estimates of additive and dominance effects as a percentage of phenotypic variance are in table 3 for several traits. Conformation traits with an estimated dominance variance of < 4% were omitted. Therefore, results for rump angle, thurl width, rear leg set, foot angle, udder height, udder width, udder cleft, udder depth and front teat placement are not included in
table 3. Most estimates of dominance variance were
clearly lower than the corresponding estimates of additive genetic variance, although considerable variation existed. For milk, fat, and protein yields, dominance variance was rather small (≤7%). Also, for most linear type traits, dominance variance was relatively small. Growth traits showed relatively large dominance variance: strength and body depth for dairy cattle, post-weaning gain for beef cattle, and 21-d litter weight and days to 104.5 kg for swine. A recent study showed even larger values for dominance variance for post-weaning gain after some model changes (Gengler et al., 1998). The low estimates for number born alive were surprising and contradicted the common belief Table 2. Expected changes in additive evaluations for
different animal groups — Changements attendus dans les évaluations additives pour différents groupes d’animaux. Animal group Size of full-sib family
(dominance standard deviation units)
1
∞
Full sibs ~0 .3 to .5
Parents of full-sibs Up to twice the change in progeny
Parents of half-sibs ~0 0
Progeny Up to half the change in parents
Figure 1. Computerized mating system integrating results from last genetic evaluation and population structure into mating recommendations using eventually interactive Internet requests — Système d’accouplement par ordinateur intégrant les résultats de la dernière évaluation génétique et la stru c t u re de la population dans des recommandations d’accouplements en utilisant des requêtes interactives par Internet.
Results of last genetic evaluation (Additive and parental dominance) Selection criteria Mating recommendations List of cows to mate Population pedigrees Computerized Mating System (e.g., INTERNET based)
that low heritability in the narrow sense may hide clearly higher heritability in the broad sense.
Changes in ABV when dominance is ignored
Changes in prediction of ABV were calculated for stature of Holsteins using all known records and pedigree information for approximately 3 millions of animals with 5 millions of records and for all traits of Yorkshires using the same data as for estimation of variance components. Changes for Holstein bulls were small, whereas changes for dams were larger. The largest change was for a dam with 21 full-sib progeny, no individual performance record, and uninformative parents. Her predicted ABV changed by 10 parental dominance standard deviations. This change was approximately twice the change in predicted ABV’s of her progeny, which changed by approximately 5 parental dominance standard deviations. Changes for Yorkshires were smaller than for Holsteins for both dams and sires. Although most Holstein dams had only a single full-sib family, Yorkshire dams averaged three such families. Consequently, changes due to dominance effects were averaged out. The results for dairy cattle might indicate eventual risks with extremely large full-sib families created through multiple ovulation and embryo transfer (MOET) schemes.
Predicting dominance effects for parental combinations
The number of possible parental combinations in the population is the number of reproducing dams
times the number of candidate sires. The model for the procedure of genetic evaluation and variance component estimation developed by Misztal (1997) included only parental combinations that are directly related to records. Therefore, only a small proportion of the possible parental combinations is available from solutions to the mixed model equations. The theory for the prediction of all possible combinations was provided by Henderson (1984, 1989).
Suppose that the goal is to predict the parental combination fx y between animals x and y given
solutions for available parental combinations (f). Define
The rules for computing F-1given by Hoeschele and
VanRaden (1991).
Then (Henderson, 1984; 1989) E (fxy|f) = FxyF-1f,
which can be simplified to a formula that requires only the inverse of one row of F*:
E (fxy|f) = ∑ –f
*ifxy,i
,
i≠xy fxy,xy
where fij are elements of the inverse of F* matrix.
Varona and Misztal (1998) give more details and a numerical example.
f F Fxy
f* =
[ ]
, var (f*) = F* =[ ]
fxy Fxy 1
Table 3. Estimates of variance components for several traits and species — Estimations des composantes de la variance pour plusieurs caractères et espèces.
Species Reference Trait Percentage of phenotypic Dominance in
(breed) variance % of additive
Additive Dominance variance
Dairy cattle Van Tassell, Milk yield 43.5 ± .7 5.7 ± .4 13
(Holstein) 1997 (unpublished Fat yield 42.6 ± .7 7.0 ± 1.2 16
results) Protein yield 40.6 ± .2 4.9 ± .8 12
Misztal et al., Stature 45.3 ± .3 6.9 ± 1.2 15
1997 Strength 27.8 ± .5 8.0 ± .7 29
Body depth 34.5 ± .3 9.8 ± .7 28
Dairy form 23.4 ± .4 5.3 ± 1.0 23
Fore udder attachment 24.3 ± .5 4.7 ± .7 19
Beef cattle Gengler et al., Post-weaning gain 21.0 ± 1.1 9.9 ± 1.6 47
(Limousin) 1997a
Swine Culbertson et al., Number born alive 8.8 ± .5 2.2 ± .7 25
(Yorkshire) 1997 21-d litter weight 8.1 ± 1.1 6.3 ± .9 78
Days to 104.5 kg 33.1 ± .4 10.3 ± 1.5 31
For analysis of 4 millions of Holsteins, computing times for an average herd initially were >10 h. This problem was traced to large pedigrees for some animals, which resulted in F* with a dimension of 2 0 , 0 0 0×20,000 or larg e r. In subsequent optimizations, pedigrees were limited to a maximum of five generations, and extremely small elements of f were not used in computations. As a result, computing time for an average herd was reduced to 2 min.
Potential gains with a mating system
Varona et al. (1998) analyzed gains with a mating system that selected sires based on additive evaluations but considered the effect of dominance when sire use was allocated within herd. Genetic gains were dependent on heritability and fraction of full-sibs in the population and averaged about .2 standard deviations for parental dominance effect. Potential gains due to utilizing dominance effects in mating plans would be smaller for younger parents, for which parental dominance effect would not be available, and larger for older parents with many full-sib progenies and well estimated parental combination eff e c t s . Lawlor et al. (1998) estimated that genetic gains for Holsteins from a mating system that considered dominance effects would result in extra income of approximately US$28 per lactation. In this case, such a mating service would be attractive to farmers if the cost was less than US$5.
CONCLUSIONS
Genetic evaluations that consider dominance effects are now feasible computationally for large populations. Dominance variance can be estimated with low sampling variance from extremely large data sets. Dominance variation has been found to be moderately important for selected traits of dairy and beef cattle and of swine. The absence of dominance in evaluation procedures could lead to decreased accuracies of ABV’s for full-sib families, particularly for embryo donors for cattle. Changes in ABV’s of proven sires would be small. Dominance information would be utilized best in a mating system that could also use inbreeding information (Boswerger et al., 1994). Genetic gains from using dominance information would not be large but would outweigh expenditures to derive the information.
Acknowledgments
I. Misztal and L. Varona acknowledge the financial support of the Holstein Association USA. N. G e n g l e r, who is Chargé de Recherches of the Fonds National Belge de la Recherche Scientifique, acknowledges its financial support.
The authors thank L. D. Van Vleck, ARS, USDA, Meat Animal Research Center, Lincoln, USA; K. A . We i g e l , University of Wisconsin, Madison, USA; K. G. Boldman, De Kalb Genetics Corporation, Savoy, USA; and S. M. Hubbard, Animal Improvement Programs Laboratory, ARS, USDA, Beltsville, USA, for manuscript review.
Bibliography
Boswerger BHG., Lawlor TJ., Allaire FR. (1994). Expected progeny production gain by balancing inbreeding depression and selection. J. Dairy Sci. 77 (Suppl.1), p. 201.
Cockerham CC. (1954). An extension of the concept of partitioning hereditary variance for analysis of variance when epistasis is present. Genetics 39, p. 859–882. C u l b e r t s o n MS., Mabry J W., Misztal I., Gengler N . ,
B e r t r a n d JK., Va r o n a L. (1997). Estimation of dominance variance in purebred Yorkshire swine. J. Anim. Sci. 76, p. 448–451
d e B o e r IJM., Hoeschele I. (1993). Genetic evaluation methods for populations with dominance and inbreeding. Theor. Appl. Genet. 86, p. 245–258. D e S t e f a n o AL., Hoeschele I. (1992). Utilization of
dominance variance through mate allocation strategies. J. Dairy Sci. 75, p. 1680–1690.
Gengler N., Misztal I., Bertrand JK. (1997a). Relationships between estimates of heterosis and dominance variance for post-weaning gain in US Limousin cattle. J. Anim. Sci. 75 (Suppl. 1), p. 149.
G e n g l e r N., Va n V l e c k LD., MacNeil MD., Misztal I . , P a r i a c o t e FA. (1997b). Influence of dominance relationships on the estimation of dominance variance with sire-dam subclass effects. J. Anim. Sci. 7 5, p. 2885–2891.
G e n g l e r N., Misztal I., Bertrand JK., Culbertson M S . (1998). Estimation of the dominance variance for postweaning gain in the US Limousin population. J. Anim. Sci. 76, p. 2515–2520.
Henderson CR. (1984). Applications of linear models in animal breeding. University of Guelph, Canada. ISBN 0-88955-030-1.
Henderson CR. (1985). Best linear unbiased prediction of nonadditive genetic merits in noninbred populations. J. Anim. Sci. 60, p. 111–117.
Henderson CR. (1989). Prediction of merits of potential matings from sire-maternal grandsire models with nonadditive genetic effects. J. Dairy Sci. 7 2, p. 2592–2605.
Hoeschele I., VanRaden PM. (1991). Rapid inversion of dominance relationship matrices for noninbred populations by including sire by dam subclass effects. J. Dairy Sci. 74, p. 557–569.
Lawlor TJ., Weigel KA., Misztal I. (1993). Implications of incorporating inbreeding information into animal model evaluations for type. J. Dairy Sci. 76 (Suppl. 1), p. 292.
Lawlor TJ., Klei L., Misztal I., Varona L. (1998). Managing inbreeding and utilizing dominance effects in a herd mating program. J. Dairy Sci. 81 (Suppl. 1) (in press). Misztal I. (1995). Feasibility of a large-scale evaluation
with the dominance effect. J. Dairy Sci. 78 (Suppl. 1), p. 247.
Misztal I. (1997). Estimation of variance components with l a rge-scale dominance models. J. Dairy Sci. 8 0, p. 965–974.
Misztal I., Gianola D. (1987). Indirect solution of mixed model equations. J. Dairy Sci. 70, p. 716–723.
M i s z t a l I., Fernando RL., Grossman M., Lawlor T J . , L u k a s z e w i c z M. (1995). Dominance and epistatic effects in genetic evaluation of farm animals. Anim. Sci. Pap. Rep. 13, p. 251–266.
Misztal I., Lawlor TJ., Gengler N. (1997). Relationships among estimates of inbreeding depression, dominance and additive variance for linear traits in Holsteins. Genet. Sel. Evol. 29, p. 319–326.
M i s z t a l I, Va r o n a L., Culbertson M., Gengler N . , B e r t r a n d JK., Mabry J., Lawlor TJ., Va n Ta s s e l l C P. (1998). Studies on the value of incorporating effect of dominance in genetic evaluations of dairy cattle, beef cattle, and swine. Proc. 6th World Congr. Genet. Appl. Livest. Prod. 25, p. 513–516.
Reverter A., Golden BL., Bourdon RM. (1994). Method ℜ variance components procedure: application on the simple breeding value model. J. Anim. Sci. 7 2, p. 2247–2253.
U i m a r i P., Kennedy B W. (1990). Mixed model m e t h o d o l o g y to estimate additive and dominance genetic values under complete dominance and inbreeding. Proc. 4th World Congr. Genet. Appl. Livest. Prod. 13, p. 297–300.
Va n R a d e n PM., Lawlor TJ., Short TH., Hoeschele I . ( 1 9 9 2 ) . Use of reproductive technology to estimate variances and predict effects of gene interactions. J. Dairy Sci. 75, p. 2892–2901.
Va r o n a L., Misztal I. (1998). Prediction of parental dominance combinations for planned matings. Methodology and simulation results. Proc. 6th World Congr. Genet. Appl. Livest. Prod. 25, p. 593–596. Va r o n a L., Misztal I., Bertrand JK., Lawlor TJ. (1998).
Effect of full-sibs on additive breeding values under the dominance model for stature in United States Holsteins. J. Dairy Sci. 81, p. 1126–1135.