UNSUPERVISED SEGMENTATION OF INDOOR 3D POINT CLOUD:
APPLICATION TO OBJECT-BASED CLASSIFICATION
F. Poux 1, *, C. Mattes 2, L. Kobbelt 2
1 Geomatics Unit, University of Liège (ULiege), Belgium; [email protected] 2 Visual Computing Institute, RWTH Aachen University- [email protected]
KEY WORDS: Region Growing, unsupervised segmentation, 3D Point cloud, Classification, Random Forest, Feature extraction,
RANSAC, Self-learning
ABSTRACT:
Point cloud data of indoor scenes is primarily composed of planar-dominant elements. Automatic shape segmentation is thus valuable to avoid labour intensive labelling. This paper provides a fully unsupervised region growing segmentation approach for efficient clustering of massive 3D point clouds. Our contribution targets a low-level grouping beneficial to object-based classification. We argue that the use of relevant segments for object-based classification has the potential to perform better in terms of recognition accuracy, computing time and lowers the manual labelling time needed. However, fully unsupervised approaches are rare due to a lack of proper generalisation of user-defined parameters. We propose a self-learning heuristic process to define optimal parameters, and we validate our method on a large and richly annotated dataset (S3DIS) yielding 88.1% average F1-score for object-based classification. It permits to automatically segment indoor point clouds with no prior knowledge at commercially viable performance and is the foundation for efficient indoor 3D modelling in cluttered point clouds.
1. INTRODUCTION
Automation in point cloud data processing is central for efficient decision-making systems and to cut labour costs. The identification of objects of interest in these massive datasets constitute the base of many applications. While new supervised deep learning architectures show promising results, the amount of available labelled 3D data is often insufficient for a good generalisation (Poux et al., 2018).
The creation of labelled dataset for training machine learning models is a tedious task. Unsupervised algorithms are particularly useful in the frequent cases where it is expensive to label data. Take the example of annotating a massive point cloud. Annotating each point by what it represents can be a long and tiresome job, to the point that the people doing it can unintentionally introduce errors through inattention or fatigue. It is cheaper and perhaps even more efficient to let a clustering algorithm group similar points together and then only involve a human operator when assigning a label to the cluster. But to this end, the underlying algorithm should provide relevant segments. In this paper, we propose an unsupervised segmentation framework to group points in clusters without domain knowledge. The approach was designed supported by the fact that, to the extent of our knowledge, there exist very few fully unsupervised – in the sense there is no need for training data or user input – algorithm dedicated to this task.
Our proposal was designed to minimise breaking points in long pipelines and provides a self-learning parameter extraction to permit generalisation without user supervision. To test its potential for the task of classification (i.e. semantic segmentation), we offer an object-based classification routine using features that work well with supervised classifiers.
* Corresponding author
The paper is structured as follow. Section 2 presents a concise list of related works. Section 3 proposes a methodology including parameter extraction, unsupervised region-growing and feature extraction for object-based classification. Section 4 displays the results, and Section 5 highlights the key take-aways and limitations that are addressed in future works.
2. RELATED WORKS
Point Cloud « pure » segmentation algorithms are mainly based on strict hand-crafted features from geometric constraints, heuristics and rules. The primary process aims at grouping raw 3D points into unique regions. Those regions correspond to specific structures or objects in one scene with a certain degree of representativity (an object of interest can be "oversegmented" or "undersegmented"). Since no supervised prior knowledge is required, the delivered results have no "strong" semantic information, which is the task of classification, also known as semantic segmentation or labelling. However, to reduce the calculation cost, a frequently used strategy is to over-segment a raw point cloud into small regions before applying expensive algorithms that benefit from the new grouping.
Voxels can be regarded as the most straightforward over-segmentation structures, extended to supervoxels which can primarily reduce the data volume of a raw point cloud at the cost of some information loss and minimal overlapping. The work of Weber et al. provides the first approach of using relationships while conserving the point-based flexibility (Weber et al., 2010). They propose an over-segmentation algorithm using 'supervoxels', an analogue of the superpixel approach for 2D methods. Based on a local k-means clustering, they try and group the voxels with similar feature signatures (39-dimensional vector) to obtain segments. The work is interesting because it is one of the earliest to try and propose a voxel-clustering to propose a generalist decomposition of point cloud data in
The International Archives of the Photogrammetry, Remote Sensing and Spatial Information Sciences, Volume XLIV-4/W1-2020, 2020 3rd BIM/GIS Integration Workshop and 15th 3D GeoInfo Conference, 7–11 September 2020, London, UK
segments. Son et Kim use such a structure in (Son and Kim, 2017) for indoor point cloud data segmentation. They aim at generating the as-built BIMs from laser-scan data obtained during the construction phase. Their approach consists of three steps: region-of-interest detection to distinguish the 3D points that are part of the structural elements to be modelled; scene segmentation to partition the 3D points into meaningful parts comprising different types of elements while using local concave and convex properties between structural elements; and volumetric representation. The approach clearly shows the dominance of planar features in man-made environments. Another very pertinent work is (Wang et al., 2017), which proposes a SigVox descriptor. The paper first categorises object recognition task following the approach of (1) model-fitting based (starts with segmenting and clustering point cloud, followed by fitting point segments); (2) semantic methods (based on a set of rule-based prior knowledge); and, (3) shape-based methods (shape featuring from implicit and explicit point clusters). They use a 3D 'EGI' descriptor to differentiate voxels that only extract specific values from a Principal Component Analysis (PCA) (Liu and Ramani, 2009). The approach proves useful for MLS point clouds, grouping points in object candidates, following the number.
Region growing is another classical point cloud segmentation method which is still widely used today. It is initially derived from images at the pixel level (2D), emerged in 2.5D LiDAR data (possible raster projection), and is now employed at the point level (3D) or the voxel level (3D). 3D region growing comprises two main steps: the selection of seed points or seed units and then the region growing driven by some principles to obtain groups of points following some similarity measure. This technique has been applied in the segmentation of planar building structures in (Deschaud and Goulette, 2010; Xiao et al., 2013) or more recently in (Dong et al., 2018; Vo et al., 2015). However, we note that the validation was made on low-density dataset or with point cloud never exceeding more than some millions of points, which doesn't presume the complexity of large scale datasets. Non-universality is a non-trivial problem for region growing. The accuracy of these algorithms relies on the growth criteria and locations of the seeds, which should be predefined and adjusted for different datasets. Besides, these implementations are computationally intensive and may require a reduction in data volume for a trade-off between accuracy and efficiency. Also, the definition of the parameters driving the approaches is supervised and « empirical ». It largely limits the generalisation of such approaches.
Another strategy is the use of model-fitting approaches to match a point cloud or some subset to different primitive (geometric shapes). As man-made objects are predominant in indoor scenes, such approaches provide useful possibilities to detect an assembly of geometric shapes/models such as planes, spheres, cylinders. Therefore, model fitting can be regarded as a segmentation approach to cluster depending on the detected fitted models. The most widely used model-fitting methods are built on two well-known algorithms, the Hough Transform (HT), used in (Hulik et al., 2014; Limberger and Oliveira, 2015; Rabbani and Heuvel, 2005) and the RANdom SAmple Consensus (RANSAC) used successfully in (Li et al., 2017; Schnabel et al., 2007; Xu et al., 2016). One of the significant disadvantages of HT is the lack of boundaries in the parameter space, which leads to high memory consumption and long calculation time. Therefore, some studies have been conducted to improve the performance of HT by reducing the cost of the voting process (Limberger and Oliveira, 2015). Such algorithms can be found in the review (Xie et al., 2019). On the other side, RANSAC-based algorithms do
not require complicated optimisation or high memory resources. Compared to HT methods, efficiency and the percentage of auspicious detected objects are two main advantages for RANSAC in 3D point cloud segmentation. RANSAC is a nondeterministic algorithm, and thus its main shortcoming is its artificial surface: the probability exists that models detected by RANSAC-based algorithm do not exist in reality.
These strategies are then used to create segments, which constitute the base for object-based classification workflow. Works related to 3D Point Cloud are most often applied on Aerial LiDAR datasets, such as in (Miliaresis and Kokkas, 2007) to extract the building class from digital elevation models, (Zhang et al., 2012) to classify urban airborne LiDAR point clouds with multiple echoes using Support Vector Machine, or in (Rutzinger et al., 2008) for Urban Vegetation Classification. Newer approaches such as in (Vosselman et al., 2017) and (Poux et al., 2018; Poux and Billen, 2019) propose a contextual segment-based classification of point cloud data by leveraging essential proximity and topology features between segments.
In this brief state-of-the-art review of pertinent related work, we highlighted different directions that will drive our methodology. First, the definition of parameters for the segmentation approach should be as automatic as possible. Secondly, the performances and scalability should permit extensive point cloud processing. Finally, the level of supervision necessary should be minimal to permit a good generalisation.
3. METHODOLOGY
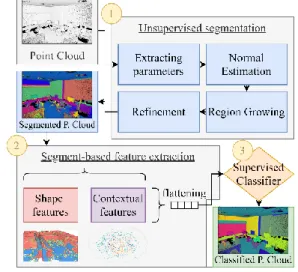
The applied workflow of unsupervised segmentation and object-based classification is organised as follows: first, the point cloud is analysed to extract, without supervision, relevant parameters for the normal estimation, region growing and refinement steps. Then, we extract a concise set of features from the segmented point cloud, for a short yet informative feature vector ensemble. Finally, we propose a Random Forest classification that leverages planar predominance in scenes.
Figure 1 Workflow of the methodology
3.1 Unsupervised segmentation
In the unsupervised segmentation step, the point cloud is partitioned into subsets of neighbouring points called segments. Our method only considers spatial coordinates (X,Y,Z) without using spectral values to better generalise the approach to different sensors and platforms at the cost of lower performances. We aim at a set of internally homogeneous segments, informative for classification tasks. Our segmentation procedures aim to produce
The International Archives of the Photogrammetry, Remote Sensing and Spatial Information Sciences, Volume XLIV-4/W1-2020, 2020 3rd BIM/GIS Integration Workshop and 15th 3D GeoInfo Conference, 7–11 September 2020, London, UK
relatively small segments, representing only object parts (sub-objects) rather than the final objects of interest directly. Then adjacent segments with similar properties can be merged to spatially contiguous objects. Such a step-wise procedure based on an initial over-segmentation permits to reduces the risk of combining multiple real-world objects in one segment (under-segmentation). The principle of the approach is to limit any domain knowledge as well as parameter tweaking to provide a fully unsupervised workflow. This is conducted in 4 steps as described below.
3.1.1 Data analysis: extracting heuristics
For usability and simplicity, we designed an automatic heuristic determination of three RANSAC-inspired parameters being the distance threshold for the region growing (ε); the threshold for the minimum number of points needed to form a valid planar region (τ); the decisive criterion for adding points to a region (α). As we are later using a principal component analysis (PCA) to compute the normals of the data points, we use additional information provided by an eigenanalysis of the neighbourhood of points for parameter's extraction.
ε is automatically defined so that the search radius is well above the noise level of each dataset. To estimate ε, we find the smallest neighbourhood radius such that the planarity from the eigenanalysis is above 50% for every point. Then we set ε as the median of these values, as we assume that roughly 50% of the points in the point cloud are part of a planar region. The actual choice of the percentage is usually non-critical, as for most datasets the median will be part of a large plateau of similar radii. The parameter τ, which is used as a threshold for the minimum number of points needed to form a valid planar region, contains more of a user preference than the value for ε (e.g. users might want regions above a specific surface area primarily). As the basis for this analysis, we recall that ε is chosen to be well above the width of the noise in the dataset. Thus, the minimal area of a region should be in the order of magnitude of a disk with radius ε, as this prevents regions assembled purely from noise data from being accepted. Since the area of a region is not clearly defined, we use a threshold number of points τ as stand-in. For this, we again analyse the neighbourhoods of the points in our dataset, this time counting the number of points inside an ε-sphere around each point. We then select τ0 as the median of these point counts.
In order to estimate α, which represents the maximum angle deviation between the normal of a point and the normal of a region for the point to be incorporated into that region, we imagine a sphere of radius 2ε. The choice is based on the fact that the PCA-based normal estimation will smooth out the normals at sharp corners to roughly resemble a section of a sphere of radius ε, thus making a sphere 2ε the smallest sphere that is reliably distinguishable from a hard corner of the same size. Such a sphere we consider desirable to include into the segmentation, rather than classifying it as clutter. For this in turn it is necessary to choose α in such a way that a region of size τ can be created along the sphere surface such that all its points fit into a cone with opening angle α and the tip coincident with the center of the sphere.
3.1.2 Normal Estimation
To develop a robust normal-based region growing approach, one needs to extract low-noise normals. Thus, the first step of our approach is to provide a normal per point. We start by
constructing a k-d tree spatial structure of the point cloud to permit quick nearest neighbors queries for each point. A radius search is used to obtain a locally representative subset of the point-cloud. We then use a PCA to estimate a local tangent plane and thus an extract an unoriented normal for the point. The main limitation of using PCA for the normal estimation is that we approximate the local neighborhood of every point in the point cloud with just a single tangent plane. While this approach delivers high quality normals for any point far away from sharp features, any points inside a range of the chosen radius around an edge or corner will be assigned a smoothed normal. While methods that robustly estimate normals yet successfully replicate sharp features in the point cloud are readily available (e.g. (Li et al., 2010)), these methods come with a substantial runtime overhead (x10 for the implementation provided by the authors of (Li et al., 2010) as compared to our own PCA-based implementation in Julia) which prompted us to rely on the PCA-based method instead.
3.1.3 Region Growing
Once each point is provided with a normal estimate, we establish a segmentation approach to obtain consistent planar regions from the point cloud. The region-growing method start by repeatedly selecting a random point that is not yet assigned to a region from the point cloud, and then determine the region it belongs to. If the number of points in the computed region exceeds the heuristic threshold τ, it is accepted as a large region. This process stops once the probability that all planes in the data set are found reaches a threshold of 99%.
The actual process of growing a region from a single seed point is driven by two sets of indices R, which contains the indices of all points we currently consider part of the region and F, the "Front", which references only those points that were added to R in the last iteration. Additionally, we keep an estimate of the normal n of the plane, as well as its center of mass c.
The algorithm starts by adding the seed point to both R and F and initialising n and c with the normal and position of the seed point. In every step of the growing procedure itself, all the points inside a k-neighborhood around any of the points in F are determined. Of the points in these neighborhoods we add those that have a normal that differs by an angle of at most α from n and have a position with a distance of at most 3ε to the plane defined by c and n are then added to the region R and become the new front F. The maximum width of the extracted region is chosen as 3ε to reduce unnecessary over-segmentation in accordance with the prior work of (Schnabel et al., 2007).
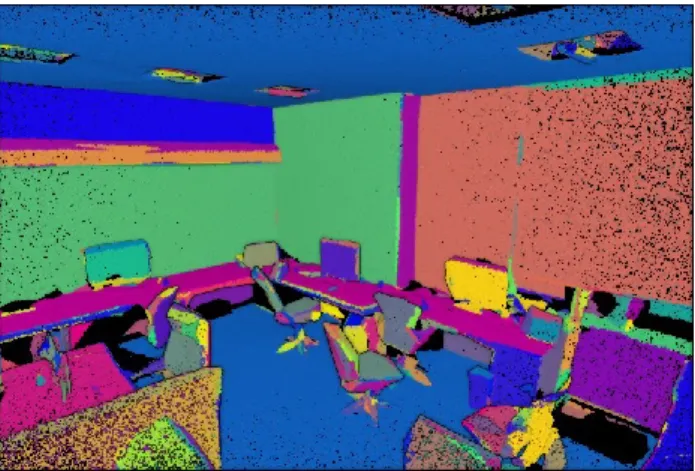
Figure 2 Segmentation results over an office area
The International Archives of the Photogrammetry, Remote Sensing and Spatial Information Sciences, Volume XLIV-4/W1-2020, 2020 3rd BIM/GIS Integration Workshop and 15th 3D GeoInfo Conference, 7–11 September 2020, London, UK
In order to reduce the impact, the selection of the seed point has on the extracted region, the plane estimate is refitted to R at exponentially increasing intervals using PCA on the point positions. After each refitting, the points that now fail to fulfill the normal and distance criteria for the new plane estimate are removed from the region.
3.1.4 Refinement
The edge-point refinement step was constructed to bypass the limitations of PCA-based normal estimation. Indeed, due to the nature of the PCA used for normal estimation, normals of hard edges in the point data will be smoothed out.
When applying the fast region growing method to a point cloud with PCA-derived normals, the points close to hard edges will therefore usually not be part of any region (unless α is set to at least half the edge angle). The edge-point refinement permits to correct this effect by reconsidering the assignment of formerly unassigned points in the cloud.
For every unassigned point, all regions that appear in the neighbourhood of the point will be considered. Of all found regions, we assign the point to the one region it is found closest to, provided it falls into an ε-band around the region. So compared to the original region growing approach, we effectively relinquish the normal angle criterion while keeping the plane distance criterion in effect. This refinement step, while fast and easy to implement, permits to obtain a segmentation of good quality even around sharp features, without the need to rely on computationally expensive methods to obtain artefact-free normals, such as the one presented by (Li et al., 2010).
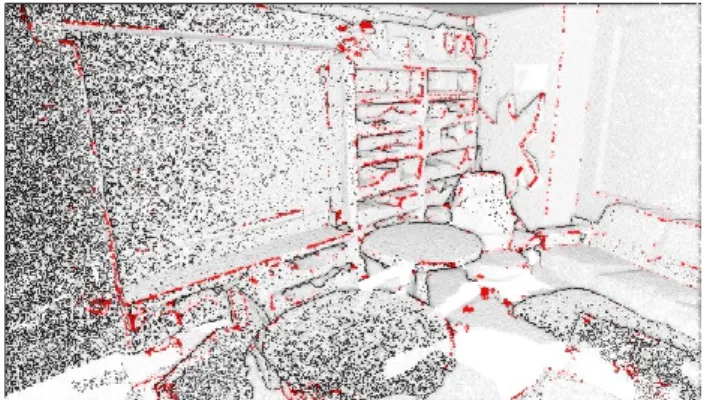
Figure 3 In red, all the points targeted, added to the closest region
3.2 Segment-based feature extraction
Any intelligent system basically consists of an end-to-end pipeline starting from ingesting raw data, leveraging data processing techniques to process and engineer meaningful features and attributes from this data. Then we usually pull techniques like statistical or machine learning models to act on these features, and then deploy a working model for future usage based on the problem to be solved at hand.
Point-based features, aside from sensor attributes, are usually extracted from the neighbourhood of the point. The neighbour search strategy (E.g. fixed number of neighbour points, search radius) has a predominant role as stated by (Weinmann et al., 2015). For the given neighbourhood point set, such features can describe the local point density, height distribution or deviations from a locally fitted plane, for instance. Eigen-based features derived from a 3D covariance matrix describing a point set are largely used as a descriptor for the shape of the points' distribution in 3D space.
In contrast to per-point features, object-based features exploit features that relate to segments (sub-objects). Such segment features can be the average or the standard deviation of all point-specific feature values in a segment. These segment features are often more representative for class characteristics than single point features, which can be very variable within a class and even within one object. Additional features, like segment shape and size, may also be useful to separate classes. We distinguish in this paper between local features and contextual features, and we refer the reader to the paper (Bassier et al., 2020) for an extended analysis on the impact of features.
3.2.1 Shape segment features
Typically, feature engineering is a drawn-out manual process, relying on domain knowledge, intuition, and data manipulation. Even though a lot of newer methodologies like deep learning and meta-heuristics aid in automated machine learning, each problem is domain-specific and better features (suited to the problem) is often the deciding factor of the performance of a system. Local features are engineered so that they are all relative to the dataset being processed and drop any absolute value. Then, they are scaled to a [0,1] interval. We selected only 9 standard features at no extra computational cost through an ensemble voting process: relative segment centroid (3), segment normal (3) and segment variance (tangent, bi-tangent and normal).
Then, we include 5 segments shape features based on segments eigenvectors to be invariant to translation and rotation: the length, width, height, surface and volume of each segment.
3.2.2 Contextual segment features
The ability to model context in terms of a spatial relationship (E.g. topology) between objects is an essential gain over point-based featuring. By taking into account segments at different scale levels, hierarchical relationships between elements and sub-elements can be established. Such topological relationships can, for instance, be used to correct misclassifications by applying topological rules. Contextual features build on the following: Number of neighbours, centrality eigenvalue, betweenness centrality, closeness centrality and degree centrality. Adjacent segments with similar properties can be merged to spatially contiguous objects. Such a step-wise procedure based on the initial over-segmentation permits to reduces the risk of combining multiple real-world objects in one segment (under-segmentation).
Figure 4 The graph-representation of segments connexions. The International Archives of the Photogrammetry, Remote Sensing and Spatial Information Sciences, Volume XLIV-4/W1-2020, 2020
3.3 Supervised classification
We use a Random forest classifier, a non‐parametric ensemble learner which can efficiently model non‐linear relationships, handle a large number of (potentially redundant) features and prevent overfitting (Belgiu and Drăguţ, 2016). It aggregates the results of several randomised decision trees by a majority vote, as explained in (Mayr et al., 2017). Each tree is built based on a bootstrap sample of the training instances (subsampling with replacement), and each tree node is split using a user-defined number of randomly selected features.
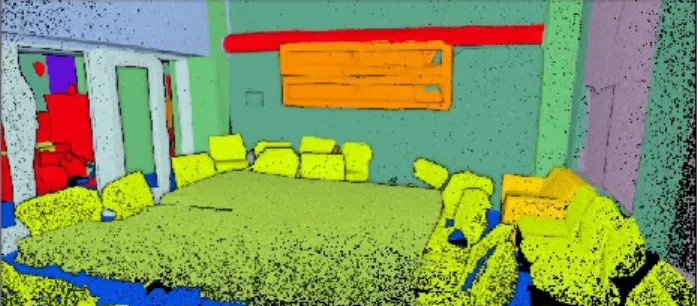
The classification procedure thus relies on a set of feature vectors that characterise the different classes while enabling a distinct separation, i.e. the classes must have a unique signature in the feature space, with sufficient differences between classes. The segments are assigned class labels based on their characteristic feature values. Figure 5 shows an example for object-based classification of furniture in a point cloud. Finally, semantic labels ('floor, 'ceiling', 'walls', "furnitures") are assigned a posteriori to these classes.
Figure 5 Result of the classification in a conference room
4. RESULTS 4.1 Metrics
To quantify the quality of our segmentation approach, we first determine an "ideal" segmentation from the ground truth data by identifying connected components of points with the same classification. This segmentation is ideal in the sense that it contains the minimum number of segments while still allowing a per-segment classification with perfect accuracy.
In practice however, due to the fact that our method identifies planar regions instead of more complex objects that will be assigned to a single class in the ground truth (such as a chair or a book case), a significant amount of oversegmentation is expected. While strong oversegmentation will impact the performance of the subsequent classification step, it will usually not reduce the quality of the classification.
We measure the oversegmentation of a ground-truth segment as the number of planar regions for which the current ground-truth segment has the largest overlap (measured in points). A more critical aspect of the segmentation is undersegmentation, i.e. the combination of multiple ground truth segments into a single extracted segment, as this actively limits the accuracy any per-segment classification can achieve. Similarly to oversegmentation, the undersegmentation of a planar region is measured as the number of ground-truth segments for which the current planar region has the largest overlap.
A low amount of under segmentation however does not directly imply a good segmentation quality, as a planar region might still overlap multiple ground-truth segments leading to misclassifications, while not making up a large enough fraction
of each segment to be counted as under segmentation. As more direct measure of the classification quality that we can achieve with a given segmentation, we first assign every planar region to the ground-truth segment that it has the largest overlap with. We then define the ``sharpness'' of the segmentation as the percentage of points where the ground-truth segment and the assigned segment of their planar region are identical. The sharpness of the segmentation is thus an upper bound for the accuracy that a subsequent region-based classification can achieve.
Existing literature has suggested several quantitative metrics for assessing the semantic segmentation and classification outcomes. We define the metrics regarding the following terms:
True Positive (TP): Observation is positive and predicted positive; False Negative (FN): Observation is positive but is predicted negative; True Negative (TN): Observation is negative and is predicted to be negative; False Positive (FP): Observation is negative but is predicted positive. Subsequently, the following metrics are used:
𝐼𝑜𝑈 ̅̅̅̅̅ = 𝑇𝑃 𝐹𝑃 + 𝐹𝑁 + 𝑇𝑃 𝐹1−𝑠𝑐𝑜𝑟𝑒= 2𝑇𝑃 2𝑇𝑃 + 𝐹𝑃 + 𝐹𝑁 (5) 𝑝𝑟𝑒𝑐𝑖𝑠𝑖𝑜𝑛 = 𝑇𝑃 𝑇𝑃 + 𝐹𝑃 𝑟𝑒𝑐𝑎𝑙𝑙 = 𝑇𝑃 𝑇𝑃 + 𝐹𝑁 (6)
The precision is the ability of the classifier not to label as positive a sample that is negative, the recall is intuitively the ability of the classifier to find all the positive samples. The F1-score can be
interpreted as a weighted harmonic mean of the precision and recall, thus giving a good measure of how well the classifier performs.
4.2 Segmentation and classification outcomes
A shortened summary of the over- and under-segmentation metrics, as well as the sharpness is presented in Table 1.
Dataset Oversegmentation Median 75% Max 99% Undersegmentation Sharpn. Max
Area 1 11 17 3883 1 9 89.92% Area 2 12 20 644 1 13 90.34% Area 3 11 21 427 1 9 91.25% Area 4 9 19 896 1 15 89.86% Area 5 10 18 1525 1 21 86.10% Area 6 11 18 794 1 9 90.61%
Table 1 Quantitative results of the segmentation
It becomes clear that our method introduces a significant amount of over-segmentation, which is expected as our method only recognises planar regions while segments in the ground-truth data set can be of any shape Figure 6.
Figure 6 Segmentation results over Area-1
The International Archives of the Photogrammetry, Remote Sensing and Spatial Information Sciences, Volume XLIV-4/W1-2020, 2020 3rd BIM/GIS Integration Workshop and 15th 3D GeoInfo Conference, 7–11 September 2020, London, UK
On the other hand, we find that under-segmentation is not a significant issue with our method, as we do not observe any under-segmentation for over 99% of ground-truth segments. And even in cases where under-segmentation occurs, this is largely due to features such as boards mounted tightly to walls that are hard to recognise using point cloud geometry alone and would require the inclusion of colour information into the clustering. We report results for fourteen classes, of which we detail 9 among structural (ceiling, floor, walls), transition (windows, doors), furniture (tables, chairs, boards) and clutter elements as in Table 2.
Areas Ceil. 0 Floor Wall 1 2 Win. 5 Door 6 Table Chair Board Clutter F1-7 8 11 13 score A-1 98.8 98.4 86.8 80.0 73.8 84.6 83.9 33.1 83.1 88.0 A-2 97.0 89.2 89.0 97.6 67.9 87.6 97.2 33.4 67.2 86.9 A-3 98.5 99.3 87.0 72.8 79.0 88.5 93.1 30.4 78.0 89.2 A-4 95.3 98.8 89.4 82.5 79.5 86.6 89.9 16.3 71.5 88.4 A-5 97.6 99.0 89.4 69.0 83.7 85.9 81.3 4.1 71.7 88.1 A-6 98.1 98.8 86.5 77.6 76.5 88.9 90.1 19.9 80.7 88.3
Table 2 Quantitative results of the object-based classification
While the data presents several challenges, we obtained resulting F1-scores that globally vary between 88.0% and 89.2%. Planar dominant classes are among the best-recognised classes, and the improvement margin is found for the board, windows, doors and clutter classes. It is interesting to note that while chair variation in orientation, shape, size and distribution is really high, the detection rate is still performing above 83.9%, and is consistent independently of the considered dataset as seen in Figure 7.
Figure 7 Ground-truth vs prediction for Area 5 of the PCID5
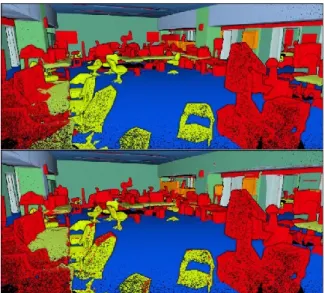
Also, the clutter class presents a relatively low score as it contains a large variance in the "objects" it contains, thus providing a great candidate to improve scores at the classification level by refining elements within (see Figure 8).
Figure 8 Ground Truth (Top) vs Classified result (Bottom)
We can also note that columns and beams (in light green and blue in Figure 8), geometrically share similar properties to walls for some portions, and thus can become another problematic case to improve on. To get better insights on its performances, we present in Table 3 the associated precision and recall scores over the biggest area of the S3DIS dataset: Area 5.
Area 5 Ceil. Floor Wall Win. Door Table Chair Board Clutter W. Av 0 1 2 5 6 7 8 11 13 precision 97.2 98.9 82.8 92.4 90.8 85.4 74.8 88.1 79.2 89.2 recall 97.9 99.2 97.1 55.1 77.6 86.3 89.0 2.1 65.4 88.9 f1-score 97.6 99.0 89.4 69.0 83.7 85.9 81.3 4.1 71.7 88.1 mIoU 95.3 98.1 80.8 52.7 72.0 75.3 68.5 2.1 55.9 78.7
Table 3 Precision, recall, F1-scores and mIoU over Area 5
We note that the precision and recall values are high and close to one another for the three structural classes. However, the windows and door classes show a drop in recall scores, which is explained by the direct proximity and similar geometry to surrounding walls. The problematic class (expected) is the board class, with a recall score of 2.1%, thus no close to no-detection. This is due to the undiscernible geometric change that group points within wall segments and would be detectable only using additional information such as colour.
Finally, while the clutter class is an overly broad class, performances are still above 71% F1-score but give a great
improvement margin with a low recall score at 65.4%. In general, low recall values shown in Table 3 are mainly due to the geometric distinctiveness challenge of classes definitions, which is not found in the segmented point cloud. This resemblance is due to a lack of contrasting geometric criteria for accurately defining the classes separation. In future work, we will study the addition of other characteristics such as spectral information, to allow a more distinct feature definition of each class.
5. DISCUSSIONS AND FUTURE WORKS
In this article, we provide an unsupervised segmentation framework followed by an object-based classification within 3D point clouds. A Random Forest classifier is applied to label all segments, depending on their feature values. A direct gain is that the segmentation reduces the number of inputs to be classified by several magnitudes (e.g. from several billion of points to a hundred thousand segments). This improves the scalability of computationally expensive machine-learning algorithms to enable the semantic segmentation of large point clouds. One of the most crucial steps in the approach is achieving a valid segmentation. It should keep points from different target objects separated, while creating segments that are sufficiently large to provide meaningful additional features, such as segment size, shape, and number of neighbours. The analysis of indoor objects is especially challenging since object definitions are sometimes ambiguous and gradual transitions exist at object boundaries. Our approach provides an innovative way to tackle these challenges and improve the scene understanding through spatial contextualisation and instancing such as in Figure 9.
Figure 9 Segment instances for each class (left) and their associated class (right)
To test the robustness of the "one-button" method to varying scenarios, several experiments are conducted on other complex
The International Archives of the Photogrammetry, Remote Sensing and Spatial Information Sciences, Volume XLIV-4/W1-2020, 2020 3rd BIM/GIS Integration Workshop and 15th 3D GeoInfo Conference, 7–11 September 2020, London, UK
buildings with labelled point clouds from different sensors and platforms, in different environments (indoor, outdoor, buildings) and with different objects of interests (AEC-related, BIM-related, navigation-related). Current investigation are very promising (E.g. Figure 10), and results produced by applying the self-learning parameter estimation method are found to be preferable to manually selected and fine-tuned parameter values.
Figure 10 Segmentation results on a noisy indoor point cloud captured by a hand-held laser scanner Zeb-Revo
In particular, we found that we would often overestimate the ideal values for ε and τ to avoid a costly re-computation of normal estimate and segmentation. In contrast, lower values for these parameters would afford a better extraction of detailed information from the point cloud. Generally, results show that the approach outperforms conventional methods both in computing performances and accuracy. It is very robust to noise, misadjusted density and provides a clear hierarchical point grouping where fully unsupervised parameter estimation gives better results than "user-defined" parameters. The presented method is easy to implement. It is independent from any high-end GPUs, and mainly leverages the processor and the Random-Access Memory in its current state. It is crucial for many companies that do not possess high-end servers, but rather web-oriented (no GPU, low RAM, and Intel Core processors). As such, it is easily deployable on a client-server infrastructure, without the need to upgrade the server-side for offline computations. It is to expect a coherent result within 10 minutes for a dataset of 100 million points.
By conducting the experiments, we stressed that using segments as the base unit for classification is a promising alternative to the classification of individual points. Indeed, the geometric detail and accuracy of the original 3D point cloud is preserved for use in further analyses, while permitting an instance delineation per class. The object-based classification using Random Forest classifier delivers state of the art results with a minimal training time and a particularly useful potential to generalise. One can incorporate it in a semantic segmentation workflow easily by labelling a small sample of the data that was tested up to 25% of any dataset proving a small drop in correct prediction. We delineated F1-scores close to the sharpness results of the
segmentation. Down the line, it is used for extracting the surface of ceilings, walls, or floors if one wants to make digital quotations (Poux et al., 2017b); it can provide a basis for extracting semantic spaces (sub-spaces) organised regarding their function (Poux et al., 2017a, 2016); it can be used to provide a basis for floor plans, cut, section creation or visualisation purposes (Kharroubi et al., 2019). These are currently investigated as part of future works. As it stands, the methodology permits offline automatic segmentation, classification and modelling as shown in Figure 11.
Figure 11 Example of an .obj file automatically created from the segmentation results
Finally, the unsupervised segmentation and supervised classification is easily extensible by limiting over-segmentation. For example, one can differentiate clutter based on connectivity and proximities to enhance the classification further (e.g., clutter on top of a table may be a computer; clutter linked to the ceiling and in the middle of the room is a light source). Some of these potentials are addressed as research tracks.
6. CONCLUSION
Object-based classification has the benefit of using informative features such as contextual relationships for classification and object interpretation. However, it is highly dependent on the previous tasks that lead to the creation of a segmented dataset, and associated feature set. Our unsupervised approach permits to ensure a robust segmentation delivering sharpness scores close to 90%. It also provides a fully automatic workflow without human supervision. Future work will explore the possibility given by the approach to generalise to complex scenes and massive datasets, as well as self-supervised classification possibilities to provide hyper-automation.
AKNOWLEDGEMENTS
The authors would like to thank Ordnance Survey GB (www.ordnancesurvey.co.uk) and 1Spatial (www.1spatial.com/) as well the Travel Award sponsored by the open access journal Remote Sensing published by MDPI for sponsoring the publication of this paper.
REFERENCES
Bassier, M., Vergauwen, M., Poux, F., 2020. Point Cloud vs. Mesh Features for Building Interior Classification. Remote Sensing 12, 2224. https://doi.org/10.3390/rs12142224
Belgiu, M., Drăguţ, L., 2016. Random forest in remote sensing: A review of applications and future directions. ISPRS Journal of Photogrammetry and Remote Sensing 114, 24–31. https://doi.org/10.1016/j.isprsjprs.2016.01.011
Deschaud, J.-E., Goulette, F., 2010. A fast and accurate plane detection algorithm for large noisy point clouds using filtered normals and voxel growing, in: 3DPVT.
Dong, Z., Yang, B., Hu, P., Scherer, S., 2018. An efficient global energy optimisation approach for robust 3D plane segmentation of point clouds. ISPRS International Journal of Photogrammetry
and Remote Sensing 137, 112–133.
https://doi.org/10.1016/j.isprsjprs.2018.01.013
The International Archives of the Photogrammetry, Remote Sensing and Spatial Information Sciences, Volume XLIV-4/W1-2020, 2020 3rd BIM/GIS Integration Workshop and 15th 3D GeoInfo Conference, 7–11 September 2020, London, UK
Hulik, R., Spanel, M., Smrz, P., Materna, Z., 2014. Continuous plane detection in point-cloud data based on 3D Hough Transform. Journal of visual communication and image representation 25, 86–97.
Kharroubi, A., Hajji, R., Billen, R., Poux, F., 2019. CLASSIFICATION AND INTEGRATION OF MASSIVE 3D POINTS CLOUDS IN A VIRTUAL REALITY (VR) ENVIRONMENT. International Archives of the Photogrammetry, Remote Sensing and Spatial Information Sciences 42, 165–171. https://doi.org/10.5194/isprs-archives-XLII-2-W17-165-2019
Li, B., Schnabel, R., Klein, R., Cheng, Z., Dang, G., Jin, S., 2010. Robust normal estimation for point clouds with sharp features. Computers & Graphics 34, 94–106.
Li, L., Yang, F., Zhu, H., Li, D., Li, Y., Tang, L., 2017. An improved RANSAC for 3D point cloud plane segmentation based on normal distribution transformation cells. Remote Sensing 9, 433.
Limberger, F.A., Oliveira, M.M., 2015. Real-time detection of planar regions in unorganised point clouds. Pattern Recognition 48, 2043–2053.
Liu, Y.-S., Ramani, K., 2009. Robust principal axes determination for point-based shapes using least median of squares. Computer aided design 41, 293–305. https://doi.org/10.1016/j.cad.2008.10.012
Mayr, A., Rutzinger, M., Bremer, M., Oude Elberink, S., Stumpf, F., Geitner, C., 2017. Object-based classification of terrestrial laser scanning point clouds for landslide monitoring. The
Photogrammetric Record 32, 377–397.
https://doi.org/10.1111/phor.12215
Miliaresis, G., Kokkas, N., 2007. Segmentation and object-based classification for the extraction of the building class from LIDAR DEMs. Computers and Geosciences 33, 1076–1087. https://doi.org/10.1016/j.cageo.2006.11.012
Poux, F., Billen, R., 2019. Voxel-based 3D point cloud semantic segmentation: unsupervised geometric and relationship featuring vs deep learning methods. ISPRS International Journal of Geo-Information 8, 213. https://doi.org/10.3390/ijgi8050213 Poux, F., Hallot, P., Neuville, R., Billen, R., 2016. SMART POINT CLOUD: DEFINITION AND REMAINING CHALLENGES. ISPRS Annals of Photogrammetry, Remote Sensing and Spatial Information Sciences IV-2/W1, 119–127. https://doi.org/10.5194/isprs-annals-IV-2-W1-119-2016 Poux, F., Neuville, R., Hallot, P., Billen, R., 2017a. MODEL FOR SEMANTICALLY RICH POINT CLOUD DATA. ISPRS Annals of Photogrammetry, Remote Sensing and Spatial Information Sciences IV-4/W5, 107–115. https://doi.org/10.5194/isprs-annals-IV-4-W5-107-2017 Poux, F., Neuville, R., Nys, G.-A., Billen, R., 2018. 3D Point Cloud Semantic Modelling: Integrated Framework for Indoor Spaces and Furniture. Remote Sensing 10, 1412. https://doi.org/10.3390/rs10091412
Poux, F., Neuville, R., Van Wersch, L., Nys, G.-A., Billen, R., 2017b. 3D Point Clouds in Archaeology: Advances in Acquisition, Processing and Knowledge Integration Applied to
Quasi-Planar Objects. Geosciences 7, 96. https://doi.org/10.3390/geosciences7040096
Rabbani, T., Heuvel, F. Van Den, 2005. Efficient hough transform for automatic detection of cylinders in point clouds, in: International Archives of the Photogrammetry, Remote Sensing and Spatial Information Sciences - ISPRS Archives. Enschede, pp. 60–65.
Rutzinger, M., Höfle, B., Hollaus, M., Pfeifer, N., 2008. Object-Based Point Cloud Analysis of Full-Waveform Airborne Laser Scanning Data for Urban Vegetation Classification. Sensors 8, 4505–4528. https://doi.org/10.3390/s8084505
Schnabel, R., Wahl, R., Klein, R., 2007. Efficient RANSAC for Point Cloud Shape Detection. Computer Graphics Forum 26, 214–226. https://doi.org/10.1111/j.1467-8659.2007.01016.x Son, H., Kim, C., 2017. Semantic as-built 3D modeling of structural elements of buildings based on local concavity and convexity. Advanced Engineering Informatics 34, 114–124. https://doi.org/10.1016/j.aei.2017.10.001
Vo, A.V., Truong-Hong, L., Laefer, D.F., Bertolotto, M., 2015. Octree-based region growing for point cloud segmentation. ISPRS Journal of Photogrammetry and Remote Sensing 104, 88– 100. https://doi.org/10.1016/j.isprsjprs.2015.01.011
Vosselman, G., Coenen, M., Rottensteiner, F., 2017. Contextual segment-based classification of airborne laser scanner data. ISPRS Journal of Photogrammetry and Remote Sensing 128, 354–371. https://doi.org/10.1016/j.isprsjprs.2017.03.010 Wang, J., Lindenbergh, R., Menenti, M., 2017. SigVox – A 3D feature matching algorithm for automatic street object recognition in mobile laser scanning point clouds. ISPRS Journal of Photogrammetry and Remote Sensing 128, 111–129. https://doi.org/10.1016/j.isprsjprs.2017.03.012
Weber, C., Hahmann, S., Hagen, H., 2010. Sharp feature detection in point clouds, in: International Conference on Shape Modeling and Applications. IEEE, Washington, United States, pp. 175–186. https://doi.org/10.1109/SMI.2010.32
Weinmann, M., Jutzi, B., Hinz, S., Mallet, C., 2015. Semantic point cloud interpretation based on optimal neighborhoods, relevant features and efficient classifiers. ISPRS Journal of Photogrammetry and Remote Sensing 105, 286–304. https://doi.org/10.1016/j.isprsjprs.2015.01.016
Xiao, J., Zhang, Jianhua, Adler, B., Zhang, H., Zhang, Jianwei, 2013. Three-dimensional point cloud plane segmentation in both structured and unstructured environments. Robotics and Autonomous Systems 61, 1641–1652.
Xie, Y., Tian, J., Zhu, X.X., 2019. A Review of Point Cloud Semantic Segmentation. arXiv.org 1–51.
Xu, B., Jiang, W., Shan, J., Zhang, J., Li, L., 2016. Investigation on the weighted ransac approaches for building roof plane segmentation from lidar point clouds. Remote Sensing 8, 5. Zhang, J.X., Lin, X.G., Lin, X.G., 2012. object-based classification of urban airborne lidar point clouds with multiple echoes using svm, in: ISPRS Annals of the Photogrammetry, Remote Sensing and Spatial Information Sciences. pp. 135–140. https://doi.org/10.5194/isprsannals-I-3-135-2012
The International Archives of the Photogrammetry, Remote Sensing and Spatial Information Sciences, Volume XLIV-4/W1-2020, 2020 3rd BIM/GIS Integration Workshop and 15th 3D GeoInfo Conference, 7–11 September 2020, London, UK